

Abstract
The hippocampus is a brain area characterized by its high plasticity, observed at all levels of organization: molecular, synaptic and cellular, the latter refering to the capacity of neural precursors within the hippocampus to give rise to new neurons throughout life. Recent findings suggest that promoter methylation is a plastic process subjected to regulation, and this plasticity seems to be particularly important for hippocampal neurogenesis. We have detected the enzyme GNMT (a liver metabolic enzyme) in the hippocampus. GNMT regulates intracellular levels of SAMe, which is a universal methyl donor implied in almost all methylation reactions and, thus, of prime importance for DNA methylation. In addition, we show that deficiency of this enzyme in mice (Gnmt−/−) results in high SAMe levels within the hippocampus, reduced neurogenic capacity, and spatial learning and memory impairment. In vitro, SAMe inhibited neural precursor cell division in a concentration-dependent manner, but only when proliferation signals were triggered by bFGF. Indeed, SAMe inhibited the bFGF-stimulated MAP kinase signaling cascade, resulting in decreased cyclin E expression. These results suggest that alterations in the concentration of SAMe impair neurogenesis and contribute to cognitive decline.
Keywords: neurogenesis, neural progenitor cells, memory, learning, glycine N-methyltransferase, S-adenosylmethionine
INTRODUCTION
Changes in synaptic efficiency and connectivity within the adult hippocampus, mediated by epigenetic mechanisms, facilitate memory and learning tasks (Miller and Sweatt, 2007; Roth and Sweatt, 2009). Moreover, new neurons are formed throughout life in the dentate gyrus (DG) of the hippocampus as a specialized form of plasticity, which in addition to changes in connectivity of existing neurons, contribute to learning and memory. New neurons are generated from glial-like cells, which can give rise to neural progenitor cells (NPC). These cells can commit to a neuronal fate and become mature neurons, which will finally integrate into existing neuronal circuits (Tropepe, 2007). It has been recently described that adult hippocampal neurogenesis is regulated by dynamic epigenetic mechanisms based on DNA methylation (Feng et al., 2005; Ma et al., 2009; Zhao et al., 2003), which modify the expression of transcription factors and growth factors, thus determining NPC fate (reviewed in (Covic et al., 2010)).
The cellular methylation capacity depends on the availability of methyl donors and on methyltransferase activity. Intracellular methyl donors are generated within the methionine (Met) cycle, also known as one-carbon metabolism, after the conversion of Met into S-adenosyl-methionine (SAMe), which is the prime biological methyl donor and one of the most versatile compounds in nature (for review see (Lu and Mato, 2012)); this conversion, outlined in Fig. 1, is catalyzed by methionine adenosyltransferase (MAT), which produces SAMe from dietary methionine and ATP (Cantoni, 1975). SAMe participates in almost all biological methylation reactions and renders S-adenosylhomocysteine (SAH) as a byproduct (Fig. 1). Given that SAH is a potent allosteric inhibitor of methyltransferases (revised in (Lu and Mato, 2012)), the activity of these enzymes depends not only on the availability of the substrate SAMe, but also on the cellular concentration of SAH; in brief, the cellular methylation potential is ultimately conditioned by the ratio SAMe/SAH (Clarke S, 2001). SAH withdrawal depends on the enzyme SAH hydrolase (SAHH), which can reversibly split SAH into homocysteine (Hcy) and adenosine (Finkelstein et al., 1974); although, in physiological conditions, this reaction occurs in the direction of hydrolysis (Fig. 1), increased Hcy levels may easily shift the reaction towards SAH accumulation and methyltransferase inhibition (Lu et al., 2012). A great part of the Hcy produced in cells is remethylated back to Met. Dietary methione is metabolized mainly in the liver and dysfunction of this set of reactions within the liver can result in excess Hcy that is then released to the bloodstream thus causing hyperhomocysteinemia (HHcy; elevated levels of Hcy in plasma), which has been reported as a risk factor for neurological diseases like Alzheimer’s disease, vascular dementia, neurodegenerative disorders and cognitive decline (Miller, 1999; Miller, 2002; Miller et al., 2003; Quadri et al., 2004; Seshadri et al., 2002).
FIGURE 1. Methionine metabolism.
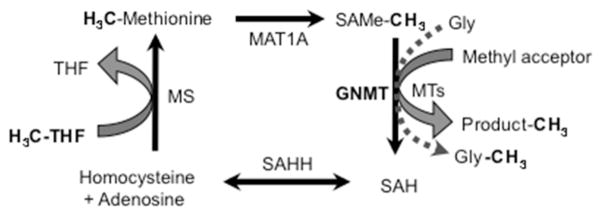
The scheme shows the main reactions involved in methionine metabolism and substrate methylation (see Introduction for details). Abbreviations: MAT: methionine adenosyltransferase; SAMe: S-adenosylmethionine; SAH: S-adenosylhomocysteine; MTs: methyltransferases; GNMT: Glycine N-methyltransferase; Hcy: homocysteine; SAHH: SAH hydrolase; THF: tetrahydrofolate; MS: methionine synthase. Methyl groups exchanged by these molecules are represented darker.
We have previously demonstrated that induced HHcy in rodents impairs adult neurogenesis by decreasing neural progenitor cell proliferation in the two main neurogenic regions of adult brain, the DG of the hippocampus and the subventricular zone (SVZ) (Rabaneda et al., 2008). However, given that disturbances on the SAMe/SAH ratio lead to dramatic changes in DNA and protein methylation (Coppede, 2010; Mastroeni et al., 2011; Miller et al., 2003), the observed effects of HHcy could likely be indirect; thus, high Hcy levels may potentially result in i) SAH accumulation and SAMe/SAH decrease, or ii) excessive Hcy remethylation, giving rise to increased Met and SAMe levels, and a consequent SAMe/SAH increase. Based on the reported antiproliferative effect of elevated levels of SAMe on hepatocytes and other cell types (Cai et al., 1998; Martinez-Chantar et al., 2006), it is reasonable to hypothesize that elevated SAMe levels within the hippocampus may exert an anti-neurogenic effect, and may be ultimately responsible for the decrease of neurogenesis observed in hyperhomocysteinemic mice.
In order to further understand how unbalanced methionine metabolites may affect adult neurogenesis and cognitive performance, we have analyzed herein the effects of elevated levels of SAMe on neural progenitor cell proliferation in vitro. In addition, we have found that in glycine N-methyltransferase (GNMT) knock-out mice, a mouse model with elevated concentrations of SAMe in plasma, neurogenesis is impaired in the DG and also in the other neurogenic region of the adult brain, the SVZ. Finally, we have detected expression of the liver enzyme GNMT in the hippocampus of wild-type mice. Since the only-known function of GNMT is to maintain an appropriate SAMe/SAH ratio within cells, its expression suggests that methionine metabolites might be tightly regulated within the hippocampus. Indeed, we show that GNMT deficiency leads to an elevated SAMe/SAH ratio within the brain.
MATERIALS AND METHODS
SVZ cell isolation and culture
NPC for in vitro studies were obtained from the SVZ of C57BL/6 wild-type postnatal mice (P7) following the procedure reported previously (Torroglosa et al., 2007), and maintained as neurosphere cultures as described before (Rabaneda et al., 2008). To test the effects of SAMe on NPC proliferation, cells disaggregated from neurospheres were seeded adhered onto a poly-L-ornithine (PLO) substrate. SAMe was added at the time of seeding at a final concentration of 200 μM, unless otherwise specified.
Immunocytochemistry and in vitro cell death
Cells dissociated from neurospheres were seeded onto PLO-coated 8-well glass slide chambers (Nalgene Naperville, IL, USA) and maintained for 48 h in defined medium supplemented with the indicated growth factors. SAMe was added at the time of seeding. Immunocytochemistry and positive cells quantification were performed as described before (Rabaneda et al., 2008). Antibodies used were: rabbit monoclonal anti-Ki67 (dilution 1:1000) (Vector, Burlingame, CA), and goat anti-rabbit IgG (H+L) labeled with either AlexaFluor 568 (dilution 1:5000) or 488 (dilution 1:1000) (Invitrogen, Carlsbad, CA). Apoptosis was estimated by counting pycnotic nuclei after staining with DAPI (Sigma-Aldrich, St Louis MO, USA).
Western blot analysis
Cells from neurospheres were disaggregated and incubated for 1.5 h in the presence or absence of 200 μM SAMe; then, epidermal growth factor (EGF), basic fibroblast growth factor (bFGF) or a combination of both, were added to the cultures for 1.5 or 3 additional hours. Cells were then lysed and processed for Western blot analysis following a formerly described procedure (Rabaneda et al., 2008). Tissue samples were obtained as follows: mice were sacrificed by cervical dislocation and brains were immediately removed. Cortical or hippocampal tissues were dissected out and immediately frozen in liquid nitrogen. Later on, tissues were homogenized in Cell Lysis Buffer (Cell Signaling Technology, Boston, MA) containing protease inhibitors and centrifuged. Samples of total protein from hippocampus (80 μg), cerebral cortex (80 μg) and liver (30 μg) were used. Antibodies used: anti-pErk1/2 Tyr 202 and Tyr 204 (dilution 1:500), and anti-Erk1/2 (dilution 1:1000) from Cell Signaling Technology Inc. (Boston MA), anti-cyclin E (dilution 1:500) and anti-GNMT (dilution 1:1000) from Santa Cruz Biotechnologies (Santa Cruz, CA), anti α-tubulin (diution 1:1000) from Sigma-Aldrich, and anti-GAPDH (dilution 1:1000) from Chemicon (Millipore). Secondary antibodies were from Pierce Thermo-Fisher Scientific or from the WesternBreeze kit (Invitrogen, Carlsbad, CA).
Animal Subjects
Gnmt−/− and Mat1a−/− mice and their control counterparts were used throughout this study (Lu et al., 2001; Luka et al., 2006). Adult male mice were obtained from CIC Biogune Derio Bizkaia, Spain. Upon arrival mice were housed under controlled conditions of temperature (21–23°C) and light (LD 12:12) with free access to food (AO4 standard maintenance diet; SAFE, Épinay-sur-Orge, France) and water, and acclimated to environmental conditions for at least two weeks. Care and handling of animals were performed according to the Guidelines of the European Union Council (2010/63/EU), following the Spanish regulations (RD 1201/2005) for the use of laboratory animals.
Bromodeoxyuridine (BrdU) administration
Mice were injected intraperitoneally with the thymidine analog 5-bromo-2-deoxyuridine (BrdU; 120 mg/kg/day) for three consecutive days (Cameron and McKay, 2001). Two experimental groups of mice were injected simultaneously, and were sacrificed 24 h (Group 1) or 28 days (Group 2) after the last BrdU injection. Animals were deeply anesthetized with a lethal dose of pentobarbital, and transcardially perfused with 4% paraformaldehyde. Five wild-type and 5 mutant Gnmt−/− mice were used in each experimental group.
Brain processing and immunohistochemistry
Brain removal, processing and immunohistochemical techniques to detect BrdU, Ki67, doublecortin (DCX) or NeuN were performed as previously described (Rabaneda et al., 2008). Primary antibodies used: mouse monoclonal anti-BrdU (dilution 1:100) from Dako (Hamburg, Germany), rabbit monoclonal anti-Ki67 (dilution 1:1000) from Vector (Burlingame, CA), goat polyclonal anti-DCX (dilution 1:200) from Santa Cruz Biotechnologies (Santa Cruz, CA, USA) and mouse monoclonal anti-NeuN (dilution 1:20) from Millipore (Billerica MA, USA). Secondary antibodies: AlexaFluo 488 anti-rabbit IgG (dilution 1:1000), AlexaFluo 633 anti-goat IgG (dilution 1:400) and AlexaFluo 568 anti-mouse IgG (dilution 1:5000) from Molecular Probes (Invitrogen; Carlsbad, CA) and biotinylated anti-mouse IgG (dilution 1:250) from GE Healthcare (Albany, NY, USA).
Quantification of neurogenesis in brain sections
NPC proliferation was detected by counting BrdU+ or Ki67+ nuclei in every fifth section of the DG of the hippocampus and the SVZ (14–16 sections per brain), under optical microscopy, as previously described (Rabaneda et al., 2008). NPC survival was estimated by the number of BrdU+ nuclei remaining 28 days after BrdU administration (group 2) expressed as percentage of that found 24 h after BrdU administration (group 1). Finally, the generation of new mature neurons from NPC was determined by double staining for BrdU and the mature neuron marker NeuN, and expressed as the percentage of BrdU+ cells containing NeuN. Double fluorescence immunostaining was quantified using Leica TCS SP2 Spectral confocal microscopy. The DG volume was calculated as described before (Rabaneda et al., 2008).
Spatial memory and learning tests
Three to four-month old mice were used to assess spatial memory. A total of 8 mice per group were tested using the Morris Water Maze (MWM) as described in Romero-Grimaldi et al. (Romero-Grimaldi et al., 2006). The tank, filled with white-colored water, was 95 cm in diameter and contained a 10 cm-diameter escape platform, hidden underwater and located in the same quadrant and position throughout the training tests. Training tests: each mouse was tested once each day on 4 consecutive days until the recorded time showed no improvement. On each trial, mice were taken out of the water once they found the platform or, alternatively, 1 minute after immersion, whichever occurred first. Memory test: on day 5, the platform was removed from the tank and each mouse was allowed to swim for 1 min. Time spent by the animal in the different quadrants as well as the swimming speed was quantified from recorded images using Smart software (Panlab/Harvard Apparatus; Holliston, MA USA).
Rotarod Performance Test
To measure motor skills, a Rotarod Performance Test (Panlab) was used. This consists of a rotating cylinder that can be gradually accelerated to a desired rate. Animals were allowed to adapt to the rotating cylinder at 4 rpm until they showed coordinated walking and could stay on the rotarod. Then, the rod was accelerated from 4 to 40 rpm over 5 min, and the time spent by each animal walking on the cylinder until falling was quantified.
RNA isolation and reverse transcription
Whole hippocampus was dissected out from freshly-cut brain coronal slices spanning approximately from Bregma −0.94 to Bregma −3.88. As independent structures, hippocampi come out almost intact, with little need to make cuts in the tissue, which minimizes cross contamination with other brain areas. After isolation, hippocampi were cut in small pieces with a scalpel and immersed in Trizol Reagent (Invitrogen) for RNA extraction. Dissected tissues were homogenized in TRIzol reagent (Invitrogen). Total RNA was isolated following manufacturer’s instructions. First-strand cDNA was prepared from total RNA using random primers and the SuperScript II Reverse Transcriptase Kit, in the presence of RNaseOUT ribonuclease inhibitor (Invitrogen).
PCR and real time-PCR
Primers for GAPDH (Fw: 5′-TCCACTCATGGCAAATTCAA; Rw: 5′-TTTGATGTTATGGGGTCTCG) were synthesized by Sigma-Aldrich. Primers for GNMT were obtained ready-to-use from Qiagen. GNMT mRNA was semi-quantified by real time-PCR, using the iQ SYBR Green Supermix system and a MiniOpticon thermal cycler (Bio-Rad Hercules, CA, USA) according to manufacturer’s instructions. GAPDH mRNA levels were used for normalization. Reactions were run in duplicate, and a minimum of 3 animals were used independently for each determination. Amplification specificity was confirmed by melting-curve analysis of the PCR products. The relative abundance of GNMT mRNA in each sample was calculated as 2−ΔCt. No signal was detected in non-template or non-RT controls.
Analysis of SAMe and SAH concentrations in adult brain
SAMe and SAH concentrations were analyzed in the brains of wild-type and Gnmt−/− mice. Frozen tissues (100 mg) from isolated hippocampus, cortex, and the rest of the brain were deproteinized in ice-cold perchloric acid followed by centrifugation. Solution was neutralized and applied to an OASIS (Waters, Milford MA, USA) solid-phase extraction column as previously described (Struys et al., 2000). Calibration standards at concentrations of 1, 5, 10 and 25 μmol/L for both SAMe and SAH were prepared in solutions of H2O-methanol (85:15, v/v) containing 0.1% HCO2H. Concentrations of SAMe and SAH in the tissue samples were calculated by interpolation of the corresponding analyte peak-area (m/z 399 for SAMe and m/z 385 for SAH) into the linear regression line for the calibration curve, which was obtained by plotting the peak-area ratio versus concentration of the external standards. All analyses were performed in duplicate, using a LCQ ThermoQuest ion trap mass spectrometer (Thermo-Fisher Scientific, Rockford IL, USA). Liquid chromatography was performed on a Chromolith® Fast Gradient C18 endcapped analytical column (2 × 50 mm; Merck, Darmstadt, Germany) using H2O-methanol (85:15, v/v) containing 1 mL/L HCO2H, as mobile phase at a flow rate of 0.15 mL/min.
Statistical Analysis
In behavioral studies statistical analysis was performed using a paired t-test and one-way ANOVA for repeated measures followed by Student-Newman-Keuls test (ANOVA RM-SNK). In all cases a probability ≤ 0.05 was considered significant. The rest of statistical analysis of both in vitro and in vivo experiments was performed using the Student t-test. In all cases differences were considered significant when p ≤ 0.05.
RESULTS
Elevated concentrations of SAMe inhibited proliferation of NPC in vitro
In order to determine whether SAMe exerted a similar effect on NPC, we studied proliferation in SVZ-derived NPC cultures exposed to high SAMe concentrations. Adhered NPC were stimulated with EGF, bFGF, or a combination of both growth factors, in the absence or presence of 200 μM SAMe, and the percentage of cycling cells (Ki67+) was quantified in these cultures. Ki67+ cells decreased significantly with SAMe treatment when cultures were exposed to bFGF, either alone or in combinations with EGF, but not when cultures were exposed to EGF alone (Fig. 2A and B). The inhibitory effect of SAMe on bFGF-stimulated NPC proliferation was concentration dependent, with an IC50 of 65.3 μM (Fig. 2C). No effects of SAMe on the percentage of pycnotic nuclei was found on bFGF stimulated cells (Fig. 2D), nor in EGF or EGF+bFGF stimulated cells (not shown). These results indicated that SAMe specifically impaired bFGF-induced NPC proliferation in vitro.
FIGURE 2. Effect of SAMe on NPC proliferation, Erk1/2 phosphorylation and cyclin E expression.

(A) Representative fluorescence microscopy images of adhered SVZ NPC cultures grown in the presence of bFGF for 48 h. Cells were immunostained for Ki67 and nuclei were counterstained with DAPI. Left panels: control cultures; right panels: cultures treated with 200 μM SAMe. (B) Percentage of Ki67+ mitotic cells in cultures grown with the combination of EGF+bFGF or with either growth factor alone, in the absence or presence of 200 μM SAMe. Data are means ± SE of the results obtained in 3–4 independent experiments. (C) Dose-dependent effect of SAMe on bFGF-stimulated NPC proliferation. Data are means ± SE of the results obtained in 3 independent experiments (D) Percentage of pycnotic nuclei in control and SAMe (200 μM)-treated cultures grown for 48 h in the presence of bFGF. Data are means ± SE of the results obtained in 3 independent experiments (E, F) Inhibitory effect of SAMe on bFGF-stimulated ERK1/2 phosphorylation. (E) Representative autoradiography images obtained after immunodetection of phospho-Erk1/2, total Erk1/2 and α-tubulin, in the culture conditions indicated, are shown. bFGF was left for 1.5 h, and SAMe was added 1.5 h before the addition of bFGF. (F) Densitometric semi-quantification of p-Erk1/2, normalized to total Erk1/2 values. (G, H) Inhibitory effect of SAMe on ERK1/2 phosphorylation after stimulation with EGF+bFGF or EGF alone. (G) Representative autoradiography images obtained after immunodetection of p-Erk1/2, total Erk1/2 and α-tubulin, in the culture conditions indicated. Cells were incubated with the growth factors for 1.5 h, and SAMe was added 1.5 h before the addition of growth factors. (H) Densitometric semi-quantification of p-Erk1/2, normalized to total Erk1/2 values. (I–J) Inhibitory effect of SAMe on cyclin E expression after stimulation with bFGF. (I) Representative autoradiography images obtained after immunodetection of cyclin E and α-tubulin in the culture conditions indicated. Growth factor was left for 3 h; SAMe was added 1.5 h before the addition of bFGF. (J) Densitometric semi-quantification of cyclin E expression, normalized to α-tubulin values. In F, J and H, data are means ± SE of the results obtained in 3 independent experiments. Statistics: asterisks in B, F, J mean t-test, p<0.05. Scale bar = 50 μm.
SAMe disrupts bFGF signaling
The previous result suggested that abnormally elevated SAMe concentrations specifically disrupted the bFGF signaling cascade. Therefore, we analyzed the effects of SAMe on bFGF downstream signals. In the presence of SAMe, the bFGF-stimulated phosphorylation of extracellular regulated kinases Erk1/2 was reduced by 44% in NPC cultures (Fig. 2E, F). However, in cultures stimulated with EGF no effect of SAMe was observed, and in cultures stimulated with a combination of EGF+bFGF a reduction on Erk1/2 phosphorylation was observed that was not statistically significant (Fig. 2G, H), We then focused on studying the effect of SAMe on bFGF-stimulated cyclin E expression. We found that it was reduced by 54% when SAMe was added to the cultures (Fig. 2I, J).
Evaluation of neurogenesis in Gnmt−/− and Mat1a−/− mouse brains
In order to evaluate whether the effects observed in cell cultures occurred in vivo as well, we evaluated neurogenesis in a mouse model characterized by elevated plasma levels of SAMe and methionine (Gnmt−/− mice) (Luka et al., 2006). To be able to discriminate between the possible effects of high SAMe levels and high Met levels, we tested Mat1a −/− mice in parallel, which exhibit an elevated concentration of plasma methionine but no alterations on plasma SAMe (Lu et al., 2001). The process of adult neurogenesis that occurs mainly within the DG of the hippocampus and the SVZ includes NPC proliferation, survival, and differentiation, first into neuroblasts, and later on, into mature neurons. In order to test the effects of Gnmt−/− and Mat1a−/− mutations on the generation of new neurons within the adult brain, we initially analyzed proliferation of NPC in both mouse models. The number of cycling cells (Ki67+) in the DG granule cell layer of Gnmt−/− mice (236 ± 101 Ki67+ nuclei/DG) was 53% lower than in wild-type mice (495 ± 126 Ki67+ nuclei/DG) (Fig. 3A–C). In contrast, Mat1a−/− mice did not exhibit any statistically significant differences in the total number of Ki67+nuclei (250 ± 63 nuclei/DG) compared to control Mat1a+/+ mice (328 ± 118 nuclei/DG) (Fig. 3D). Volume analysis revealed that Gnmt knockout mice had a significantly smaller DG size than control mice (Fig. 3E). No difference in DG volume was observed between Mat1a−/− mice and their wild-type littermates (not shown). Similarly to DG, proliferation of NPC within the SVZ of Gnmt−/− mice was reduced (Fig. 4A–C), whereas no change was observed in Mat1a−/− mice (Fig. 4D). These findings demonstrated that GNMT, but not MAT1A, deficiency impaired NPC proliferation within the two main neurogenic areas of the adult brain.
FIGURE 3. Effect of Gnmt−/− and Mat1a−/− mutations on the proliferation of hippocampal NPC.
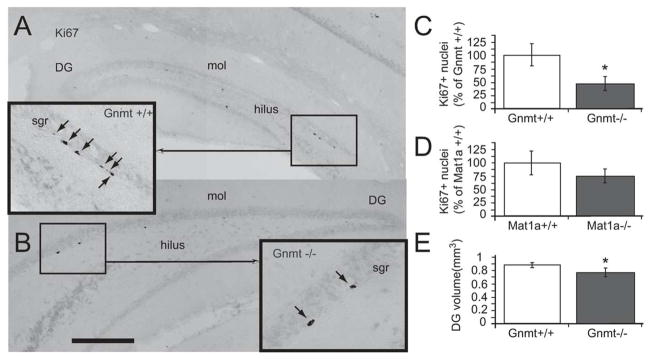
(A, B) Photomicrographs show coronal sections processed for Ki67 immunohistochemistry to point out mitotic cells in the DG of the hippocampus of Gnmt+/+ (A) or Gnmt−/− (B) mice. Abbreviations: DG: dentate gyrus; Sgr: subgranular layer; mol: molecular layer. (C) Quantification of the total number of Ki67+ nuclei within the DG of the hippocampus in Gnmt+/+ (open bars) and Gnmt−/− (filled bars) mice. (D) Quantification of the total number of Ki67+ nuclei within the DG of the hippocampus in Mat1a+/+ (open bars) and Mat1a−/− (filled bars) mice. (E) Quantification of DG volume in Gnmt+/+ (open bars) and Gnmt−/− (filled bars) mice. 6 mice of each genotype (Gnmt+/+, Gnmt−/−, Mat1a+/+, and Mat1a−/−) were used. Statistics: asterisks mean t-test, p<0.05. Scale bar: 100 μm.
FIGURE 4. NPC proliferation in the SVZ of Gnmt−/− and Mat1a−/− mice.

(A, B) Photomicrographs show coronal sections processed for Ki67 immunohistochemistry to point out mitotic cells in the subventricular zone (SVZ) of Gnmt+/+ (A) and Gnmt−/− (B) mice. Right panels are enlarged images of the squared regions. Abbreviations: cc: corpus callosum; Cpu: caudate putamen; LV: lateral ventricle. (C) Quantification of the total number of Ki67+ nuclei within the SVZ of Gnmt+/+ (open bars) and Gnmt −/− (filled bars) mice. (D) Quantification of the total number of Ki67+ nuclei within the SVZ of Mat1a+/+ (open bars) and Mat1a−/− (filled bars) mice. 6 mice of each genotype (Gnmt+/+, Gnmt−/−, Mat1a+/+, and Mat1a−/−) were used. Statistics: asterisk in C means t-test, p<0.05. Scale bar: 100 μm.
Previous reports have demonstrated that most adult DG newborn cells enter apoptosis during the first 1–4 days of life, being then rapidly eliminated by phagocytes of the subgranular layer (Sierra et al., 2010). To evaluate whether the Gnmt−/− mutation affected NPC survival, Gnmt−/− and control mice received BrdU injections for three days, and were sacrificed either 24 h (group 1) or 28 days (group 2) after the last injection. Survival was estimated by the number of BrdU+ nuclei in group 2 expressed as percentage of that found in group 1. The values obtained for Gnmt−/− and Gnmt+/+ mice were not significantly different (25.3 ± 10.6 % vs 17.5 ± 4.1 %) (Fig. 5A–C), indicating that GNMT deficiency did not affect cell survival in the adult hippocampus during the 4-week period studied.
FIGURE 5. Analysis of NPC survival and quantification of newly-generated neurons within the DG of Gnmt−/− mice.

(A, B) Confocal photomicrographs (overlay image compositions) show representative adult-mouse brain coronal sections throughout the DG of the hippocampus from Gnmt+/+ (A) and Gnmt−/− (B) mice, 28 days after BrdU injection; merge images of triple immunolabeling for NeuN (green), BrdU (red) and GFAP (blue) are shown. (C) NPC survival within the DG: Quantification of surviving BrdU+ cells in Gnmt+/+ and Gnmt−/− mice 28 days after the last BrdU injection; results are represented as percentage of the total number of BrdU+ cells quantified in Gnmt+/+ and Gnmt−/− mice 3 days after the last BrdU injection. (D) Newly-generated neurons: Quantification of newly generated cells (BrdU+) positively stained for the neuronal marker NeuN in the DG of Gnmt+/+ and Gnmt−/− mice, 28 days after BrdU injection; the amount of BrdU/NeuN double-labeled cells is expressed as percentage of total BrdU+ cells. In C and D, 6 mice of each genotype (Gnmt+/+, Gnmt−/−) were used. Statistics: asterisk in D means t-test, p<0.05. Scale bar: 25 μm.
Additionally, the capacity of newly generated NPC to fully differentiate into neurons was analyzed using double immunohistochemistry to simultaneously detect BrdU and the marker of mature neurons NeuN in the DG of Gnmt+/+ and Gnmt−/− mice from group 2. In Gnmt−/− mice, the percentage of newly generated precursor cells (BrdU+) that differentiated into mature neurons expressing NeuN (BrdU+/NeuN+) within a 4-week period was smaller than that observed in the control group (40.3 ± 2.9 % vs 65.5 ± 4.3 %) (Fig. 5A–B, D), indicating that the lack of GNMT expression was indeed impairing new neuron formation within the adult hippocampus. Thus, not only NPC proliferation is reduced in Gnmt−/− mice, but also the capacity to differentiate into neurons of this diminished population of NPC is affected.
Spatial memory and learning tests in Gnmt−/− and Mat1a−/− mice
Since it is presently well established that reduced adult neurogenesis produces learning and memory impairments (Shors et al., 2002; Snyder et al., 2005; Winocur et al., 2006), we next investigated the possible effects of Gnmt−/− and Mat1a−/− mutations on cognitive performance, by using the Morris water maze (MWM) test. Latency time to find the escape platform was identical in both Mat1a−/− and Mat1a+/+ mice, with no differences found throughout the 4-day trials (Fig. 6B). However, control Gnmt+/+ mice were able to reach the hidden platform in significantly less time than Gnmt−/− mice on trial days 1, 3 and 4 (paired t-test; hashes in Fig. 6A). From day 1 to day 3, both Gnmt+/+ and Gnmt−/− mice showed a day-to-day significant decrease in the latency time needed to locate the platform (ANOVA RM-SKN, p < 0.005; Fig 6A). Despite the fact that learning speed was similar during these first three days, Gnmt−/− mice showed no further learning improvement on day 4, whereas control Gnmt+/+ mice still improved significantly (ANOVA RM-SKN, p < 0.005; Fig 6A). These results indicated that learning capacity of Gnmt−/− mice was compromised.
FIGURE 6. GNMT deficiency in mice impairs spatial learning and memory.

(A, B) Graphs show the day-to-day latency time needed by Gnmt−/− (A, open circles), Gnmt+/+ (A, filled circles), Mat1a−/− (B, open circles) and Mat1a+/+ (B, filled circles) mice to find the platform in a random-starting version of the Morris water maze (MWM) navigation task. (C, D) Time spent in each quadrant of the MWM by Gnmt−/− (C, filled columns), Gnmt+/+ (C, open columns), Mat1a−/− (D, filled columns) and Mat1a+/+ (D, open columns) mice, on the 5th day of training when the platform had been removed. (E, F) Average swimming speed measured in the MWM for each animal group (as indicated). (G, H) Average time spent by the mice in the Rota-rod accelerating cylinder before falling (animal groups are indicated). Statistics: Data are means ± SEM, n = 8 mice per group; hashes (#) in A mean paired t-test, p<0.005; asterisks (*) in D, E mean Anova for repeated measurements followed by Student-Newman-Krull, p<0.001 when time spent in the quadrant where the platform had been located during training (target) was compared with that spent in any other quadrant; hash (#) in D means paired t-test, p<0.005 when time spent by Gnmt+/+ in target quadrant was compared to that spent by Gnmt−/− mice.
On day five during the probe trial in which the escape platform was removed, Gnmt+/+ mice spent significantly more time at the expected target location than at others (ANOVA RM-SKN, p < 0.005), whereas this clear bias for the target quadrant was not found in Gnmt−/− mice (Fig. 6C). In contrast, Mat1a control and knockout groups spent more time in the target quadrant than in the rest of quadrants (ANOVA RM-SKN, p < 0.005) and no differences were observed between control and Mat1a−/− mice (Fig. 6D).
To rule out motor function impairments affecting mouse performance in the MWM, swimming speed was calculated and no variations were found between mouse groups (Fig. 6E–F). Additionally, motor coordination was tested using the Rotarod test (Fig. 6G–H), and the time spent on the accelerating cylinder until falling was similar in all control and knockout mice.
These results suggested that learning and memory retention are perturbed in Gnmt, but not Mat1a, knockout mice.
GNMT expression in the DG of the hippocampus
In an attempt to understand why GNMT deficiency impaired hippocampal neurogenesis and cognitive performance to such degree, we examined whether GNMT was expressed in the mouse hippocampus. The presence of mRNA encoding GNMT was analyzed by RT-PCR in wild-type hippocampus obtained from mice at three different ages: 7 days old (postnatal), 2 months old (adult) and 11 months old (elderly). GNMT mRNA was also assessed in cerebral cortex (for comparison purposes) and in undifferentiated cultures of SVZ- and hippocampus-derived NPC isolated from 7-day old postnatal mice; mouse liver tissue was used as a reference. GNMT mRNA expression was detected in adult hippocampal samples (Fig. 7A); quantitative real-time PCR revealed that no GNMT could be detected in the hippocampus of postnatal mice (Fig. 7B). However, a mild GNMT expression appeared in the hippocampus of 2-month old mice (0.17 ± 0.04 % of that found in liver, Fig. 7B), which decreased substantially in 11-month old mice, relative to the housekeeping GAPDH mRNA levels. In contrast, only trace levels of GNMT mRNA were found in cerebral cortex, in agreement with previously reported data (Tsai et al., 2010). GNMT mRNA was undetectable in NPC cultures similar to those subjected to SAMe treatment in Fig. 2 (Fig 7A, B).
FIGURE 7. Differential expression of GNMT in mouse hippocampus.

(A) RT-PCR detection of GNMT mRNA in the hippocampus of wild-type adult mouse brain. Liver tissue was used as a positive control; GAPDH mRNA was used as housekeeping template. The primers used are described in the Methods section. (B) Relative quantification of GNMT mRNA in the hippocampus of 7 day-, 2 month- and 11 month-old mice (as indicated). Liver tissue was included as a reference. Measurements were also made in cerebral cortex from 2 month-old mice and NPC neurosphere cultures obtained from 7-day postnatal SVZ and hippocampus (7-d NESf), where GNMT mRNA was undetectable. Results were normalized to GAPDH mRNA in each sample; n = 3–4. (C) Western blot detection of GNMT and GAPDH in liver and hippocampus homogenates. Same homogenates from Gnmt−/− mice were tested as negative controls. (D) Semi-quantification of hippocampus GNMT protein by densitometric analysis of Western blot bands. Results are referred to total liver GNMT and are the average of 4 different assays. Asterisk means paired t-test, p<0.005 when GNMT expression in the hippocampus of Gnmt+/+ is compared with that of Gnmt−/− mice. (E) SAMe and SAH concentrations in Gnmt+/+ and Gnmt−/− hippocampal homogenates. Data are means ± SE. Asterisk means paired t-test, p<0.05 when SAMe levels in the hippocampus of Gnmt+/+ are compared with those of Gnmt−/− mice.
The presence of GNMT protein in adult hippocampus was then analyzed by Western blot. A 33 kDa band corresponding to GNMT was found in hepatic and hippocampal protein homogenates obtained from Gnmt+/+, but not from Gnmt−/−, mice (Fig. 7C–D). Densitometric analysis indicated that hippocampal expression of this protein was 0.18 ± 0.01% of that observed in liver (Fig. 7D). No GNMT protein was detected in cultured NPC, or in cerebral cortex homogenates.
Measurement of hippocampal SAMe and SAH concentrations in wild-type and Gnmt−/− mice
In order to elucidate whether the lack of GNMT expression had an effect on the local concentrations of its substrate, SAMe, and/or its product, SAH, we measured both metabolites in homogenates obtained from whole brain, hippocampus, and cerebral cortex. SAMe concentration was approximately two fold higher in Gnmt−/− hippocampus than in wild-type controls (Fig. 7E). In contrast, neither cerebral cortex nor whole brain homogenates showed significant differences in SAMe concentrations when comparing control and knockout mice (0.011 ± 0.002 vs 0.015 ± 0.003 and 0.017 ± 0.002 vs 0.020 ± 0.002 nmol/mg of tissue, respectively). SAH concentrations were similar in the hippocampus of both animal groups (Fig. 7E). The fact that Gnmt−/− mouse brains showed increased levels of SAMe specifically in the hippocampus suggests that the lack of the hippocampal GNMT enzyme, and not the general loss of GNMT activity in liver and other tissues, is generating the rise in SAMe concentration.
DISCUSSION
Alterations in SAMe/SAH ratio have recently been linked to the development of Alzheimer’s disease, neurodegenerative dementia and cognitive impairment, thus suggesting a role for methylation reactions in the control of cognitive performance. In this paper, we demonstrate the presence, in the hippocampus, of the enzyme GNMT, which regulates intracellular levels of the methyl donor SAMe. We show that deficiency of this enzyme results in high SAMe levels within the adult hippocampus, reduced neurogenic capacity, and spatial learning and memory impairment. In vitro, SAMe inhibited neural precursor cell division in a concentration-dependent manner, but specifically when proliferation signals were triggered by bFGF. Indeed, SAMe inhibited the bFGF-stimulated MAP kinase signaling cascade, resulting in decreased cyclin E expression. In contrast, SAMe did not affect MAP kinase signaling when their activation was triggered by EGF. It is worth mentioning that bFGF receptor signaling is particularly important for hippocampal neurogenesis, while both bFGF and EGF receptors are physiologically important for SVZ neurogenesis (Bull and Bartlett, 2005). The differences observed with both growth factors may be explained considering that FGFR-initiated MAPK signaling cascade involves the participation of proteins that are not present in the EGFR-initiated MAPK signaling pathway, such as the FGFR substrate (FRS2), Spry2 or Dyrk1A among others and thus, our results suggest that SAMe is affecting the expression or activity of proteins that specifically participate in the bFGF-stimulated phosphorylation of Erk1/2.
GNMT catalyzes the transfer of a methyl group from SAMe to Gly, producing SAH and sarcosine as the respective end products (Cantoni, 1975; Kerr, 1972). To date, the physiological function proposed for this enzyme is to buffer intracellular SAMe levels by withdrawal of excessive SAMe. Thus, this enzyme is involved in the regulation of the ratio SAMe/SAH, which determines the cellular methylation potential (Clarke S, 2001). GNMT is mainly expressed in adult liver cells (1–3% of cytosolic protein content), as well as in adult pancreas, kidney, submaxilary glands, prostate and intestine (Yeo and Wagner, 1994). Here, we report the expression of small amounts of GNMT in mouse hippocampus (compared to liver expression) and a 2.5 fold smaller amount in the cortex compared to the hippocampus. Expression of GNMT mRNA and protein in adult hippocampus was about 600 and 500 fold lower, respectively, than that detected in liver. Still, GNMT is relatively abundant in the hippocampus of adult mice, compared to other brain regions like the cerebral cortex, where GNMT protein was, in our hands, just within the detection limits. We have not been able to determine which cell type within the hippocampus expresses the enzyme, since the antibody we used gave unspecific immunoreactivity. However, the low levels found suggest that only a specific subtype of nerve cells may express GNMT, in clear contrast with the liver, where all hepatocytes are well supplied with this enzyme. The results described here are in agreement with those reported by Tsai et al. (2010) in which they did not find GNMT protein in the cerebral cortex and with those of Yang et al. (2012) in which they find that GNMT mRNA expression in the hippocampus is 1.5 fold higher than in cortex and 700–1000 fold less than in liver.
We show that hippocampal GNMT expression seems to follow an age-related pattern. GNMT mRNA expression was extremely low in postnatal hippocampus, which suggests that GNMT is induced later on, upon full brain development. Peak GNMT expression was detected in young (2-month old) mice; compared to these, elder hippocampus (11-month old) presented lower levels of GNMT mRNA, suggesting that GNMT expression decreases with age. Since exogenous GNMT expression in CNS cultures has been reported to have a neuroprotective effect (Tsai et al., 2010), it is plausible to hypothesize that GNMT reduction due to ageing might contribute to neurodegeneration and the cognitive impairment inherent to aged brains.
The role of GNMT in the hippocampus was revealed after elucidating that in vivo GNMT deficiency led to spatial memory and learning impairment, in association with an inhibition of neurogenesis. GNMT deficiency in mice induces hypermethioninemia, yet our results demonstrate that these elevated levels of plasma methionine are not responsible for the observed effects, since no reduction of neurogenesis or spatial memory and learning performance was observed in a different mouse model of hypermethioninemia (Mat1a−/−). It may be possible that, in both Gnmt and Mat1a mutant mice, excessive plasma methionine is transported into hippocampal cells, increasing intracellular concentrations of SAMe, as it has been described for Gnmt−/− mouse liver cells (Martinez-Chantar et al., 2008); however, only mice lacking GNMT would presumably be unable to counteract SAMe accumulation within the cell. Indeed, the analysis of SAMe concentrations in hippocampal homogenates of Gnmt−/− mice is consistent with this hypothesis, with GNMT deficiency leading to increased levels of SAMe specifically within this brain region. In relation to this, Yang et al. (2012) have described that GNMT deficiency decreases sarcosine concentration and increases Gly concentration and they correlate these changes with alterations in neuropsychiatric behavioral patterns leading to schizophrenia. We have tested the effects of 1 mM Gly and sarcosine on NPC proliferation in vitro (data not shown) and have found that neither Gly or sarcosine exert any effect on NPC proliferation. Therefore, it is reasonable to hypothesize that elevated SAMe concentrations as a consequence of GNMT deficiency are responsible for the decrease in NPC proliferation. In contrast, no change was observed in SAH concentrations within the hippocampus. Yang et al. (2012) have described how the enzyme SAHH is upregulated in the hippocampus of Gnmt−/− mice. SAHH catalyzes a reversible reaction that favors the synthesis of SAH. Thus, an upregulation of SAHH could explain the unaltered SAH concentration in the hippocampus of our mouse model.
In relation to our results, a recent report demonstrates that SAMe supplementation improves spatial memory in a transgenic mouse model of Alzheimer’s disease (TgCRND8) in which HHcy and elevation of SAH brain levels were induced by a vitamin B12-deficient diet to further worsen cognitive performance. However, in this same report, SAMe supplementation did not improve spatial memory performance of wild-type animals but, on the contrary, it resulted in mildly reduced performance. These paradoxical results together with ours suggest that when SAH levels are high and the SAM/SAH ratio is low, SAMe supplementation compensates for the ratio decrease and improves memory performance; however, if SAM/SAH ratio is too high, memory performance results are also impaired, and this might be, at least in part, a consequence of the detrimental effects of excessive SAMe on neurogenesis.
In order to demonstrate whether SAMe exerts a direct antiproliferative effect on NPC, we used an in vitro approach. We chose cultures of NPC isolated from the SVZ of postnatal mice because of their self-renewal and proliferation capacity when cultured in the presence of growth factors like EGF or bFGF (Doetsch et al., 2002). These cultured NPC did not express GNMT, which is not surprising because even cells expressing high amounts of GNMT in vivo, like hepatocytes, lose this GNMT expression when grown in culture (Luka et al., 2009). We have shown that addition of SAMe to NPC cultures exerted an antiproliferative effect on these cells, though only when growth was stimulated with bFGF. Additionally, it is shown in here that the bFGF-stimulated MAP kinase signaling pathway was negatively regulated after addition of SAMe to the cultures, resulting in the inhibition of Erk1/2 phosphorylation and in the downregulation of bFGF-induced expression of cyclin E. We have previously demonstrated that elevated Hcy also exerts an antiproliferative effect on these same NPC through bFGF-cyclin E signaling inhibition (Rabaneda et al., 2008). One possible explanation is that both Hcy and SAMe act as direct inhibitors of bFGF signaling through different molecular mechanisms; alternatively and most likely, both conditions end up altering the intracellular SAMe/SAH ratio, which would be ultimately responsible for these effects. However, further work needs to be done in order to elucidate the mechanisms involved in these two inhibitory effects. The in vitro and in vivo findings are in agreement since the proliferation of neuroblasts within the DG is mainly controlled by bFGF stimulation (Bull and Bartlett, 2005). The mechanisms underlying the specific effect of SAMe on bFGF-stimulated Erk1/2 phosphorylation still remain unknown. A plausible explanation would be that elevated SAMe is facilitating the methylation and activation of the catalytic subunit of protein phosphatase 2A (PP2Ac), which has been reported to inhibit Erk1/2 phosphorylation (Silverstein et al., 2002; Zhou et al., 2002).
We have also observed changes in learning and memory of Gnmt−/− mice compared with their WT littermates Gnmt+/+. The observed effects indicated that Gnmt−/− mice had a reduced capacity to perform the MWM test at all time points tested. However, during the first three days of the acquisition phase of the trial the improvement in the time used by Gnmt−/− mice to find the platform was as as good as that of Gnmt+/+ mice. On the fourth day Gnmt+/+ mice kept improving but Gnmt−/− did not. In addition, the memory test was a reflection of this and showed a decreased capacity of Gnmt−/− mice to remember the signals leading to the platform. Regarding this effect of elevated SAMe on cognitive performance, changes in DNA methylation due to the lack of GNMT and elevated intracellular concentrations of SAMe might be contributing to the observed deficit in spatial memory performance. In this context, epigenetic mechanisms have been found to be involved in hippocampal neurogenesis and memory formation (for review see (Levenson and Sweatt, 2005); (Covic et al., 2010)) and DNA methylation has been reported to regulate synaptic plasticity and memory formation (for review see (Levenson and Sweatt, 2006)) in the adult hippocampus of rodents (Miller and Sweatt, 2007). An effect of GNMT deficiency on gene expression has been reported in liver cells, where loss of GNMT has been found to induce aberrant methylation of histones and DNA (Martinez-Chantar et al., 2008). Similarly, GNMT deficiency in hippocampal cells could exert a comparable effect disrupting DNA and protein methylation. Furthermore, the diminished capacity of Gnmt−/− NPC to proliferate and to differentiate into mature neurons within the DG could as well be a consequence of changes in the methylation pattern of specific proteins and/or gene promoters. In this sense, a mouse model has recently been reported in which electroconvulsive treatment results in i) increased hippocampal neurogenesis, at both the proliferation and differentiation levels; and ii) hypomethylation within the hippocampus of specific gene promoters including those for bFGF and BDNF, which triggers expression of these two important enhancers of hippocampal neurogenesis (Ma et al., 2009). Thus, Gnmt−/− mice could be the opposite model in which a high SAMe/SAH ratio results in hypermethylation of these or other important targets controlling neurogenesis. Inhibition of neurogenesis in mice has already been demonstrated to impair learning and memory (Shors et al., 2001; Shors et al., 2002; Zhao et al., 2007). Thus, it could be concluded that the decreased neurogenic capacity in Gnmt−/− mice is a crucial factor, although probably not the only one, contributing to cognitive impairment. An association between decreased neurogenesis and spatial memory impairment has been found in other animal models with altered methionine metabolism. Thus, moderate HHcy has been linked to cognitive impairment (Levine et al., 2002) and to a reduction in neurogenesis in mouse models (Rabaneda et al., 2008).
The results presented in this work suggest that GNMT may be a susceptibility gene for the development of disorders related to cognitive decline. Several GNMT mutations that inhibit GNMT activity have been found in human subjects (Augoustides-Savvopoulou et al., 2003; Luka et al., 2002; Mudd et al., 2001), yet the individuals carrying the mutations have no evidence so far of cognitive impairment or psychotic episodes. However, they are heterozygotes, and at the time the studies were performed, these patients were young and disorders related to memory deficit may arise when they grow older. In conclusion, the work presented here describes a role for SAMe in modulating neurogenesis within the adult brain, and reveals a key role for the enzyme GNMT in controlling hippocampal neurogenesis, memory and learning, suggesting that alterations in the concentrations of SAMe might contribute to the development of the cognitive aspects of some neurodegenerative disorders.
Acknowledgments
We thank Dr. Carmen Estrada for helpful discussions and Jose A. Torres for technical assistance. Use of SCCYT (Universidad de Cádiz) facilities is duly acknowledged.
Financial support: This work was supported by grants of the Spanish Ministerio de Ciencia e Innovación (SAF2008-03879), NIH grants DK51719 (SC Lu), R01AT1576 (SC Lu and JM Mato) and DK15289 (C Wagner). L.G.R and S.O-M are recipients of two fellowships of the Spanish Ministerio de Ciencia e Innovación (AP2006-3924 and AP2008-01189 respectively).
Footnotes
Disclosure statement: Authors claim no conflict of interest
References
- Augoustides-Savvopoulou P, Luka Z, Karyda S, Stabler SP, Allen RH, Patsiaoura K, Wagner C, Mudd SH. Glycine N-methyltransferase deficiency: a new patient with a novel mutation. J Inherit Metab Dis. 2003;26(8):745–59. doi: 10.1023/B:BOLI.0000009978.17777.33. [DOI] [PubMed] [Google Scholar]
- Bull ND, Bartlett PF. The adult mouse hippocampal progenitor is neurogenic but not a stem cell. J Neurosci. 2005;25(47):10815–21. doi: 10.1523/JNEUROSCI.3249-05.2005. [DOI] [PMC free article] [PubMed] [Google Scholar]
- Cai J, Mao Z, Hwang JJ, Lu SC. Differential expression of methionine adenosyltransferase genes influences the rate of growth of human hepatocellular carcinoma cells. Cancer Res. 1998;58(7):1444–50. [PubMed] [Google Scholar]
- Cameron HA, McKay RD. Adult neurogenesis produces a large pool of new granule cells in the dentate gyrus. J Comp Neurol. 2001;435(4):406–17. doi: 10.1002/cne.1040. [DOI] [PubMed] [Google Scholar]
- Cantoni GL. Biological methylation: selected aspects. Annu Rev Biochem. 1975;44:435–51. doi: 10.1146/annurev.bi.44.070175.002251. [DOI] [PubMed] [Google Scholar]
- Clarke SBK. In: S-adenosylmethionine dependent methyltransferase. DWCRaJ, editor. Cambridge, UK: Cambridge University Press; 2001. pp. 63–78. [Google Scholar]
- Coppede F. One-carbon metabolism and Alzheimer’s disease: focus on epigenetics. Curr Genomics. 2010;11(4):246–60. doi: 10.2174/138920210791233090. [DOI] [PMC free article] [PubMed] [Google Scholar]
- Covic M, Karaca E, Lie DC. Epigenetic regulation of neurogenesis in the adult hippocampus. Heredity (Edinb) 2010;105(1):122–34. doi: 10.1038/hdy.2010.27. [DOI] [PubMed] [Google Scholar]
- Doetsch F, Petreanu L, Caille I, Garcia-Verdugo JM, Alvarez-Buylla A. EGF converts transit-amplifying neurogenic precursors in the adult brain into multipotent stem cells. Neuron. 2002;36(6):1021–34. doi: 10.1016/s0896-6273(02)01133-9. [DOI] [PubMed] [Google Scholar]
- Feng J, Chang H, Li E, Fan G. Dynamic expression of de novo DNA methyltransferases Dnmt3a and Dnmt3b in the central nervous system. J Neurosci Res. 2005;79(6):734–46. doi: 10.1002/jnr.20404. [DOI] [PubMed] [Google Scholar]
- Finkelstein JD, Kyle WE, Harris BJ. Methionine metabolism in mammals: regulatory effects of S-adenosylhomocysteine. Arch Biochem Biophys. 1974;165(2):774–9. doi: 10.1016/0003-9861(74)90306-3. [DOI] [PubMed] [Google Scholar]
- Kerr SJ. Competing methyltransferase systems. J Biol Chem. 1972;247(13):4248–52. [PubMed] [Google Scholar]
- Levenson JM, Sweatt JD. Epigenetic mechanisms in memory formation. Nat Rev Neurosci. 2005;6(2):108–18. doi: 10.1038/nrn1604. [DOI] [PubMed] [Google Scholar]
- Levenson JM, Sweatt JD. Epigenetic mechanisms: a common theme in vertebrate and invertebrate memory formation. Cell Mol Life Sci. 2006;63(9):1009–16. doi: 10.1007/s00018-006-6026-6. [DOI] [PMC free article] [PubMed] [Google Scholar]
- Levine J, Stahl Z, Sela BA, Gavendo S, Ruderman V, Belmaker RH. Elevated homocysteine levels in young male patients with schizophrenia. Am J Psychiatry. 2002;159(10):1790–2. doi: 10.1176/appi.ajp.159.10.1790. [DOI] [PubMed] [Google Scholar]
- Lu SC, Alvarez L, Huang ZZ, Chen L, An W, Corrales FJ, Avila MA, Kanel G, Mato JM. Methionine adenosyltransferase 1A knockout mice are predisposed to liver injury and exhibit increased expression of genes involved in proliferation. Proc Natl Acad Sci U S A. 2001;98(10):5560–5. doi: 10.1073/pnas.091016398. [DOI] [PMC free article] [PubMed] [Google Scholar]
- Lu SC, Mato JM. S-adenosylmethionine in liver health, injury, and cancer. Physiol Rev. 2012;92(4):1515–42. doi: 10.1152/physrev.00047.2011. [DOI] [PMC free article] [PubMed] [Google Scholar]
- Luka Z, Capdevila A, Mato JM, Wagner C. A glycine N-methyltransferase knockout mouse model for humans with deficiency of this enzyme. Transgenic Res. 2006;15(3):393–7. doi: 10.1007/s11248-006-0008-1. [DOI] [PMC free article] [PubMed] [Google Scholar]
- Luka Z, Cerone R, Phillips JA, 3rd, Mudd HS, Wagner C. Mutations in human glycine N-methyltransferase give insights into its role in methionine metabolism. Hum Genet. 2002;110(1):68–74. doi: 10.1007/s00439-001-0648-4. [DOI] [PubMed] [Google Scholar]
- Luka Z, Mudd SH, Wagner C. Glycine N-methyltransferase and regulation of S-adenosylmethionine levels. J Biol Chem. 2009;284(34):22507–11. doi: 10.1074/jbc.R109.019273. [DOI] [PMC free article] [PubMed] [Google Scholar]
- Ma DK, Jang MH, Guo JU, Kitabatake Y, Chang ML, Pow-Anpongkul N, Flavell RA, Lu B, Ming GL, Song H. Neuronal activity-induced Gadd45b promotes epigenetic DNA demethylation and adult neurogenesis. Science. 2009;323(5917):1074–7. doi: 10.1126/science.1166859. [DOI] [PMC free article] [PubMed] [Google Scholar]
- Martinez-Chantar ML, Vazquez-Chantada M, Ariz U, Martinez N, Varela M, Luka Z, Capdevila A, Rodriguez J, Aransay AM, Matthiesen R, et al. Loss of the glycine N-methyltransferase gene leads to steatosis and hepatocellular carcinoma in mice. Hepatology. 2008;47(4):1191–9. doi: 10.1002/hep.22159. [DOI] [PMC free article] [PubMed] [Google Scholar]
- Martinez-Chantar ML, Vazquez-Chantada M, Garnacho M, Latasa MU, Varela-Rey M, Dotor J, Santamaria M, Martinez-Cruz LA, Parada LA, Lu SC, et al. S-adenosylmethionine regulates cytoplasmic HuR via AMP-activated kinase. Gastroenterology. 2006;131(1):223–32. doi: 10.1053/j.gastro.2006.04.019. [DOI] [PubMed] [Google Scholar]
- Mastroeni D, Grover A, Delvaux E, Whiteside C, Coleman PD, Rogers J. Epigenetic mechanisms in Alzheimer’s disease. Neurobiol Aging. 2011;32(7):1161–80. doi: 10.1016/j.neurobiolaging.2010.08.017. [DOI] [PMC free article] [PubMed] [Google Scholar]
- Miller CA, Sweatt JD. Covalent modification of DNA regulates memory formation. Neuron. 2007;53(6):857–69. doi: 10.1016/j.neuron.2007.02.022. [DOI] [PubMed] [Google Scholar]
- Miller JW. Homocysteine and Alzheimer’s disease. Nutr Rev. 1999;57(4):126–9. doi: 10.1111/j.1753-4887.1999.tb06936.x. [DOI] [PubMed] [Google Scholar]
- Miller JW. Homocysteine, folate deficiency, and Parkinson’s disease. Nutr Rev. 2002;60(12):410–3. doi: 10.1301/002966402320964089. [DOI] [PubMed] [Google Scholar]
- Miller JW, Green R, Ramos MI, Allen LH, Mungas DM, Jagust WJ, Haan MN. Homocysteine and cognitive function in the Sacramento Area Latino Study on Aging. Am J Clin Nutr. 2003;78(3):441–7. doi: 10.1093/ajcn/78.3.441. [DOI] [PubMed] [Google Scholar]
- Mudd SH, Cerone R, Schiaffino MC, Fantasia AR, Minniti G, Caruso U, Lorini R, Watkins D, Matiaszuk N, Rosenblatt DS, et al. Glycine N-methyltransferase deficiency: a novel inborn error causing persistent isolated hypermethioninaemia. J Inherit Metab Dis. 2001;24(4):448–64. doi: 10.1023/a:1010577512912. [DOI] [PubMed] [Google Scholar]
- Quadri P, Fragiacomo C, Pezzati R, Zanda E, Forloni G, Tettamanti M, Lucca U. Homocysteine, folate, and vitamin B-12 in mild cognitive impairment, Alzheimer disease, and vascular dementia. Am J Clin Nutr. 2004;80(1):114–22. doi: 10.1093/ajcn/80.1.114. [DOI] [PubMed] [Google Scholar]
- Rabaneda LG, Carrasco M, Lopez-Toledano MA, Murillo-Carretero M, Ruiz FA, Estrada C, Castro C. Homocysteine inhibits proliferation of neuronal precursors in the mouse adult brain by impairing the basic fibroblast growth factor signaling cascade and reducing extracellular regulated kinase 1/2-dependent cyclin E expression. Faseb J. 2008;22(11):3823–35. doi: 10.1096/fj.08-109306. [DOI] [PubMed] [Google Scholar]
- Romero-Grimaldi C, Gheusi G, Lledo PM, Estrada C. Chronic inhibition of nitric oxide synthesis enhances both subventricular zone neurogenesis and olfactory learning in adult mice. Eur J Neurosci. 2006;24(9):2461–70. doi: 10.1111/j.1460-9568.2006.05127.x. [DOI] [PubMed] [Google Scholar]
- Roth TL, Sweatt JD. Regulation of chromatin structure in memory formation. Curr Opin Neurobiol. 2009;19(3):336–42. doi: 10.1016/j.conb.2009.05.011. [DOI] [PMC free article] [PubMed] [Google Scholar]
- Seshadri S, Beiser A, Selhub J, Jacques PF, Rosenberg IH, D’Agostino RB, Wilson PW, Wolf PA. Plasma homocysteine as a risk factor for dementia and Alzheimer’s disease. N Engl J Med. 2002;346(7):476–83. doi: 10.1056/NEJMoa011613. [DOI] [PubMed] [Google Scholar]
- Shors TJ, Miesegaes G, Beylin A, Zhao M, Rydel T, Gould E. Neurogenesis in the adult is involved in the formation of trace memories. Nature. 2001;410(6826):372–6. doi: 10.1038/35066584. [DOI] [PubMed] [Google Scholar]
- Shors TJ, Townsend DA, Zhao M, Kozorovitskiy Y, Gould E. Neurogenesis may relate to some but not all types of hippocampal-dependent learning. Hippocampus. 2002;12(5):578–84. doi: 10.1002/hipo.10103. [DOI] [PMC free article] [PubMed] [Google Scholar]
- Sierra A, Encinas JM, Deudero JJ, Chancey JH, Enikolopov G, Overstreet-Wadiche LS, Tsirka SE, Maletic-Savatic M. Microglia shape adult hippocampal neurogenesis through apoptosis-coupled phagocytosis. Cell Stem Cell. 2010;7(4):483–95. doi: 10.1016/j.stem.2010.08.014. [DOI] [PMC free article] [PubMed] [Google Scholar]
- Silverstein AM, Barrow CA, Davis AJ, Mumby MC. Actions of PP2A on the MAP kinase pathway and apoptosis are mediated by distinct regulatory subunits. Proc Natl Acad Sci U S A. 2002;99(7):4221–6. doi: 10.1073/pnas.072071699. [DOI] [PMC free article] [PubMed] [Google Scholar]
- Snyder JS, Hong NS, McDonald RJ, Wojtowicz JM. A role for adult neurogenesis in spatial long-term memory. Neuroscience. 2005;130(4):843–52. doi: 10.1016/j.neuroscience.2004.10.009. [DOI] [PubMed] [Google Scholar]
- Struys EA, Jansen EE, de Meer K, Jakobs C. Determination of S-adenosylmethionine and S-adenosylhomocysteine in plasma and cerebrospinal fluid by stable-isotope dilution tandem mass spectrometry. Clin Chem. 2000;46(10):1650–6. [PubMed] [Google Scholar]
- Torroglosa A, Murillo-Carretero M, Romero-Grimaldi C, Matarredona ER, Campos-Caro A, Estrada C. Nitric oxide decreases subventricular zone stem cell proliferation by inhibition of epidermal growth factor receptor and phosphoinositide-3-kinase/Akt pathway. Stem Cells. 2007;25(1):88–97. doi: 10.1634/stemcells.2006-0131. [DOI] [PubMed] [Google Scholar]
- Tropepe V. Kinship and descent: redefining the stem cell compartment in the adult hippocampus. Cell Stem Cell. 2007;1(5):481–3. doi: 10.1016/j.stem.2007.10.014. [DOI] [PubMed] [Google Scholar]
- Tsai MJ, Chen YM, Weng CF, Liou DY, Yang HC, Chen CH, Liao RI, Kuo FS, Chiu CW, Kuo HS, et al. Enhanced expression of glycine N-methyltransferase by adenovirus-mediated gene transfer in CNS culture is neuroprotective. Ann N Y Acad Sci. 2010;1199:194–203. doi: 10.1111/j.1749-6632.2009.05169.x. [DOI] [PubMed] [Google Scholar]
- Winocur G, Wojtowicz JM, Sekeres M, Snyder JS, Wang S. Inhibition of neurogenesis interferes with hippocampus-dependent memory function. Hippocampus. 2006;16(3):296–304. doi: 10.1002/hipo.20163. [DOI] [PubMed] [Google Scholar]
- Yang CP, Wang HA, Tsai TH, Fan A, Hsu CL, Chen CJ, Hong CJ, Chen YM. Characterization of the neuropsychological phenotype of glycine N-methyltransferase−/− mice and evaluation of its responses to clozapine and sarcosine treatments. Eur Neuropsychopharmacol. 2012;22(8):596–606. doi: 10.1016/j.euroneuro.2011.12.007. [DOI] [PubMed] [Google Scholar]
- Yeo EJ, Wagner C. Tissue distribution of glycine N-methyltransferase, a major folate-binding protein of liver. Proc Natl Acad Sci U S A. 1994;91(1):210–4. doi: 10.1073/pnas.91.1.210. [DOI] [PMC free article] [PubMed] [Google Scholar]
- Zhao M, Li D, Shimazu K, Zhou YX, Lu B, Deng CX. Fibroblast Growth Factor Receptor-1 Is Required for Long-Term Potentiation, Memory Consolidation, and Neurogenesis. Biol Psychiatry. 2007 doi: 10.1016/j.biopsych.2006.10.019. [DOI] [PubMed] [Google Scholar]
- Zhao X, Ueba T, Christie BR, Barkho B, McConnell MJ, Nakashima K, Lein ES, Eadie BD, Willhoite AR, Muotri AR, et al. Mice lacking methyl-CpG binding protein 1 have deficits in adult neurogenesis and hippocampal function. Proc Natl Acad Sci U S A. 2003;100(11):6777–82. doi: 10.1073/pnas.1131928100. [DOI] [PMC free article] [PubMed] [Google Scholar]
- Zhou B, Wang ZX, Zhao Y, Brautigan DL, Zhang ZY. The specificity of extracellular signal-regulated kinase 2 dephosphorylation by protein phosphatases. J Biol Chem. 2002;277(35):31818–25. doi: 10.1074/jbc.M203969200. [DOI] [PubMed] [Google Scholar]