Abstract
Background
Insulin resistance is a link between obesity and the associated disease risk. In addition to its role as an energy regulatory signal to the hypothalamus, insulin also modulates food reward.
Objective
To examine the relationship of insulin sensitivity (SI) and fasting insulin with cerebral activation in response to food and non-food cues in children.
Methods
Twelve overweight Hispanic girls (age: 8–11) participated in two study visits, a frequently sampled intravenous glucose tolerance test and a functional neuroimaging (fMRI) session (GE HDxt 3.0Tesla)) with visual stimulation tasks. Blocks of images (high calorie (HC), low calorie (LC) and non-food (NF)) were presented in randomized order.
Results
Comparing HC with NF, SI was inversely associated with activation in the anterior cingulate (r2 = 0.65; p < 0.05), the insula (r2 = 0.69; p < 0.05), the orbitofrontal cortex (r2 = 0.74; p < 0.05), and the frontal and rolandic operculum (r2 = 0.76; p < 0.001). Associations remained significant after adjustment for BMI. Association of fasting insulin and cerebral activation dissapeared after adjustment for waist circumference.
Conclusion
In addition to weight loss insulin sensitivity may pose an important target to regulate neural responses to food cues in the prevention of excessive weight gain.
Keywords: insulin sensitivity, brain reward, childhood obesity, functional imaging
Introduction
The alarming prevalence of childhood obesity is not only a significant health problem in the pediatric population, but poses a risk factor for adult morbidity and mortality as well (1). One of the most common complications associated with obesity is type 2 diabetes caused in part by the effects of adiposity on insulin resistance (2). Insulin resistance is thought to be a link between obesity and the associated increased disease risk (3). While body adiposity and insulin resistance are strongly associated in the adult population, the pediatric population of overweight and obese children still present with a wide variety of insulin sensitivity (4).
Converging evidence shows that insulin as well as sensitivity to insulin is of major importance for homeostatic, but also for the hedonic, mesolimbic regulation of hunger and satiety (5). In addition to being an energy regulatory signal to the hypothalamus, insulin acts within the central nervous system (CNS) to decrease food reward possibly through a direct alteration of dopaminergic signaling (6). Insulin was shown to modulate activity of ventral tegmental area (VTA) dopaminergic neurons (7, 8).
While CNS insulin production cannot be ruled out, converging evidence suggests that the majority of insulin enters the brain through active transport from the periphery (9). It is therefore not surprising that manipulations of peripheral insulin concentrations were reflected in CNS insulin alterations (10). One hypothesis referred to as the ‘Central Resistance Model’ is that genetic or acquired resistance to adiposity-regulating hormones occurs quite commonly and undermines the ability of those hormones to biologically protect against the development of obesity (11).
In human research, the existence of brain insulin resistance along with peripheral insulin resistance was suggested after the observation of a reduction in insulin induced changes in the global cerebral metabolic rate for glucose in insulin resistant research participants compared to insulin sensitive participants (12). Since insulin resistance is so closely intertwined with body fat, it has been difficult to tease apart the individual contribution of either one to alterations in brain reward activity. More detailed study designs comparing lean and obese individuals found specific associations of either body mass index (BMI) or insulin sensitivity with activity in food related resting state networks (13). Results show that, especially for reward related processing, insulin sensitivity might be of particular importance.
Considering the range of insulin sensitivity despite obesity, children appear to be well suited for a more specific investigation of the individual contribution of insulin sensitivity and body adiposity to altered food related brain processing, specifically highly palatable foods.
Central insulin resistance may contribute to altered food related reward perception even in the pediatric population (14). An uninhibited, overactive reward circuit would then lead to overeating, setting children up for a chronic weight issue in the future. Purpose of the current study was to assess the importance of insulin sensitivity for brain reward activation in response to visual food cues in a pediatric population. It was hypothesized that lower insulin sensitivity in the periphery is associated with stronger activation of brain reward areas in response to high calorie food images compared to control images. The association was furthermore expected to be independent of body fat mass.
Methods
Participants
Twelve Hispanic, overweight girls were recruited through flyers and presentations at schools and boys and girls clubs in the greater Los Angeles area. Inclusion criteria for participants were female gender, Hispanic ethnicity, defined by all four grandparents being of Hispanic descent, Tanner stage 1 or 2, a body mass index above the 85th percentile for age and gender (15) and right handedness. Participants were excluded from the study if they had diabetes, any major illness since birth, had a condition known to affect insulin sensitivity or had a neurological illness. Written informed consent was obtained from parents and youth assent from participants. The study was approved by the USC IRB committee.
Procedures
Participants came to the laboratory twice. The first visit included anthropometric measurements followed by an overnight stay in the USC Clinical trials unit, followed by a frequently sampled intravenous glucose tolerance test (FSIVGTT). The second visit included functional imaging. Visits were scheduled one week apart. All imaging sessions took place at 3pm with the participants being instructed to not eat anything after 12 noon.
Anthropometric measures
A pediatric health care provider conducted a medical history and physical examination and determined maturation using the criteria of Tanner (16). Height was measured to the nearest 0.1cm by a wall-mounted stadiometer and weight was recorded to the nearest 0.1kg by a balance beam medical scale. BMI and BMI percentiles for age and gender were determined based upon established CDC normative curves using EpiInfo 2000, Version 1.1 (17).
Body Composition
Body composition (total body fat and total lean mass) for all participants was determined with dual-energy x-ray absorptiometry (DXA) using a Hologic Discovery A model (82702, Hologic, Bedford, MA).
Measures of Insulin Sensitivity
FSIVGTT
All girls participated in a FSIVGTT, assessing insulin sensitivity (SI). After a 10 h fasting period two fasting blood samples (−15 and −5 minutes) were followed by a 0.3g/kg body weight intravenous (iv) glucose administration at timepoint 0. At 20 minutes, insulin (0.02 U/kg body weight, Humulin R; Eli Lilly, Indianapolis, IN) was administered iv. Blood samples were taken at 2, 4, 8, 19, 22, 30, 40, 50, 70, 100 and 180 minutes. SI was calculated with MINMOD MILLENIUM 2003 (18). Blood samples from the FSIVGTT were centrifuged for 10 minutes at 2500rpm and plasma aliquots were frozen at −80 C until further analysis.
Fasting insulin
In addition to the FSIVGTT the relationship of fasting insulin with cerebral activation was assessed. Measurements of insulin sensitivity that are based on fasting insulin and glucose concentrations have been suggested to reflect hepatic insulin sensitivity rather than skeletal muscle glucose uptake and are therefore also considered in the current paper (19, 20).
Analysis of blood parameters
Blood for glucose analysis was collected in fluoride tubes and blood for insulin analysis was collected in lithium heparin tubes. Plasma was assayed in duplicate for glucose using the glucose oxidase method and a Yellow Springs Instrument 2700 analyzer (YSI Inc., Yellow Springs, OH). Insulin was assayed in duplicate using an ELISA kit from Linco (St. Charles, MO).
Food picture exposure paradigm
A block design consisting of two visual activation blocks and control blocks was presented in randomized order. All images were chosen based on previous studies (21) or through the International Affective Picture System (22). Activation task blocks consisted of 10 pictures of either high calorie (i.e. pizza, cheeseburger) or low calorie food items (i.e. broccoli, carrots). Before, between and after activation task blocks, control blocks of 10 non-food items were presented in randomized order (i.e. book, bus, bicycle). Control items were selected based on similarity in object complexity, color, texture and shape variety. All visual stimuli were presented for 2.5 seconds with a 0.5 second inter-stimulus interval. Pictures were projected from a Macintosh computer onto a screen placed near the foot of the scanner, where they were viewed through a mirror mounted on the head coil. Participants were instructed to view the series of pictures with the intention to recall them after the scanning procedure.
Imaging and statistical analysis
MRI acquisition was conducted on a 3.0 Tesla scanner (GE HDxt) equipped with an eight-channel head coil. A functional echo-planar T2*(BOLD)-weighted sequence (TR: 3000 ms, TE: 25 ms, flip angle: 90°, FOV: 192 mm, matrix: 64 × 64, voxel size: 3.4375 × 3.4375 × 5 mm) was used to acquire 50 volumes during the visual stimulus presentation. A T1-weighted anatomical volume (TR: 500 ms, TE: 9.88 ms, flip angle: 90°, FOV: 192 mm, matrix: 256 × 256, voxel size: 0.8594 × 0.8594 × 5 mm) was also acquired at the same slice locations as the functional sequence to allow for functional-anatomical co-registration.
Visual stimuli were presented by PsychToolbox for Matlab (23). The functional images were corrected for motion in SPM8 (Wellcome Trust Centre for Neuroimaging, London, UK) smoothed and co-registered to the standard Montreal Neurological Institute (MNI) template for comparison. Through the co-registration process images were sliced into 2 × 2 × 2 mm isotropic voxel space using sinc interpolation. A statistical parametric map was generated for each subject using the general linear model (GLM) with the stimulus as the primary parameter of the model. To eliminate activation due to movement, 6 movement parameters were also included in the model. A box-car waveform was used as the reference paradigm.
For the statistical analysis, one participant was excluded due to the inability to finish the IVGTT. Another participant was excluded due to too much head motion during the scanning process, leaving a total of 10 participants for the final analysis. Contrast images of each subject were used for group statistics calculated as random effects analysis at the second level, which takes variances between subjects into account. Spatial Parametric Maps produced by either high or low calorie activation tasks versus the non-food control condition were computed. In a next step we performed a 2nd level analysis by comparing maps produced by high and low calorie activation tasks. Regions of interest were established based on the relevant literature (24, 25) and a cluster threshold of 10 voxels. Contrast maps were set at a standard threshold of p<0.05, corrected for multiple comparisons.
Variables were tested for normality and log transformed if necessary. Separate regression analyses was utilized to assess the association between cerebral activation, fasting insulin, and SI. Regression data was analyzed using SPSS (SPSS Inc. IL, USA). A p-value of <0.05 was considered significant.
Results
Mean values (±SD) of anthropometric measures and range are described in Table 1. Three of the participating girls were in Tanner stage 1 and seven were in Tanner stage 2. All girls were of Hispanic descent (as defined by all four grandparents identifying as Hispanic) and overweight (body mass index above the 85th percentile for age and gender). Mean fasting glucose concentrations were 5.07± 0.5 mmol/l (ranging from 4.38 – 6.07 mmol/l). Three participants had impaired fasting glucose (IFG) according to the standards of the American Diabetes Association and therefore qualified as pre-diabetic (26). Fasting insulin concentrations were on average 26.69 ± 19.6 µU/ml (ranging from 3.52 – 50.90 µU/ml).
Table 1. Anthropometric measures.
Anthropometric measures describing mean ± standard error of the means (SE) and range (n = 10).
| Mean ± SE | Range | |
|---|---|---|
| Age (years) | 9.9 ± 1.1 | 8–11 |
| Weight (kg) | 59.3 ± 13.4 | 38.7 – 74.8 |
| Height (cm) | 144.06 ± 7.11 | 129.3 – 152.1 |
| BMI (kg/m2) | 29.9 ± 5.7 | 23.3 – 36.8 |
| Waist (cm) | 87.7 ± 11.93 | 71 – 103 |
| Hip (cm) | 90.8 ± 8.1 | 82 – 101 |
| Fat mass (kg) | 24.21 ± 8.2 | 13.8 –34.5 |
| Lean mass (kg) | 33.2 ± 5.8 | 22.8 – 41.11 |
BMI was related to waist (r = 0.88; p < 0.05), percent body fat (r = 0.69; p < 0.05) and SI (r = −0.66; p < 0.05). BMI was not related to fasting insulin concentrations. Fasting insulin concentrations were related to waist circumference (r = 0.74; p < 0.05), but not to percent body fat, BMI or SI. SI was related to BMI, but not to waist circumference, percent body fat or fasting insulin concentrations.
Brain responses comparing high calorie with low calorie and non-food visual cues
Significant differences in BOLD activation in response to high calorie foods and non-food pictures (Table 2) were observed in the caudate (p < 0.05), orbitofrontal cortex (p < 0.05), the insula (p < 0.05), the frontal and rolandic operculum (p < 0.05), and the anterior cingulate (p < 0.05). Differences were mostly observed in the left hemisphere, except for difference in insula activation, which were observed bilaterally.
Table 2. Increases in regional brain activity in response to high calorie pictures vs. control pictures.
Comparison of regional brain activation in response to high calorie food > non-food stimuli in 10 overweight Hispanic girls.
| Reference coordinates | ||||||||
|---|---|---|---|---|---|---|---|---|
| x | y | z | kb | Hemisphere | Max z | Effect size | P | |
| Caudate | −20 | 22 | 16 | 10 | L | 3.27 | 1.00 | <0.05 |
| Orbitofrontal cortex | −48 | 24 | −4 | 34 | L | 3.45 | 1.09 | <0.05 |
| Insula | 38 | −32 | 6 | 82 | R | 3.15 | 0.99 | <0.05 |
| Insula | −46 | 4 | −6 | 37 | L | 3.02 | 0.95 | <0.05 |
| Rolandic operculum | −56 | 10 | 4 | 17 | L | 3.18 | 1 | <0.05 |
| Anterior Cingulate | −4 | 42 | 4 | 36 | L | 2.92 | 0.92 | <0.05 |
Brain responses to visual stimulation and SI
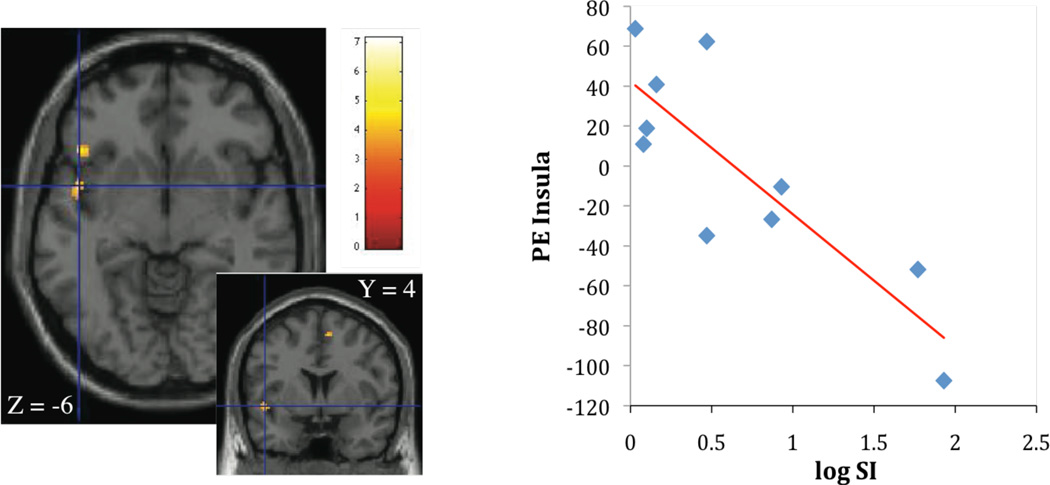
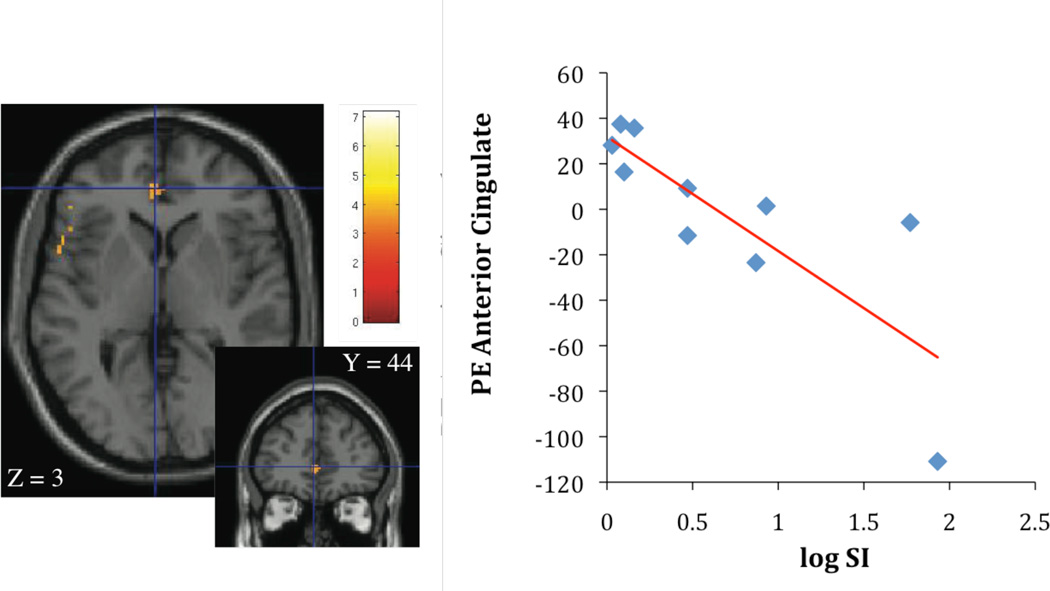
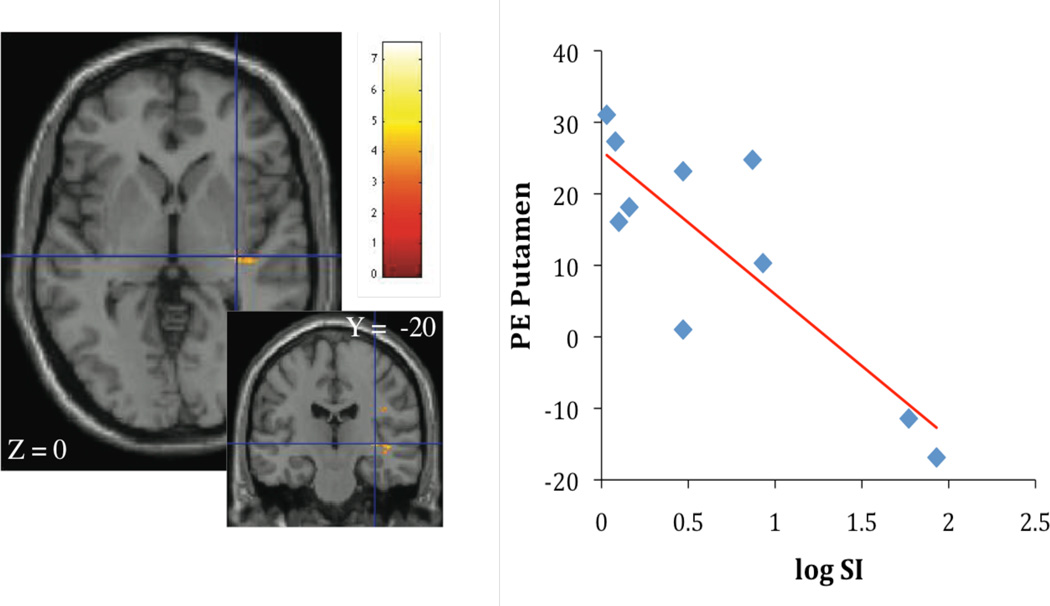
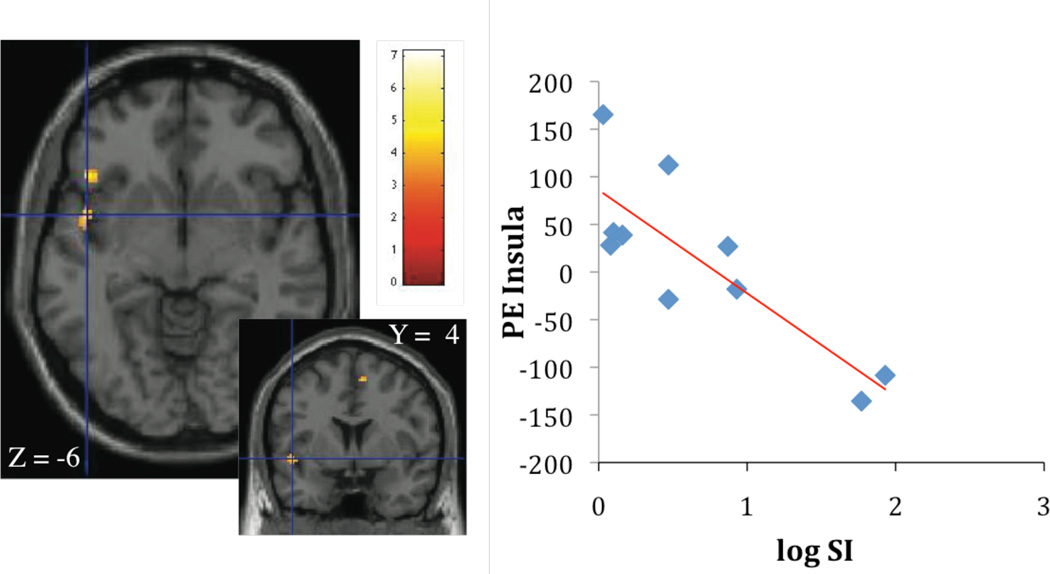
Contrasting high calorie images with non-food images, SI was inversely associated with activation in insula (r2 = 0.69; p < 0.05, Figure 1A), orbitofrontal cortex (r2 = 0.74; p < 0.05), anterior cingulate (r2 = 0.65; p < 0.05, Figure 1B), frontal, and rolandic operculum (r2 = 0.76; p < 0.05). SI was also negatively correlated with activation in putamen (r2 = 0.74; p < 0.05, Figure 2A) and insula (r2 = 0.66; p < 0.05, Figure 2B). Given the association of BMI with SI, BMI was considered as a covariate in the regression analysis in the next step. When BMI was considered in the regression, the relationship of SI stayed significantly associated with insula activation (r2 = 0.76; p < 0.05), orbitofrontal cortex (r2 = 0.89; p < 0.05), frontal, and rolandic operculum (r2 = 0.79; p < 0.05). The association between SI and activation in the anterior cingulate and putamen dissapeared.
Figure 1.
A, B Association of insulin sensitivity (SI), insula activation (parameter estimates, PE) (Figure 1A: r2 = 0.69; p < 0.005) and left anterior cingulate activation (Figure 1B: r2 = 0.65; p < 0.005), contrasting cerebral activation in response to high calorie visual stimuli > non-food visual stimuli.
Figure 2.
A, B Association of insulin sensitivity (SI), putamen activation (parameter estimates, PE) (Figure 2A: r2 = 0.74; p < 0.005) and insula activation (Figure 2B: r2 = 0.66; p < 0.005), contrasting cerebral activation in response to high calorie visual stimuli > low calorie visual stimuli.
Contrasting high calorie food images with low calorie food images, significant differences in BOLD signal were observed for the putamen and the insula. More specifically, SI was negatively correlated with activation in putamen (r2 = 0.74; p < 0.005, Figure 2A) and insula (r2 = 0.66; p < 0.005, Figure 2B).
Brain responses and fasting insulin
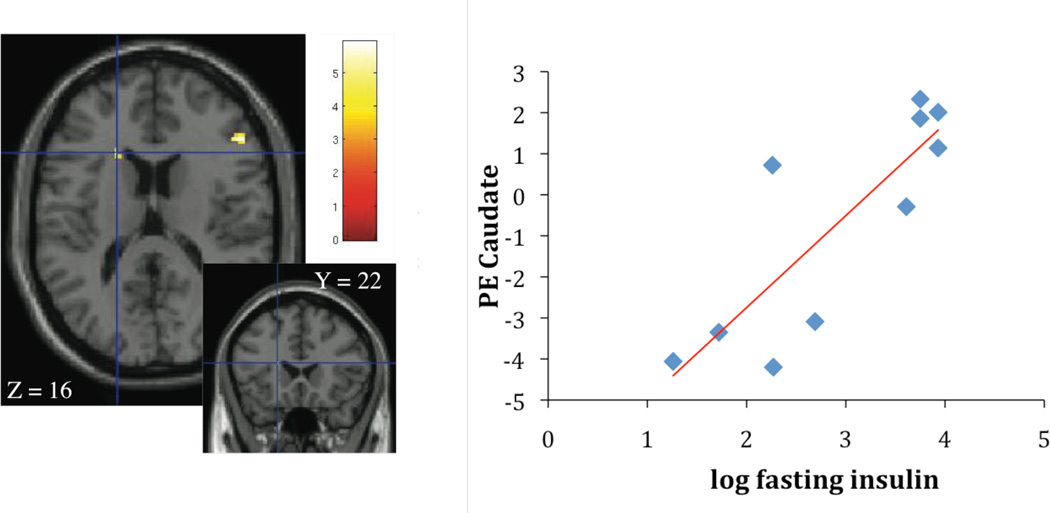
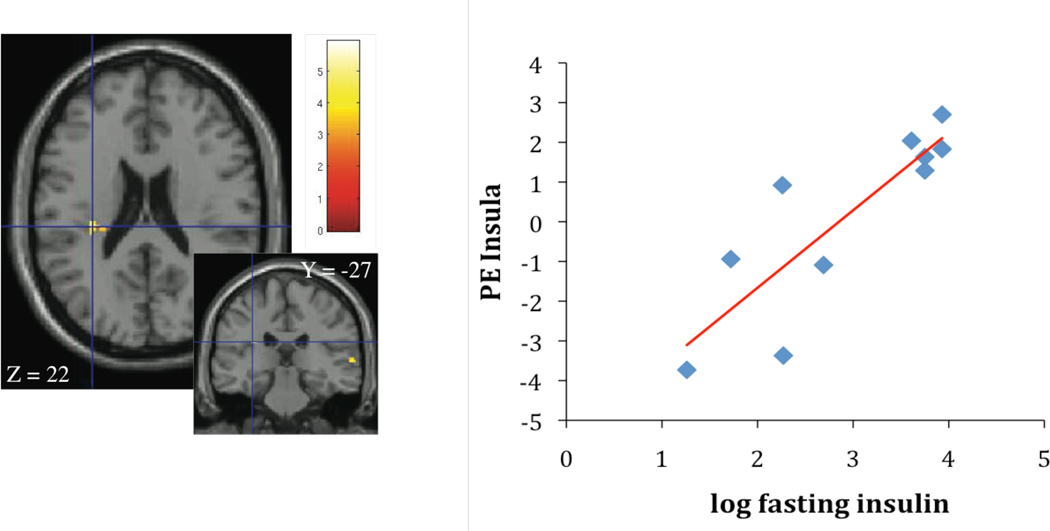
Contrasting high calorie food images with non-food control images, fasting insulin concentrations were associated with activation in the caudate ((r2 = 0.70; p < 0.005; Figure 3A) and the insula (r2 = 0.69; p < 0.005; Figure 3B). Given the association of fasting insulin with waist circumference, waist was considered as a covariate in the regression analysis in the next step. When waist was considered, the association of fasting insulin with caudate and insula activation disappeared.
Figure 3.
A, B Association of fasting insulin concentrations, caudate activation (parameter estimates, PE) (Figure 3A: r2 = 0.70; p < 0.005) and insula activation (Figure 3B: r2 = 0.69; p < 0.005), contrasting cerebral activation in response to high calorie visual stimuli > non-food visual stimuli.
Fasting insulin was not associated with brain reward activation contrasting high and low calorie food images.
Discussion
Results of the current study show that -even in children- peripheral insulin sensitivity appears to be associated with the cerebral response to food vs. non-food cues. Stronger cerebral activation was associated with lower insulin sensitivity and higher fasting insulin concentrations, particularly in brain areas associated with motivation and reward. Insulin sensitivity was also inversely associated with activation of gustatory (frontal operculum) and somatosensory (rolandic operculum) regions encoding food taste and texture. Our results lend support to the idea of a co-occurrence of peripheral and central insulin resistance, which was previously suggested by other authors (12).
In rodent studies environmental set ups to test food reward demonstrated the ability of insulin to significantly decrease lever presses for a sweet solution (5). That ability however was abolished after a few weeks of high fat feeding. Strikingly, the high fat fed animals did not gain weight different from the chow-fed control rats, excluding weight as the responsible variable for the results. In human research participants glucose metabolism was shown to be significantly decreased in insulin resistant individuals, particularly in areas of the brain reward system (12). Both, animal and human studies suggest the presence of central insulin resistance, possibly in concert with peripheral insulin resistance.
It has been traditionally difficult to tease apart whether associations between obesity and brain reward activity are primarily due to obesity, or are secondary, a result of the insulin resistance accompanying obesity. Insulin sensitivity is strongly related to body weight and insulin resistance is often thought of as the linking factor between obesity and disease risk (27). There are a few recent studies that support the idea of insulin sensitivity affecting the brain reward response to food cues, rather than obesity alone (13, 28). Children present with a wide range of insulin sensitivity despite obesity, spared still from the long-term impact of excess body fat on tissues and receptors. Therefore, a pediatric group of research participants seems to be ideal to investigate the respective importance of insulin sensitivity, obesity or both, for brain reward signaling. Instead of either or, our results may support the importance of both, insulin and obesity for cerebral activity, possibly independently different for specific networks, as has been shown in a study investigating resting state network activity in obese individuals (13). A striking observation in the study population is that SI and fasting insulin are completely unrelated. It was hypothesized that fasting measures of insulin sensitivity are more reflective of hepatic insulin sensitivity, while SI, as a glucose stimulated measure, is more reflective of peripheral insulin sensitivity (20). This assumption is supported by the fact that fasting insulin was only related to waist circumference, but not to overall body adiposity. After adjustment for waist circumference the relationship between fasting insulin and cerebral activation disappeared, suggesting that overall insulin sensitivity may be more relevant for cerebral activity. However, this result may also be due to the fact that Hispanic children have a higher risk for insulin resistance even independent of body adiposity (29). Traditionally, insulin resistance has been approached as a consequence of obesity.
Functional imaging in children is often criticized for the difficulties of children to not move in the process. We had to exclude one participant due to too much head movement. Other studies support that large scale fMRI studies are feasible in children as young as five years (30). Therefore, we believe that the advantage of young age participants investigating the cause and effect of health issues weighs out practical issues of the study execution.
Research studies in adults show that abnormal neural responses to food cues persist in participants after weight loss and that successful dieters are characterized by a strong prefrontal activation in response to food cues (31–33). The prefrontal cortex is involved in self-control and behavioral monitoring, emotion regulation and salience attribution. In children, the implementation of inhibitory choices regarding food intake is in part dependent on the morphological and physiological development of the brain during childhood and adolescence (34) and a progressively greater focal activation in the prefrontal cortex during adolescent development has been observed regarding tasks that require inhibition of behavioral responses (35). Results suggest that chronic activation of the brain reward system may develop before the prefrontal cortex is mature enough to inhibit detrimental behaviors such as overeating, establishing neurological patterns that predispose children for overweight and lifelong weight struggle. Given the current study design it is warranted to point out several limitations and refrain from overstated conclusions. The current results have to be seen in the light of a small number of female participants of one particular ethnicity in Tanner stage 1 and 2. The number of participants allows only for preliminary conclusions. Further studies, including a control group are warranted to draw more solid conclusions regarding the relationship between insulin sensitivity and brain reward activation in children.
In conclusion the results suggest insulin sensitivity as a target in addition to weight loss to regulate neural responses to food cues to prevent excessive weight gain through overeating and obesity.
What is already known about this subject?
Obesity is associated with alterations in brain reward activity in response to food cues in adults
What this study adds
Obesity is associated with alterations in brain reward activity in response to food cues in children
Peripheral insulin sensitivity is associated with alterations in brain reward activity independent of obesity
Peripheral insulin sensitivity may co-occur with central insulin resistance even in children
Acknowledgements
Funding/Financial Support: This study was supported in part by the National Cancer Institute (U54 CA 116848), Obesity in Minority Youth in Los Angeles: A Generation "At Risk" (5P60MD002254), and in part by a Pfizer Fellowship in Health Disparities awarded to Tanja C. Adam
Additional Contributions: The authors are much obliged to the support and work of Prof. Manbir Singh with this study, as well as the nursing staff at the GCRC. Finally, the authors are grateful to the study participants and their families for their involvement.
Footnotes
Disclosures: The authors have no conflict to disclose.
References
- 1.Must A, Strauss RS. Risks and consequences of childhood and adolescent obesity. Int J Obes Relat Metab Disord. 1999;23(Suppl 2):S2–S11. doi: 10.1038/sj.ijo.0800852. [DOI] [PubMed] [Google Scholar]
- 2.Boyko EJ, Fujimoto WY, Leonetti DL, Newell-Morris L. Visceral adiposity and risk of type 2 diabetes: a prospective study among Japanese Americans. Diabetes Care. 2000;23:465–471. doi: 10.2337/diacare.23.4.465. [DOI] [PubMed] [Google Scholar]
- 3.Lee JM. Insulin resistance in children and adolescents. Rev Endocr Metab Disord. 2006;7:141–147. doi: 10.1007/s11154-006-9019-8. [DOI] [PubMed] [Google Scholar]
- 4.Goran MI, Lane C, Toledo-Corral C, Weigensberg MJ. Persistence of Pre-Diabetes in Overweight and Obese Hispanic Children: Association With Progressive Insulin Resistance, Poor Beta-cell Function and Increasing Visceral Fat. Diabetes. 2008 doi: 10.2337/db08-0445. [DOI] [PMC free article] [PubMed] [Google Scholar]
- 5.Figlewicz DP, Bennett JL, Naleid AM, Davis C, Grimm JW. Intraventricular insulin and leptin decrease sucrose self-administration in rats. Physiol Behav. 2006;89:611–616. doi: 10.1016/j.physbeh.2006.07.023. [DOI] [PubMed] [Google Scholar]
- 6.Figlewicz DP, Evans SB, Murphy J, Hoen M, Baskin DG. Expression of receptors for insulin and leptin in the ventral tegmental area/substantia nigra (VTA/SN) of the rat. Brain Res. 2003;964:107–115. doi: 10.1016/s0006-8993(02)04087-8. [DOI] [PubMed] [Google Scholar]
- 7.Konner AC, Hess S, Tovar S, et al. Role for insulin signaling in catecholaminergic neurons in control of energy homeostasis. Cell Metab. 2011;13:720–728. doi: 10.1016/j.cmet.2011.03.021. [DOI] [PubMed] [Google Scholar]
- 8.Mebel DM, Wong JC, Dong YJ, Borgland SL. Insulin in the ventral tegmental area reduces hedonic feeding and suppresses dopamine concentration via increased reuptake. Eur J Neurosci. 2012;36:2336–2346. doi: 10.1111/j.1460-9568.2012.08168.x. [DOI] [PMC free article] [PubMed] [Google Scholar]
- 9.Banks WA. The source of cerebral insulin. Eur J Pharmacol. 2004;490:5–12. doi: 10.1016/j.ejphar.2004.02.040. [DOI] [PubMed] [Google Scholar]
- 10.Schwartz MW, Sipols A, Kahnet SE, et al. Kinetics and specificity of insulin uptake from plasma into cerebrospinal fluid. Am J Physiol. 1990;259:E378–E383. doi: 10.1152/ajpendo.1990.259.3.E378. [DOI] [PubMed] [Google Scholar]
- 11.Schwartz MW, Niswender KD. Adiposity signaling and biological defense against weight gain: absence of protection or central hormone resistance? J Clin Endocrinol Metab. 2004;89:5889–5897. doi: 10.1210/jc.2004-0906. [DOI] [PubMed] [Google Scholar]
- 12.Anthony K, Reed LJ, Dunn JT, et al. Attenuation of insulin-evoked responses in brain networks controlling appetite and reward in insulin resistance: the cerebral basis for impaired control of food intake in metabolic syndrome? Diabetes. 2006;55:2986–2992. doi: 10.2337/db06-0376. [DOI] [PubMed] [Google Scholar]
- 13.Kullmann S, Heni M, Veit R, et al. The obese brain: association of body mass index and insulin sensitivity with resting state network functional connectivity. Hum Brain Mapp. 2012;33:1052–1061. doi: 10.1002/hbm.21268. [DOI] [PMC free article] [PubMed] [Google Scholar]
- 14.Adam TC, Toledo-Corral C, Lane CJ, et al. Insulin sensitivity as an independent predictor of fat mass gain in Hispanic adolescents. Diabetes Care. 2009;32:2114–2115. doi: 10.2337/dc09-0833. [DOI] [PMC free article] [PubMed] [Google Scholar]
- 15.Kuczmarski RJ, Ogden CL, Grummer-Strawn LM, et al. CDC growth charts: United States. Adv Data. 2000:1–27. [PubMed] [Google Scholar]
- 16.Tanner JM. Growth and maturation during adolescence. Nutr Rev. 1981;39:43–55. doi: 10.1111/j.1753-4887.1981.tb06734.x. [DOI] [PubMed] [Google Scholar]
- 17.Flegal KM, Ogden CL, Carroll MD. Prevalence and trends in overweight in Mexican-american adults and children. Nutr Rev. 2004;62:S144–S148. doi: 10.1111/j.1753-4887.2004.tb00085.x. [DOI] [PubMed] [Google Scholar]
- 18.Bergman RN, Phillips LS, Cobelli C. Physiologic evaluation of factors controlling glucose tolerance in man: measurement of insulin sensitivity and beta-cell glucose sensitivity from the response to intravenous glucose. J Clin Invest. 1981;68:1456–1467. doi: 10.1172/JCI110398. [DOI] [PMC free article] [PubMed] [Google Scholar]
- 19.Adam TC, Hasson RE, Lane CJ, et al. Fasting indicators of insulin sensitivity: effects of ethnicity and pubertal status. Diabetes Care. 2011;34:994–999. doi: 10.2337/dc10-1593. [DOI] [PMC free article] [PubMed] [Google Scholar]
- 20.Tripathy D, Almgren P, Tuomi T, Groop L. Contribution of insulin-stimulated glucose uptake and basal hepatic insulin sensitivity to surrogate measures of insulin sensitivity. Diabetes Care. 2004;27:2204–2210. doi: 10.2337/diacare.27.9.2204. [DOI] [PubMed] [Google Scholar]
- 21.Page KA, Seo D, Belfort-DeAguiar R, et al. Circulating glucose levels modulate neural control of desire for high-calorie foods in humans. J Clin Invest. 2011;121:4161–4169. doi: 10.1172/JCI57873. [DOI] [PMC free article] [PubMed] [Google Scholar]
- 22.Lang PJ. The emotion probe. Studies of motivation and attention. Am Psychol. 1995;50:372–385. doi: 10.1037//0003-066x.50.5.372. [DOI] [PubMed] [Google Scholar]
- 23.Brainard DH. The Psychophysics Toolbox. Spat Vis. 1997;10:433–436. [PubMed] [Google Scholar]
- 24.Bruce AS, Holsen LM, Chambers RJ, et al. Obese children show hyperactivation to food pictures in brain networks linked to motivation, reward and cognitive control. Int J Obes (Lond) 2010;34:1494–1500. doi: 10.1038/ijo.2010.84. [DOI] [PMC free article] [PubMed] [Google Scholar]
- 25.Rothemund Y, Preuschhof C, Bohner G, et al. Differential activation of the dorsal striatum by high-calorie visual food stimuli in obese individuals. Neuroimage. 2007;37:410–421. doi: 10.1016/j.neuroimage.2007.05.008. [DOI] [PubMed] [Google Scholar]
- 26.Type 2 diabetes in children and adolescents. American Diabetes Association. Pediatrics. 2000;105:671–680. doi: 10.1542/peds.105.3.671. [DOI] [PubMed] [Google Scholar]
- 27.Cruz ML, Shaibi GQ, Weigensberg MJ, Spruijt-Metz D, Ball GD, Goran MI. Pediatric obesity and insulin resistance: chronic disease risk and implications for treatment and prevention beyond body weight modification. Annu Rev Nutr. 2005;25:435–468. doi: 10.1146/annurev.nutr.25.050304.092625. [DOI] [PubMed] [Google Scholar]
- 28.Jastreboff AM, Sinha R, Lacadie C, Small DM, Sherwin RS, Potenza MN. Neural Correlates of Stress- and Food Cue-Induced Food Craving in Obesity: Association with insulin levels. Diabetes Care. 2013;36:394–402. doi: 10.2337/dc12-1112. [DOI] [PMC free article] [PubMed] [Google Scholar]
- 29.Goran MI, Bergman RN, Cruz ML, Watanabe R. Insulin resistance and associated compensatory responses in african-american and Hispanic children. Diabetes Care. 2002;25:2184–2190. doi: 10.2337/diacare.25.12.2184. [DOI] [PubMed] [Google Scholar]
- 30.Byars AW, Holland SK, Strawsburg RH, et al. Practical aspects of conducting large-scale functional magnetic resonance imaging studies in children. J Child Neurol. 2002;17:885–890. doi: 10.1177/08830738020170122201. [DOI] [PMC free article] [PubMed] [Google Scholar]
- 31.Bruce JM, Hancock L, Bruce A, et al. Changes in brain activation to food pictures after adjustable gastric banding. Surg Obes Relat Dis. 2011 doi: 10.1016/j.soard.2011.07.006. [DOI] [PubMed] [Google Scholar]
- 32.DelParigi A, Chen K, Salbe AD, et al. Persistence of abnormal neural responses to a meal in postobese individuals. Int J Obes Relat Metab Disord. 2004;28:370–377. doi: 10.1038/sj.ijo.0802558. [DOI] [PubMed] [Google Scholar]
- 33.DelParigi A, Chen K, Salbe AD, et al. Successful dieters have increased neural activity in cortical areas involved in the control of behavior. Int J Obes (Lond) 2007;31:440–448. doi: 10.1038/sj.ijo.0803431. [DOI] [PubMed] [Google Scholar]
- 34.Gomez-Perez E, Ostrosky-Solis F, Prospero-Garcia O. [The development of attention, memory and the inhibitory processes: the chronological relation with the maturation of brain structure and functioning] Rev Neurol. 2003;37:561–567. [PubMed] [Google Scholar]
- 35.Tamm L, Menon V, Reiss AL. Maturation of brain function associated with response inhibition. J Am Acad Child Adolesc Psychiatry. 2002;41:1231–1238. doi: 10.1097/00004583-200210000-00013. [DOI] [PubMed] [Google Scholar]


