Abstract
miR-96 is a microRNA, a non-coding RNA gene which regulates a wide array of downstream genes. The miR-96 mouse mutant diminuendo exhibits deafness and arrested hair cell functional and morphological differentiation. We have previously shown that several genes are markedly downregulated in the diminuendo organ of Corti; one of these is Ptprq, a gene known to be important for maturation and maintenance of hair cells. In order to study the contribution that downregulation of Ptprq makes to the diminuendo phenotype, we carried out microarrays, scanning electron microscopy and single hair cell electrophysiology to compare diminuendo mutants (heterozygous and homozygous) with mice homozygous for a functional null allele of Ptprq. In terms of both morphology and electrophysiology, the auditory phenotype of mice lacking Ptprq resembles that of diminuendo heterozygotes, while diminuendo homozygotes are more severely affected. A comparison of transcriptomes indicates there is a broad similarity between diminuendo homozygotes and Ptprq-null mice. The reduction in Ptprq observed in diminuendo mice appears to be a major contributor to the morphological, transcriptional and electrophysiological phenotype, but does not account for the complete diminuendo phenotype.
Keywords: ear development, hereditary hearing loss, knockout and transgenic m, molecular genetics, sensory hair cells
Introduction
The diminuendo mutant mouse exhibits deafness and arrested development of the cochlear sensory hair cells. Inner and outer hair cells (IHCs and OHCs) in homozygotes appear immature at young stages and later degenerate; by postnatal day (P)28, very few OHCs are visible. Heterozygotes display poor hearing at P15 followed by rapid deterioration until they lack any response to sound. Their hair cells also appear immature, but are still present at P28 (Lewis et al., 2009; Kuhn et al., 2011). In humans, two MIR96 mutations have been found to be associated with dominantly-inherited progressive hearing loss (Mencia et al., 2009).
The diminuendo causative mutation is a single nucleotide change in the seed region of the microRNA miR-96, which disrupts its function by both loss of its proper targets and gain of novel ones (Lewis et al., 2009). miR-96 is a regulator controlling a wide array of genes, as seen in the microarrays comparing wildtypes and homozygotes (Lewis et al., 2009). However, a few genes were markedly downregulated in diminuendo homozygotes, including Ptprq, which is downregulated to ∼ 50% of the wildtype level (Lewis et al., 2009).
Ptprq is a phosphatidylinositol phosphatase, which in the mouse is expressed specifically in the hair bundles of cochlear and vestibular hair cells at early postnatal stages, although expression in the OHCs is transient. In mature hair cells, the staining is restricted to the base of the hair bundle (Goodyear et al., 2003). Three isoforms have been identified in chick hair cells, one expressed at immature stages and two in mature hair cells (Nayak et al., 2011). Ptprq localisation at the base of the stereocilia is actively maintained by Myo6, and is thought to be important for hair bundle maturation and maintenance (Goodyear et al., 2003; Sakaguchi et al., 2008). Mice homozygous for a catalytically inactive form of Ptprq (Ptprq-CAT-KO), which has a shortened intracellular domain but a wildtype C-terminus, do not respond to sound. It is likely to be a functional null; no Ptprq protein is detectable in the hair cells of homozygous Ptprq–CAT-KO mice (Goodyear et al., 2003). At early postnatal stages hair cells are present but the hair bundles are disorganised, and smaller and rounder in shape. At 3 months old hair cells are absent from the basal turn of the organ of Corti. The shaft connectors of vestibular hair cells are absent from Ptprq-CAT-KO homozygotes, as are vestibular evoked potentials (Goodyear et al., 2012).
miR-96 is a master regulator, controlling multiple genes and coordinating maturation of the hair cells (Kuhn et al., 2011), and its absence would be expected to affect a wide range of genes, although the pathways it regulates are not yet known. Understanding how much the downregulation of Ptprq contributes to the diminuendo phenotype is important for understanding the overall action of miR-96. We therefore undertook a detailed morphological examination of the hair cells, electrophysiology and transcriptome of diminuendo homozygotes and heterozygotes, Ptprq-CAT-KO homozygotes and controls, to ascertain what contribution the downregulation of Ptprq makes to the diminuendo phenotype.
Materials and methods
Mice
Mouse studies were carried out in accordance with UK Home Office regulations and the UK Animals (Scientific Procedures) Act of 1986 (ASPA) under a UK Home Office licence, and the study was approved by the Wellcome Trust Sanger Institute's Ethical Review Committee. Mice were culled using methods approved under this licence to minimize any possibility of suffering.
Two genetically modified mouse lines were used; the diminuendo line and the Ptprq-CAT-KO line. The diminuendo phenotype is the result of an N-ethyl-N-nitrosourea (ENU) mutagenesis screen (Lewis et al., 2009); the line was generated and has been maintained on a C3HeB/FeJ background. The Ptprq-CAT-KO allele is a targeted knock-out in which a 1061 bp fragment of Ptprq, which contains two of the exons coding for the catalytic domain, is replaced by a neomycin resistance cassette. 129/Sv stem cells were used, and the mouse line was established and has been maintained on a mixed C57BL/6J/129/Sv background (Goodyear et al., 2003). Fifty-eight animals were used in this study in total.
Scanning electron microscopy
Scanning electron microscopy was carried out on diminuendo homozygote, heterozygote and wildtype and Ptprq-CAT-KO homozygote and wildtype mouse inner ears at P4 (four mice of each genotype, of either sex) as described in Chen et al. (2013), using the OTOTO method (Hunter-Duvar, 1978). Images were taken using an Hitachi SE-4800 microscope at 5 kV under a standard magnification (× 80) to show the whole organ of Corti and a higher magnification (× 15 k) for IHCs and the outermost row of OHCs at 10% intervals along the length of the cochlear duct from 10 to 90% of the distance from the base to apex (Fig. 1). No obvious differences of the size of the organ of Corti were observed during dissection of the different genotypes, and all mice examined had the normal number of cochlear turns. Cartoons of hair cells typical of each point along the organ of Corti and genotype were drawn based on the micrographs, to summarise their appearance from a similar angle.
Fig. 1.
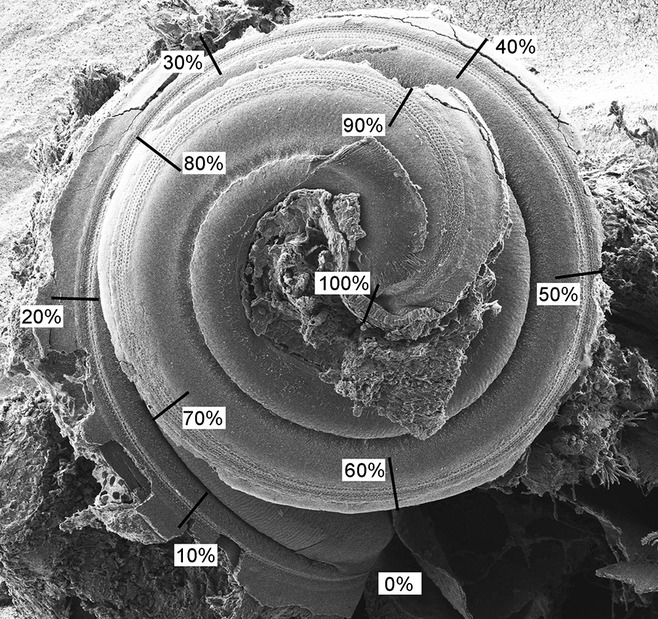
Method of measuring the length of the cochlear duct to make comparisons in corresponding positions. In order to compare hair cell bundles in corresponding positions along cochlear ducts between wildtype and mutant mice or between different mutant mice, the images were taken under a standard magnification (× 80) to show the whole organ of Corti. The cochlear duct was divided into ten parts of 10% from base to apex. A higher magnification (× 15 k) was used for analysis of IHCs and the outermost row of OHCs at every 10% interval along the length of the cochlear duct. Scale bar, 300 μm.
Microarray
Organ of Corti dissection and RNA extraction were carried out as described in Lewis et al. (2009), using male Ptprq-CAT-KO homozygous (n = 6) and wildtype (n = 6) P4 littermates collected within a 2-h time window to control for circadian changes. Total RNA (500 ng) for each sample was amplified and purified using the Illumina TotalPrep-96 RNA Amplification kit (Ambion, UK), according to the manufacturer's instructions. Biotin-labelled cRNA was then normalized to a concentration of 150 ng/uL and 1500 ng was hybridised to Illumina MouseWG-6 v2 beadarrays (Illumina, CA, USA) for 16 h (overnight) at 58 °C. Following hybridisation, beadarrays were washed and stained with streptavidin-cy3 (GE Healthcare, UK). Beadarrays were then scanned using the Beadarray reader and image data was then processed using Genome Studio software (Illumina). The data were normalised using a quantile normalisation, making the assumption that the overall intensity distributions of the arrays should be comparable (Bolstad, 2001; Bolstad et al., 2003). Normalised data was then analysed using the Bioconductor LUMI and LIMMA packages (Gentleman et al., 2004; Smyth, 2004; Smyth et al., 2005). The P-value was adjusted for multiple tests as described in Benjamini & Hochberg (1995), and the P-value cut-off was set to 0.05. Probe data from wildtype mice was compared to probe data from homozygote mutant mice; the only difference between each pair of littermates was the genotype. Microarray data are available in the ArrayExpress database (http://www.ebi.ac.uk/arrayexpress) under accession number E-MTAB-1785. Further analysis was carried out using the R statistical software package (Team, 2012) and the GSEA (Gene Set Enrichment Analysis) software (Mootha et al., 2003; Subramanian et al., 2005) on ranked microarray gene lists, using gene pathway sets downloaded from mSigDB (http://www.broadinstitute.org/gsea/msigdb/index.jsp, August 2013), Reactome (http://www.reactome.org/, July 2013) and Pathway Commons (http://www.pathwaycommons.org, July 2013). GSEA does not accept duplicate gene IDs, so if duplicates were present in the input gene list the highest absolute value was used.
cDNA creation and RTPCR
Each pair of RNA samples (homozygote and wildtype Ptprq-CAT-KO P4 littermates of either sex; fourteen mice used in total) were normalised to the same concentration before treatment with DNAse 1 (Sigma; cat.no. AMP-D1). cDNA was created using the Superscript II Reverse Transcriptase kit (Invitrogen; cat. no. 11904-018). Primer/probe sets and the Taqman Master Mix were purchased from Applied Biosystems (Master Mix: 4364340; Hprt1: Mm01318747_g1; Jag1: Mm01270190_m1; Calb2: Mm00801461_m1; Grxcr1: Mm01217856_m1; Hsd17b7: Mm00501703_m1. Primer/probe sets for Chrna1, Chrna9 and Otof were manually designed using a tool supplied by Applied Biosystems). Hprt1 was used as the internal control, and Jag1, which is expressed in supporting cells (Morrison et al., 1999; Zine et al., 2000; Lewis et al., 2009), was used to control for sensory tissue content. Pairs were only used if their Jag1 expression levels did not differ significantly (where significance was determined to be P < 0.05). Quantitative PCR was run on an ABI7000 machine (Applied Biosystems). Four technical replicates were carried out per sample, and three wildtype–homozygote pairs were tested for each probe. The  test was used to determine relative expression levels for each probe (Livak & Schmittgen, 2001); the calibrator was the wildtype littermate threshold for the same probe and the internal control was Hprt. Student's t-test was used for results which were both parametric and homoscedastic, Welch's t-test for parametric, heteroscedastic data, the Wilcoxon test for non-parametric, homoscedastic data and the Brunner-Munzel test for results which were neither parametric nor homoscedastic. All significance tests were non-directional, and a significance level of α < 0.05 was used. The F-test and Fligner–Killeen test were used to estimate homoscedasticity, and the Shapiro–Wilks test for normality. The Bonferroni test was used to adjust P-values to take multiple testing into account. Excel (Microsoft, Seattle, USA) and R (Team, 2012) were used to carry out the calculations and statistical tests.
Single hair cell electrophysiology
Outer hair cells from the apical coil of diminuendo homozygote, heterozygote and wildtype mice of either sex were studied in acutely dissected organs of Corti from P1 to P6, where the day of birth is P0. Twenty-four mice were used in total. Animals were killed by cervical dislocation in accordance with UK Home Office regulations. Cochleae were dissected as previously described (Johnson et al., 2012) in normal extracellular solution (in mm): NaCl, 135; KCl, 5.8; CaCl2, 1.3; MgCl2, 0.9; NaH2PO4, 0.7; d-glucose, 5.6; and Hepes–NaOH, 10. Sodium pyruvate (2 mm), MEM amino acids solution (50 ×, without l-glutamine) and MEM vitamins solution (100 ×) were added from concentrates (Fisher Scientific, UK). The pH was adjusted to 7.5 (osmolality ∼ 308 mmol/kg). All animals were genotyped as previously described (Lewis et al., 2009).
Voltage recordings were performed at room temperature (22–24 °C) using an Optopatch (Cairn Research Ltd, UK) amplifier. Patch pipettes were coated with surf wax (Mr Zogs SexWax, USA) to minimise the fast capacitance transient of the patch pipette. The intracellular solution of the patch pipette (2–3 MΩ) contained (in mm): Cs-glutamate, 106; CsCl, 20; MgCl2, 3; EGTA–CsOH, 1; Na2ATP, 5; Na2GTP, 0.3; Hepes–CsOH, 5; and sodium phosphocreatine, 10 (pH 7.3). Data acquisition was controlled by pClamp software using Digidata 1440A boards (Molecular Devices, USA). Recordings were low-pass filtered at 2.5 or 5.0 kHz (8-pole Bessel), sampled at 5 or 10 kHz and stored on computer for off-line analysis (Origin – OriginLab, USA). Membrane potentials were corrected for the residual series resistance and liquid junction potential (−11 mV).
Mechanoelectrical transducer (MET) currents were elicited by stimulating the hair bundles of OHCs using a fluid jet from a pipette (tip diameter 8–10 μm) driven by a piezoelectric disc (Johnson et al., 2011, 2012). The pipette tip of the fluid jet was positioned near to the bundles to elicit a maximal transducer current. Mechanical stimuli were applied as force-steps or 50-Hz sinusoids (filtered at 0.25 kHz, 8-pole Bessel) with driving voltages of ± 40 V. MET currents were recorded with a patch pipette solution containing 1 mm EGTA as the calcium buffer, which was previously assessed using perforated patch recordings (Johnson et al., 2008). The effect of endolymphatic Ca2+ concentration [reported to be between 0.02 and 0.04 mm Ca2+ – Bosher & Warren, 1978; Salt et al., 1989)] was examined by superfusing the hair bundle with 0.04 mm Ca2+ (buffered with 4 mm HEDTA) using a multi-barrelled pipette positioned closed to the patched cells. During the experiments in which different extracellular Ca2+ concentrations were used (0.04 mm or 1.3 mm), the fluid jet pipette was also filled with the same solution.
Statistical comparisons of means were made by one-way anova followed by the Tukey multiple comparison test with alpha = 0.05. Mean values are quoted ± SEM.
Results
Hair bundle structure – OHCs
In the wildtype mice at P4, there was a gradient in maturity of OHCs from cochlear apex towards base with apical hair cell bundles showing a slightly more immature, rounded arrangement, a few short microvilli remaining within the cleft of the bundles, and narrower angles between the two arms of the V-shaped array. Basal OHCs showed a wide-angled array of stereocilia, three rows of graded height organised in straight lines with few if any excess microvilli remaining in the cleft of the V-shaped array (Figs 2A and B and 3).
Fig. 2.
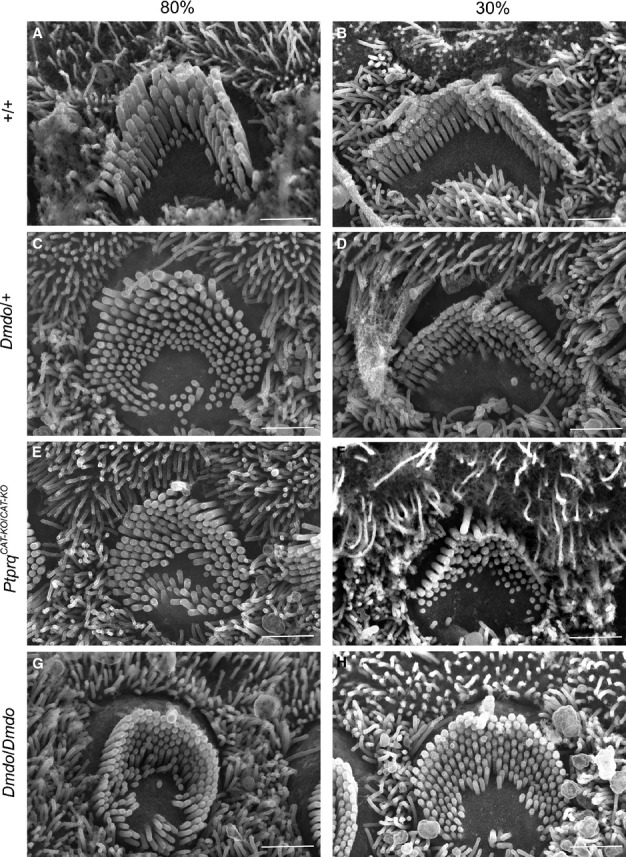
Outer hair cell stereocilia morphology at position 80% (near apex; A, C, E and G) and 30% (near base; B, D, F and H) of the length along the cochlear duct (P4) by scanning electron microscopy showed developmentally immature morphology of hair bundles in the mutants. (G and H) Diminuendo homozygotes showed the most affected hair bundles, with a rounded, almost circular shape and extra stereocilia rows. (C and D) Diminuendo heterozygotes resemble (E and F) Ptprq-CAT-KO homozygotes, being less affected but still showing differences compared to (A and B) wildtypes, such as the gently rounded hair bundle and excess microvilli. Scale bar, 1.5 μm.
Fig. 3.
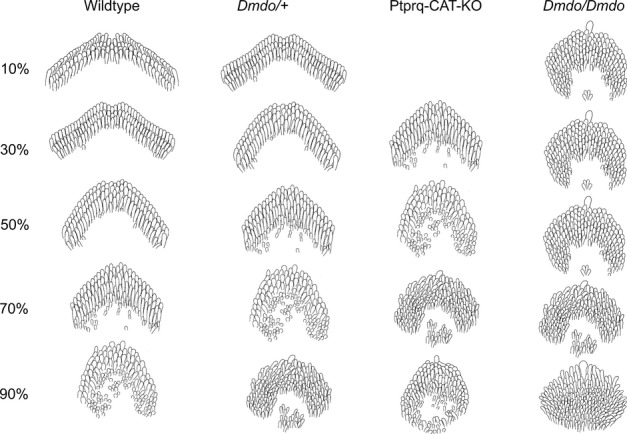
Cartoons of P4 OHCs typical of wildtype, diminuendo heterozygote, Ptprq-CAT-KO homozygote and diminuendo homozygote mice. The wildtype hair cells (left) display the typical gradient of development of outer hair cells at P4, with the most mature hair cells at the base (10%) and the most immature at the apex (90%). This gradient is still present in diminuendo heterozygote mice (centre left), but appears delayed; at each stage depicted, the hair cells resemble the next most apical stage of the wildtype. A similar difference can be observed between Ptprq-CAT-KO homozygote OHCs (centre right) and diminuendo heterozygote OHCs, with Ptprq-CAT-KO OHCs at 30% resembling diminuendo heterozygote OHCs at 50%, which resemble wildtype OHCs at 70%, for example. No Ptprq-CAT-KO OHCs were preserved for observation at 10%. Diminuendo homozygotes (right) display a much more extreme phenotype, with hair cell development appearing to stall at ∼ 50%, and hair cells more apical than that appearing very immature.
All the OHCs in diminuendo homozygous mice looked immature compared with wildtype OHCs at the corresponding positions. Mutant OHCs from the base up to the 80% position showed a similar appearance, without an obvious developmental gradient (Fig. 3). In contrast, above the 80% position a developmental gradient was observed, suggesting that the development of mutant OHCs may have stalled at a set point in differentiation. The hair bundles of mutant OHCs showed a more rounded shape than those of wildtype mice and where there was evidence of a V-shaped array, the angle was narrower than that of wildtype mice. These mutant OHCs had six to eight rows of stereocilia in contrast to three rows in wildtype mice, and displayed retention of microvilli in the cleft of the bundle, with some clearly ectopic stereocilia making some bundles look more like an O-shape than a V-shape (Fig. 2H; compare to Fig. 2B).
Heterozygote (Dmdo/+) OHCs showed an intermediate phenotype in all notable respects. For example, they did show a developmental gradient from apex towards base, where the hair bundles had a V shape and wider angle between two arms than diminuendo homozygous mutants, but even at the base they were narrower than wildtype bundles. There were a few ectopic stereocilia at 80%, similar to diminuendo homozygous mutants, but not at 30%, where they more closely resembled wildtypes (Figs 2C and D and 3).
The Ptprq-CAT-KO homozygous OHCs showed abnormal hair bundles at P4, and we found that they appeared to share more similarities with diminuendo heterozygous OHCs than with diminuendo homozygous OHCs. First, both diminuendo heterozygote and Ptprq-CAT-KO homozygote OHCs displayed a developmental gradient from apex towards base, which seemed to be stalled in diminuendo homozygotes (Fig. 3). Second, the gross morphology of OHC bundles in diminuendo heterozygous and Ptprq-CAT-KO homozygous mice was not as rounded as diminuendo homozygous mutants (Fig. 2C–F; compare to Fig. 2G and H; see also Fig. 3). Third, there were still extra rows of stereocilia/microvilli in diminuendo heterozygotes and Ptprq-CAT-KO homozygotes, but they appeared to be fewer than in diminuendo homozygotes (Fig. 2D and F; compare to Fig. 2H). Typical OHC bundles for each genotype are summarised and drawn based on micrographs for a more direct comparison as shown in Fig. 3. The kinocilium was present in all genotypes including wildtype along the length of the cochlear duct, so was not useful as a measure of differentiation.
Hair bundle structure – IHCs
Most wildtype IHCs had a well-defined wide V-shape, although at the 90% position near the apex, the bundles were more rounded than further towards the base of the cochlear duct (Fig. 4A and B). IHC stereocilia had grown thicker, with the second tallest row having the thickest shafts and forming wedge-shaped (tented) apical ends, followed by the tallest row, and the innermost stereocilia were the thinnest as reported previously (Erven et al., 2002; Holme et al., 2002). Persistent microvilli were observed within the cleft of the bundle along the length of the organ of Corti. The stereocilia from the same row were almost the same height as each other, so hair bundles had a clear staircase arrangement (Figs 4A,B and 5).
Fig. 4.
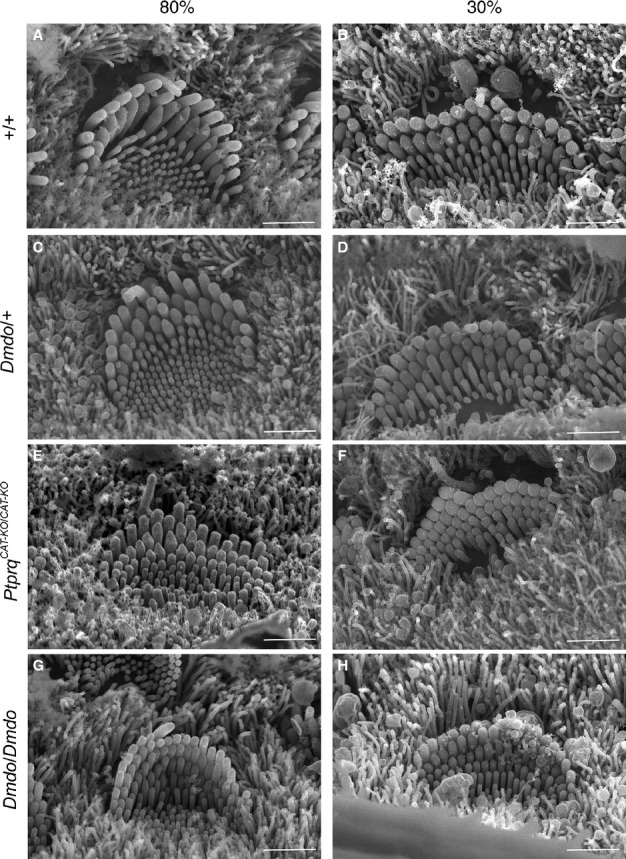
Inner hair cell stereocilia morphology at position 80% (near apex; A, C, E and G) and 30% (near base; B, D, F and H) along the length of the cochlear duct (P4) by scanning electron microscopy showed developmentally immature morphology of hair bundles in the mutants. (G and H) Diminuendo homozygote hair bundles show very little thickening of stereocilia rows. Like the outer hair cells, (C and D) diminuendo heterozygotes and (E and F) Ptprq-CAT-KO homozygotes show a less extreme phenotype but are still distinct from (A and B) the wildtype hair bundles, with an abundance of microvilli. Scale bar, 1.5 μm.
Fig. 5.
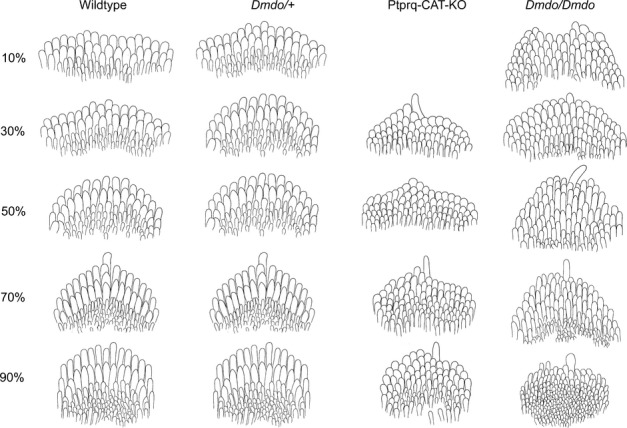
Cartoons of P4 IHCs typical of wildtype, diminuendo heterozygote, Ptprq-CAT-KO homozygote and diminuendo homozygote mice. Wildtype IHCs (left) show a gradient of maturity from the base (most mature, 10%) to the apex (least mature, 90%). Diminuendo heterozygotes (centre left) display a very similar gradient, with a slight delay in development visible from 10 to 30%. Ptprq-CAT-KO homozygote IHCs (centre right) are more affected, although stereocilia are organised into rows, and the taller stereocilia show some thickening as in wildtype and diminuendo heterozygote IHCs. No Ptprq-CAT-KO IHCs were preserved for observation at 10%. Diminuendo homozygote IHCs (right) are much more affected than the others, with extra rows of stereocilia and not much thickening of the taller stereocilia, but they still appear to have a gradient of maturity between 10 and 90%.
IHCs of diminuendo homozygous mutants differed from those of wildtype mice mainly by not showing thickening of their stereocilia, such that there was little distinction between stereocilia rows save the height. There was also less distinction between stereocilia and microvilli than in IHCs of wildtype mice (Fig. 4G and H). A minority of homozygote inner hair cells in the basal half had hair bundles consisting of bunched stereocilia with no height gradation. No microvilli were observed in these hair cells (Fig. 6).
Fig. 6.

Two distinct stereocilia bundle phenotypes were observed in diminuendo homozygote inner hair cells. (A) A wildtype hair cell at 40%, showing the development of the ‘staircase’ of stereocilia heights. Microvilli are still present. (B) This is the more common diminuendo homozygote phenotype. The diminuendo homozygote hair cell resembles the wildtype but appears less mature, with still-thin stereocilia and more microvilli. (C) In contrast, a minority of homozygote inner hair cells lacked the staircase organisation and microvilli entirely. We observed no hair bundles intermediate between these two phenotypes. Scale bars, 300 μm.
Diminuendo heterozygote IHCs showed an intermediate appearance but generally were much more similar to wildtype IHCs than to diminuendo homozygote IHCs (Fig. 4C and D). Heterozygote IHCs showed some thickening of stereocilia, unlike the homozygote IHCs. However, there was a slight developmental delay observed towards the base of the cochlea (Fig. 5).
The Ptprq-CAT-KO homozygous IHCs displayed a phenotype intermediate between diminuendo homozygotes and wildtypes. For example, both diminuendo heterozygote and Ptprq-CAT-KO homozygote IHCs bore extra rows of stereocilia/microvilli, but not as many as diminuendo homozygote IHCs (Fig. 4D and F; compare to Fig. 4H). Thickening of IHC stereocilia was seen in Ptprq-CAT-KO homozygous and diminuendo heterozygous mice and the arrangement of the stereocilia in the same row was neater than that of the diminuendo homozygous mice (Fig. 4C and E; compare to Fig. 4G). However, we also observed some Ptprq-CAT-KO inner hair cells resembling the diminuendo homozygote hair cells with bunched stereocilia (as shown in Fig. 6C). Typical inner hair cell bundles for each genotype are summarised and drawn based on micrographs for a more direct comparison in Fig. 5. As with OHCs, the kinocilium was observed in all genotypes and at all positions in the cochlea.
Summary of hair cell appearance
In summary, we observed developmentally immature morphology in diminuendo heterozygous, homozygous and Ptprq-CAT-KO homozygous mice. When comparing the development of OHC hair bundles in terms of gross morphology, number of stereocilia rows and form and arrangement of stereocilia, diminuendo heterozygous and Ptprq-CAT-KO homozygous mice are more similar to each other and the morphological changes observed in these two genotypes seem not as severe as those seen in diminuendo homozygous mice. However, Ptprq-CAT-KO homozygote and diminuendo homozygote IHCs both appear markedly more affected than diminuendo heterozygote IHCs, which closely resemble wildtype IHCs (Fig. 5). The relationships can be summarised as follows:
OHCs: Dmdo/Dmdo < Ptprq/Ptprq = Dmdo/+ < WT
IHCs: Dmdo/Dmdo < Ptprq/Ptprq < Dmdo/+ < WT
These findings suggest that the downregulation of Ptprq is likely to be an important contributor to the hair cell phenotype observed in diminuendo mice, but it is not sufficient to explain all of it.
Microarray and qRTPCR
None of the probes showed a significant difference in expression levels between wildtypes and Ptprq-CAT-KO homozygotes after significance was adjusted to allow for multiple tests. However, there were a number of interesting genes among those with an unadjusted P < 0.01 (Table 1). These include Calb2, Hsd17b7, Chrna1, Chrna9 and Otof, which showed altered expression in the diminuendo microarray and further quantitative PCR, as we have previously reported (Lewis et al., 2009; see also Kuhn et al., 2011), and Grxcr1, which was of interest as the gene mutated in the pirouette mutant (Odeh et al., 2010). All six genes were downregulated in the Ptprq-CAT-KO microarray (Table 1), while in diminuendo homozygotes Calb2, Chrna1, Chrna9 and Hsd17b7 were downregulated (Lewis et al., 2009) and Otof was upregulated (Kuhn et al., 2011). These six genes were chosen for validation by quantitative RTPCR in the present study.
Table 1.
Genes with changes in expression (unadjusted P < 0.01) from the microarray
| Gene Name | Ensembl ID | Proportional change | P-value | Adjusted P-value |
|---|---|---|---|---|
| PTPRQ | ENSMUSG00000035916 | −1.668142552 | 1.22E-05 | 0.258653553 |
| RPRM | ENSMUSG00000075334 | −1.42558442 | 0.000255653 | 0.999832538 |
| ENPP2 | ENSMUSG00000022425 | −1.170514788 | 0.001266519 | 0.999832538 |
| PAQR9 | ENSMUSG00000064225 | −1.234515233 | 0.001500896 | 0.999832538 |
| SCARA3 | ENSMUSG00000034463 | −1.146440488 | 0.001698927 | 0.999832538 |
| LRPPRC | ENSMUSG00000024120 | −1.149490043 | 0.001915957 | 0.999832538 |
| GM1027 | ENSMUSG00000047502 | −1.132141912 | 0.002083288 | 0.999832538 |
| FRY | ENSMUSG00000056602 | −1.316716103 | 0.002264682 | 0.999832538 |
| TUBA1A | ENSMUSG00000072235 | −1.158236745 | 0.002350494 | 0.999832538 |
| REEP6 | ENSMUSG00000035504 | −1.287813751 | 0.002673204 | 0.999832538 |
| 6330409N04RIK | ENSMUSG00000021930 | −1.154864691 | 0.00278719 | 0.999832538 |
| GRXCR1 | ENSMUSG00000068082 | −1.374271986 | 0.003023447 | 0.999832538 |
| HAUS1 | ENSMUSG00000041840 | −1.460383181 | 0.00302821 | 0.999832538 |
| CXADR | ENSMUSG00000022865 | −1.177070915 | 0.003301987 | 0.999832538 |
| CALB2 | ENSMUSG00000003657 | −1.872545244 | 0.003340481 | 0.999832538 |
| HS6ST2 | ENSMUSG00000062184 | −1.197160378 | 0.003409697 | 0.999832538 |
| HSD17B7 | ENSMUSG00000026675 | −1.508593767 | 0.003609971 | 0.999832538 |
| TCEA3 | ENSMUSG00000001604 | 1.145237128 | 0.003669075 | 0.999832538 |
| CYLD | ENSMUSG00000036712 | −1.221211996 | 0.003802919 | 0.999832538 |
| FAM177a | ENSMUSG00000095595 | −1.298189092 | 0.003856988 | 0.999832538 |
| GHSR | ENSMUSG00000051136 | −1.133219164 | 0.003930565 | 0.999832538 |
| MYCL1 | ENSMUSG00000028654 | −1.455969357 | 0.005057643 | 0.999832538 |
| CXADR | ENSMUSG00000022865 | −1.194386586 | 0.005408051 | 0.999832538 |
| HSPA2 | ENSMUSG00000059970 | −1.32492769 | 0.005413211 | 0.999832538 |
| ACCN2 | ENSMUSG00000023017 | −1.223432756 | 0.005542887 | 0.999832538 |
| CYLD | ENSMUSG00000036712 | −1.163235475 | 0.005846245 | 0.999832538 |
| ASAP2 | ENSMUSG00000052632 | 1.119392959 | 0.006286889 | 0.999832538 |
| ANO1 | ENSMUSG00000031075 | −1.408344537 | 0.006989795 | 0.999832538 |
| SLC25A5 | ENSMUSG00000016319 | −1.108047476 | 0.007157786 | 0.999832538 |
| MARVELD3 | ENSMUSG00000001672 | −1.243287418 | 0.007360472 | 0.999832538 |
| 6030405A18Rik | ENSMUSG00000056306 | −1.366002261 | 0.007580547 | 0.999832538 |
| TMEM25 | ENSMUSG00000002032 | −2.539909188 | 0.007733011 | 0.999832538 |
| C030014I23RIK | ENSMUSG00000060380 | −1.291455753 | 0.0077525 | 0.999832538 |
| NFE2L3 | ENSMUSG00000029832 | −1.251621116 | 0.007866223 | 0.999832538 |
| KCTD3 | ENSMUSG00000026608 | −1.101026278 | 0.008013213 | 0.999832538 |
| AFTPH | ENSMUSG00000049659 | −1.153614005 | 0.008310229 | 0.999832538 |
| KIF2A | ENSMUSG00000021693 | −1.131059659 | 0.008322974 | 0.999832538 |
| PRKCDBP | ENSMUSG00000037060 | 1.181724169 | 0.008391717 | 0.999832538 |
| 2810011L19RIK | ENSMUSG00000097929 | −1.639169358 | 0.008672408 | 0.999832538 |
| ANGPTL2 | ENSMUSG00000004105 | 1.173678608 | 0.008928208 | 0.999832538 |
| C030014I23RIK | ENSMUSG00000060380 | −1.296314718 | 0.008978949 | 0.999832538 |
| CHRNA1 | ENSMUSG00000027107 | −1.689431657 | 0.009032761 | 0.999832538 |
| SEMA3E | ENSMUSG00000063531 | −1.288802355 | 0.009075836 | 0.999832538 |
| ERLIN2 | ENSMUSG00000031483 | −1.137591058 | 0.009078345 | 0.999832538 |
| OTOF | ENSMUSG00000062372 | −1.822630656 | 0.009080105 | 0.999832538 |
| HDAC2 | ENSMUSG00000019777 | −1.155381566 | 0.009307828 | 0.999832538 |
| KCTD14 | ENSMUSG00000051727 | 1.133454846 | 0.00948616 | 0.999832538 |
| LRRC24 | ENSMUSG00000033707 | −1.173728732 | 0.009519745 | 0.999832538 |
| TLN2 | ENSMUSG00000052698 | 1.151209002 | 0.00963685 | 0.999832538 |
| CHRNA9 | ENSMUSG00000029205 | −1.462315299 | 0.009711404 | 0.999832538 |
List of genes from the microarray with differences in expression between Pprq-CAT-KO homozygotes and wildtype littermates (unadjusted P < 0.01). Four genes are known to be involved in deafness (PTPRQ, OTOF, GRXCR1 and CHRNA9).
qRTPCR of these six genes showed that Grxcr1, Otof and Hsd17b7 were all significantly downregulated in Ptprq-CAT-KO homozygotes compared to wildtype littermates [littermates Grxcr1, P = 1.72 × 10⁻⁷(Student's t-test); Otof, P = 4.52 × 10⁻⁵(Welch's t-test); Hsd17b7, P = 7.52 × 10⁻⁹(Student's t-test)] ((Fig. 7), confirming the microarray results. The expression levels of Chrna1 in Ptprq-CAT-KO homozygotes relative to wildtype littermates varied widely between the three pairs used, and Chrna9 and Calb2 were not significantly affected [Chrna9, P = 1 (Wilcoxon t-test); Calb2, P = 0.15 (Welch's t-test)]. Expression of Grxcr1 was not significantly altered in the diminuendo microarray and Otof is upregulated in diminuendo homozygotes (Lewis et al., 2009; Kuhn et al., 2011), so in this case only the Hsd17b7 downregulation resembles the diminuendo homozygote phenotype.
Fig. 7.
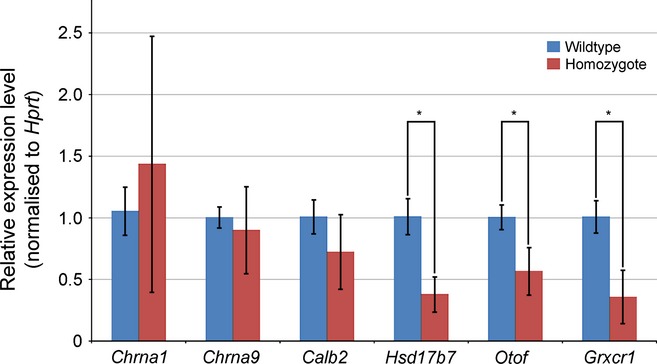
Quantitative real time PCR on cDNA from organ of Corti RNA from Ptprq-CAT-KO homozygote and wildtype littermates at P4. Three pairs were used for each comparison. Quantities have been normalised to Hprt levels, and Jag1 was used to control for sensory tissue; all pairs used showed no significant difference in expression of Jag1. Hsd17b7, Otof and Grxcr1 are all significantly downregulated in Ptprq-CAT-KO homozygotes. *P < 0.01. Error bars represent SD.
We also compared the microarray data on a larger scale, using first a Pearson correlation comparing the probe log proportional changes across both microarrays (13 542 of the probes were present in both microarrays, out of 21 229 in the Ptprq microarray and 25 044 in the diminuendo array). This resulted in a Pearson coefficient of 0.31, which is a comparatively low correlation (Fig. 8A). When considering only probes with an unadjusted P-value < 0.1 in both arrays (146 probes, of 1012 probes with P < 0.1 in the Ptprq microarray and 2506 probes with P < 0.1 in the diminuendo microarray), however, the coefficient was 0.62 (Fig. 8B). The same data (probes with unadjusted P < 0.1 from both microarrays) were used to create a heatmap visualisation of the probe proportional changes from both arrays (Fig. 8C). While the magnitude of regulation differed between diminuendo homozygotes and Ptprq-CAT-KO homozygotes, the scattergraph and heatmap show that most of the genes were regulated similarly; those upregulated in diminuendo homozygotes were upregulated in Ptprq-CAT-KO homozygotes (green in the heatmap) and those downregulated in diminuendo homozygotes were downregulated in Ptprq-CAT-KO homozygotes (pink in the heatmap). The magnitude of up- or downregulation compared to wildtype littermates was noticeably greater in the diminuendo array than in the Ptprq-CAT-KO array (indicated by the darker colours).
Fig. 8.
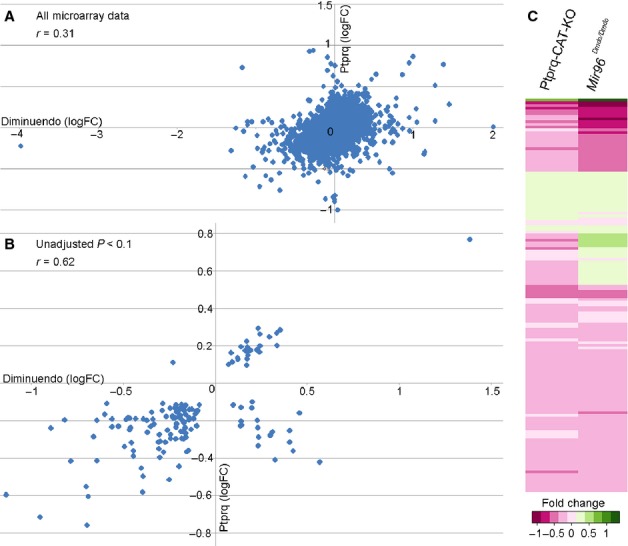
(A and B) Scattergraphs showing correlation of data from the two microarrays; A shows the correlation of all genes present in both microarrays regardless of significance while B shows the correlation of those genes with an unadjusted P < 0.1 in both microarrays. (C) Heatmap created using the R statistical software package, showing genes with an unadjusted P < 0.1 from the Ptprq-CAT-KO microarray (left) compared with the same genes (also with unadjusted P < 0.1) from the diminuendo microarray (right). Genes are compared and coloured according to their proportional change, on a scale from dark pink (most downregulated) to dark green (most upregulated).
Pathway analysis was carried out using GSEA with ranked lists of genes from both arrays; again, an unadjusted P < 0.1 was used. GSEA takes a list of genes with a ranking (in this case, the log of the proportional change) and a set of known pathways and tests to see whether any of the pathways are over-represented by the genes at the top or the bottom of the ranked list. Overall, we found more pathways significantly over-represented in diminuendo dysregulated genes (P < 0.05) but, after removing uninformative pathways (such as ‘system development’ and ‘system process’), several pathways were significantly enriched in both Ptprq and diminuendo dysregulated genes (Fig. 9A and B, Table 2). The shared pathways related to the neurological system and to cell proliferation. No canonical pathways (as defined by mSigDB) were shared, but there were multiple transcription factors implicated in the transcriptional phenotype of both mutants (Fig. 9C).
Fig. 9.
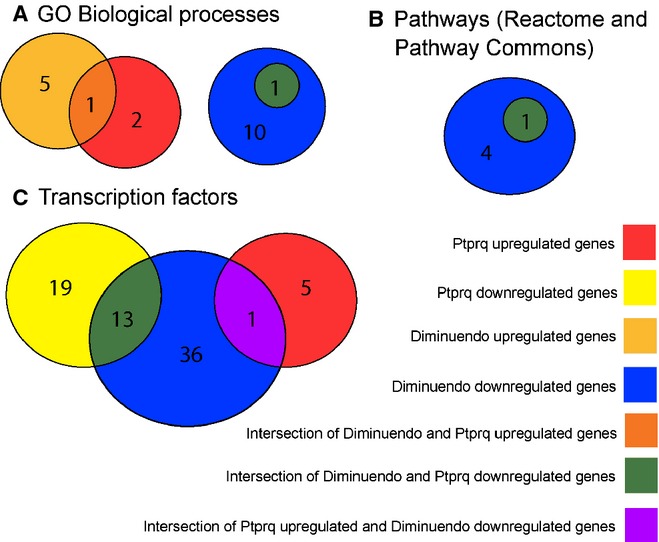
Venn diagrams showing the numbers of gene sets significantly enriched in the diminuendo and Ptprq microarrays, and how many are common to both. (A) Gene sets annotated with GO biological processes (from the mSigDB dataset); (B) gene sets defined by Pathway Commons and Reactome corresponding to known biological pathways; (C) gene sets regulated by transcription factors (from the mSigDB dataset).
Table 2.
Details of pathway enrichment in the diminuendo and Ptprq microarrays
| Diminuendo genes | Ptprq genes | |||
|---|---|---|---|---|
| Upregulated | Downregulated | Upregulated | Downregulated | |
| GO Biological Processes | 6 (76) | 17 (103) | 3 (30) | 2 (64) |
| Reactome | 9 (55) | 4 (73) | 1 (9) | 1 (19) |
| Pathway Commons | 0 (22) | 2 (124) | 1 (11) | 1 (68) |
| Transcription factors | 3 (114) | 55 (430) | 6 (85) | 38 (336) |
Genes with unadjusted P < 0.1 were used, compared to four different gene sets – genes annotated with GO Biological Processes, genes playing a role in Reactome pathways, genes associated with Pathway Commons pathways and genes regulated by transcription factor-associated regulatory sites. The number of significantly enriched pathways (P < 0.05) is followed by the total number of gene sets considered in brackets. In order for a gene set to be considered, at least ten of its genes had to be present in the list compiled from the microarray.
The broad pattern of the transcriptome of Ptprq-CAT-KO homozygotes resembled that of diminuendo homozygotes but was not as severe. In addition, not all the genes affected were regulated in the same direction. The downregulation of Ptprq may contribute to but cannot explain all the transcriptome effects seen in diminuendo mice.
Hair cell transducer current is impaired in diminuendo mutant mice
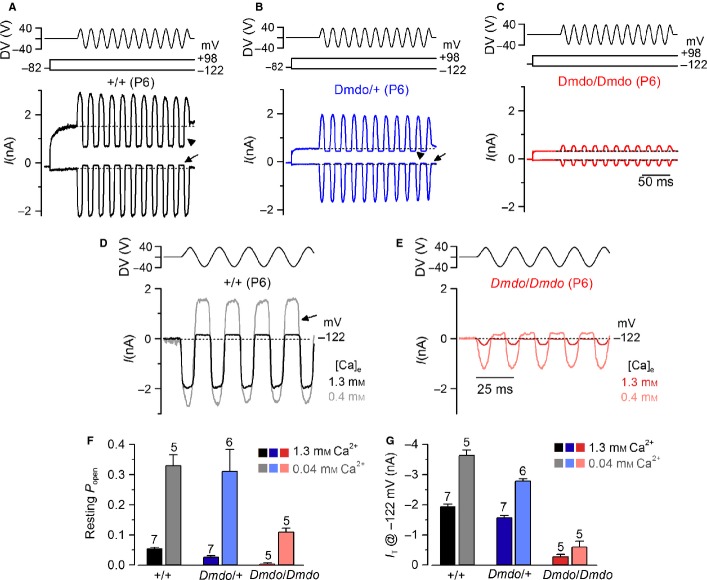
We measured MET currents from OHCs of diminuendo mice in order to compare them with those previously recorded from cells of Ptprq-mutant mice, and they showed a reduced amplitude (Goodyear et al., 2003). Transducer currents from P6 apical-coil OHCs in diminuendo control (+/+), heterozygous (Dmdo/+) and homozygous mutant (Dmdo/Dmdo) mice were elicited by alternating inhibitory and excitatory bundle displacements using 50-Hz sinusoidal force stimuli (Johnson et al., 2011, 2012). Upon moving the bundles in the excitatory direction (i.e. towards the taller stereocilia) and at negative membrane potentials, an inward MET current could be elicited in OHCs from all genotypes (Fig. 10A–C), suggesting that the tip links were present and functional. The maximal MET current in control OHCs (−1941 ± 79 pA at −122 mV, n = 7) was significantly larger than that in heterozygous (−1581 ± 68 pA, n = 6, one-way anova, Tukey post-test – P < 0.01) and homozygous (−273 ± 78 pA n = 5, one-way anova, Tukey post-test – P < 0.0001) mutant cells (overall significance – F2,15 = 123.1, P < 0.0001). Any resting current flowing through open MET channels in the absence of mechanical stimulation was reduced when bundles were moved in the inhibitory direction (i.e. away from the taller stereocilia) in all control and mutant OHCs (Fig. 10A–C, arrows). However, the open probability of MET channels at rest in 1.3-mm Ca2+ was significantly larger in control (0.055 ± 0.004 at −122 mV, n = 7) than in heterozygous (0.026 ± 0.005 pA, n = 6, one-way anova, Tukey post-test – P < 0.001) and homozygous (0.004 ± 0.003 pA, n = 5, one-way anova, Tukey post-test – P < 0.0001) mutant cells (overall significance – F2,15 = 33.5, P < 0.0001). Because the MET current reverses near 0 mV (Zampini et al., 2011), it became outward when excitatory bundle stimulation was applied during voltage steps positive to its reversal potential (Fig. 10A–C). At positive potentials (+ 98 mV), the larger resting transducer current (Fig. 10A–C, arrowheads) is likely to be due to an increased open probability of the transducer channel resulting from a reduced driving force for Ca2+ influx (Crawford et al., 1989; Johnson et al., 2011). Note that the residual outward K+ current observed at + 98 mV, just before the beginning of the MET current, was largely reduced in heterozygous and homozygous mutant OHCs, which is consistent with a failure in the normal development of the basolateral membrane currents in these diminuendo mutant cells (Kuhn et al., 2011). We asked whether the Ca2+ sensitivity of the MET current was affected in diminuendo mutant OHCs by locally superfusing their hair bundle with a solution containing an endolymph-like concentration of Ca2+ (0.04 mm; Bosher & Warren, 1978). Lowering the extracellular Ca2+ concentration is known to increase both the maximum MET current and its fraction activated at rest. Calcium is a permeant blocker of the transducer channel (Ricci & Fettiplace, 1998; Marcotti et al., 2005), so the increased current amplitude in low Ca2+ is caused by the partial relief of this block. Moreover, extracellular Ca2+ causes adaptation and as such closes some transducer channels. Therefore, reducing Ca2+ influx into the transducer channel, by either depolarizing hair cells to near the Ca2+ equilibrium potential (as shown in Fig. 10A–C) or lowering the extracellular concentration, causes an increased open probability of the channel (Crawford et al., 1991). In diminuendo mice, both phenomena were observed because decreasing the Ca2+ concentration from 1.3 to 0.04 mm increased the resting (Fig. 10D–F) and maximal (Fig. 10D, E and G) MET current in control and homozygous OHCs. The above results indicate that the size of the MET current, but not its Ca2+ sensitivity, is affected by mutation in miR-96.
Fig. 10.
Mechanotransducer currents in diminuendo cochlear outer hair cells. (A–C) Saturating transducer currents recorded from (A) a control (B), a heterozygous and (C) a homozygous mutant P6 apical-coil diminuendo OHC by applying sinusoidal force stimuli of 50 Hz to the hair bundles at −122 mV and + 98 mV. The driver voltage (DV) signal of ± 40 V to the fluid jet is shown above the traces (negative deflections of the DV are inhibitory). The holding potential was −82 mV. Extracellular Ca2+ concentration was 1.3 mm. The arrows and arrowheads indicate the closure of the transducer currents (i.e. resting current) elicited during inhibitory bundle displacements at hyperpolarized and depolarized membrane potentials, respectively. Note that the resting current increases with membrane depolarization. Dashed lines indicate the holding current, which is the current at the holding membrane potential. (D and E) Comparison of transducer currents recorded from (D) a control and (E) a homozygous mutant P6 diminuendo OHC in the presence of 1.3 mm Ca2+ (black/red) and endolymphatic-like Ca2+ concentration (0.04 mm; grey/pink lines) at −122 mV. (F and G) Resting current (F) and (G) peak transducer current at a membrane potential of −122 mV recorded in OHCs from the three genotypes in the presence of 1.3 mm (black/blue/red) and 0.04 mm (grey/pale blue/pink) extracellular Ca2+.
miR-96 has recently been shown to regulate the progression of the physiological differentiation of cochlear hair cells as in its absence the development of the basolateral biophysical properties is arrested just after the day of birth (Kuhn et al., 2011). We tested whether miR-96 was also able to control the normal developmental maturation of the mechanoelectrical transduction apparatus in hair cells by comparing the properties of the MET current in heterozygous and homozygous diminuendo OHCs to that of control cells. Hair bundles from OHCs were stimulated using alternating inhibitory and excitatory step mechanical stimuli instead of sinusoids, which allows the measurement of MET channel adaptation in addition to current size. In control P6 OHCs, excitatory bundle movements with non-saturating stimuli elicited rapid inward currents at a holding potential of −84 mV (Fig. 11A, arrow in left panel). Inhibitory hair bundle stimulation shuts off the small fraction of current flowing at rest (see also Fig. 10A) and, at the offset of large inhibitory steps, a transient rebound (downward dip; Fig. 11A, arrowhead in left panel) was observed. All these manifestations of MET current adaptation are similar to those described in control auditory hair cells from lower vertebrates and mice (Crawford et al., 1989; Kennedy et al., 2005). Slipping and rebound adaptation were largely reduced or absent in heterozygous and homozygous diminuendo P6 OHCs (Fig. 11A, middle and right panels). We then compared the MET current responses in diminuendo mutant OHCs (Fig. 11A) with those recorded in control cells during early postnatal development (P1–6; Fig. 11B shows examples at P2, P3 and P4). We found that both the amplitude (Fig. 11C) and the extent (Fig. 11D) of adaptation during excitatory stimulation (Fig. 11A, arrow in left panel) of the MET current in P6 OHCs from diminuendo homozygous mutant were similar to those recorded in P1-P2 control cells (Fig. 11C and D, respectively; red). An intermediate phenotype was seen for heterozygous diminuendo OHCs (Fig. 11C and D; blue).
Fig. 11.
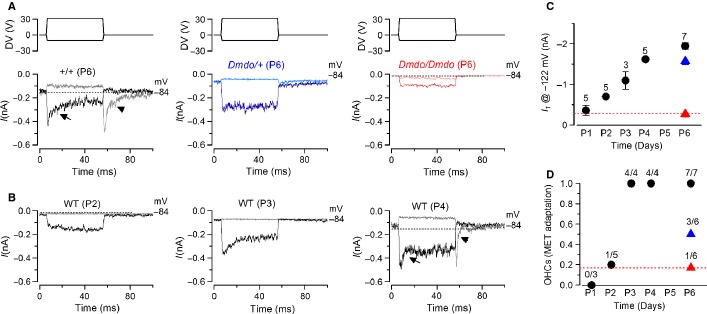
The development of transducer currents in diminuendo mutant OHCs is prematurely arrested. (A) Driver voltages to the fluid jet (top panels) and transducer currents recorded at −84 mV from a control, a heterozygous and a homozygous diminuendo mutant P6 OHC. Positive driver voltages (excitatory direction) elicited inward (negative) transducer currents that declined or adapted over time only in control OHCs (arrow). A small transducer current was present at rest (before t = 0) and inhibitory bundle displacement turned this off. Upon termination of the inhibitory stimulus, the transducer current in control OHCs showed evidence of rebound adaptation (arrowhead). (B) Example of transducer currents in developing control OHCs (P2, P3 and P4). Note that both signs of current adaptation (arrow and arrowhead) are first detected at P4. (C) Maximal transducer current recorded at different postnatal ages in control OHCs (black) and that of the heterozygous (blue) and homozygous (red) diminuendo mutant cells at P6. The number of OHCs tested is shown above each data point. (D) Extent of adaptation for small bundle deflection towards the excitatory directions (see arrows in panel A, left panel) of the transducer current at different postnatal ages in control OHCs (black) and that of the heterozygous (blue) and homozygous (red) diminuendo mutant cells at P6. The number of OHCs showing MET current adaptation over the total number of cells tested is shown above each data point. Note that (C) the size and (D) the extent of adaptation recorded in P6 homozygous diminuendo OHCs is similar to that measured in P1–2 control cells.
In summary, we have shown that the biophysical properties of the MET currents in diminuendo homozygous OHCs are arrested at a very early stage of postnatal development. We also see a strong similarity between the reduced amplitude of the MET current in diminuendo heterozygotes with that previously reported in OHCs from Ptprq-null mutant mice (Goodyear et al., 2003). However, both slipping and rebound adaptation are absent or largely reduced in diminuendo heterozygotes while they were still present in Ptprq-null mutants (Goodyear et al., 2003).
Discussion
Homozygous diminuendo mice at P4 lack the normal gradient of hair bundle development of OHCs between 0 and 80% of the cochlear length while above that in the apex the hair cells are still less mature than those at the equivalent position in wildtype littermates. This suggests developmental retardation followed by stalling at a certain point in differentiation. The hair cells appear unable to differentiate any further. Heterozygous diminuendo mice show a delay in differentiation of OHCs at P4 but there is no stalling of development at this stage; the gradient of maturity is present throughout the organ of Corti. We have previously shown that, at 4 weeks old, diminuendo heterozygote OHCs still display significantly narrower bundle span than wildtypes while supporting cells have wider apices, and hair cell density remains the same (see Supporting Information Fig. s1p and q in Lewis et al., 2009). The OHCs of P4 Ptprq-CAT-KO homozygous mice also appear to exhibit delayed differentiation, similar to diminuendo heterozygotes but with a greater delay (Fig. 3). The IHCs of diminuendo heterozygotes are broadly similar to wildtypes, but both diminuendo homozygote and Ptprq-CAT-KO homozygote IHCs have disorganised stereocilia bundles. However, Ptprq-CAT-KO IHCs display more hallmarks of maturity than diminuendo homozygote IHCs, such as well-organised stereocilia rows and thickening of stereocilia tips. The overall phenotype of Ptprq-CAT-KO hair cells bears a striking resemblance to that of diminuendo heterozygous mice and is not as severe as that of diminuendo homozygous mice, suggesting that the reduction in Ptprq activity is a major contributor to the diminuendo stereocilia morphological phenotype. This observation also fits with part of the electrophysiological phenotype, where heterozygous diminuendo mice resemble homozygous Ptprq-null mice (Goodyear et al., 2003), with a reduced MET current amplitude compared to controls. In diminuendo homozygotes the phenotype is more severe, as normal development of the MET current amplitude appears to be arrested just after birth (P1–2), consistent with the proposed role of miR-96 in regulating the progression of the physiological and morphological differentiation of mammalian cochlear hair cells (Kuhn et al., 2011). Furthermore, the downregulation of Ptprq expression in the diminuendo mutants is not likely to be responsible for the adaptation defects seen in these mice, because adaptation in Ptprq mutants is near to normal (Goodyear et al., 2003).
The transcriptome analyses, on the other hand, show less of a similarity between Ptprq-CAT-KO and diminuendo. This is not unexpected – Ptprq is not a regulatory factor but performs a specific function in the hair cell, while miR-96, which is a regulator, would be expected to affect the expression of many genes. However, when just the genes with a P-value < 0.1 are considered, there are similarities between Ptprq-CAT-KO and diminuendo, with many of the genes affected in Ptprq-CAT-KO homozygotes being similarly regulated in diminuendo homozygotes, as seen in the heatmap (Fig. 8C) and reflected in the correlation coefficient, r = 0.62 (Fig. 8B). An initial exploration of pathways affected shows that some of the pathways and transcription factors implicated by the transcriptional data are common to both mutants. Of the three genes whose expression changes were confirmed by qRTPCR, however, only downregulation of Hsd17b7 is seen in both Ptprq-CAT-KO and diminuendo homozygotes. Grxcr1 is not significantly affected in diminuendo homozygotes, and Otof is upregulated in diminuendo homozygotes and downregulated in Ptprq-CAT-KO homozygotes (Lewis et al., 2009; Kuhn et al., 2011). In addition, many of the other major molecular changes observed in diminuendo homozygotes are not reproduced in Ptprq-CAT-KO homozygotes, for example the downregulation of Ocm. It is possible that Hsd17b7 is downregulated in both mutants because of a specific effect for which lack of Ptprq is responsible. Hsd17b7 (hydroxysteroid (17-beta) dehydrogenase 7) is involved in cholesterol biosynthesis and is required for neuronal survival early in development; mice homozygous for a disrupted allele of Hsd17b7 die at embryonic day 10.5, with increased apoptosis observed in the neural tube, dorsal root ganglia and trigeminal nerve. They also display cardiovascular defects (Shehu et al., 2008; Jokela et al., 2010). Mice with an ENU-induced mutation in Hsd17b7 display disrupted Hedgehog signalling. The mutation is hypomorphic; it leads to most of the Hsd17b7 transcripts being truncated due to a mis-splice, but low levels of wildtype transcript are still present (Stottmann et al., 2011). Hedgehog signalling is required for inner ear development (Liu et al., 2002; Riccomagno et al., 2002), but any more direct link between Ptprq and Hsd17b7 remains unclear. The changes in expression of Grxcr1 in Ptprq-CAT-KO homozygotes, and of Otof in both diminuendo and Ptprq-CAT-KO homozygotes, may be only indicative of a dysfunctional hair cell.
In conclusion, many of the morphological and electrophysiological features of diminuendo heterozygotes are reproduced in Ptprq-CAT-KO homozygotes, and in some features the transcriptome of Ptprq-CAT-KO homozygotes resembles that of diminuendo homozygotes. It is particularly interesting that in the P4 diminuendo cochlea there is very little difference in expression of Ptprq between heterozygotes and homozygotes; Ptprq is downregulated to ∼ 62% of the wildtype level in heterozygotes and ∼56% of the wildtype level in homozygotes (Lewis et al., 2009), which would suggest that diminuendo heterozygotes and homozygotes should both resemble Ptprq heterozygotes, which is not the case; Ptprq-CAT-KO heterozygotes have no hair cell defects (Goodyear et al., 2003). The reduction in Ptprq seen in diminuendo mice appears to be a major contributor to the phenotype, particularly the apparent delay and eventual stalling of hair cell development observed by scanning electron microscopy and the delayed development of the MET current, but it does not account for all of the observations. The more severe phenotypes in the diminuendo homozygous mice indicate that other genes besides Ptprq are contributing to the diminuendo homozygous phenotype, and these genes may not be affected in diminuendo heterozygous or Ptprq-null mice.
Acknowledgments
This work was supported by the Wellcome Trust [grant numbers 100669 (K.P.S.) and 091895 (W.M.)], Action on Hearing Loss (G41) and the MRC. S.L.J is a Royal Society University Research Fellow. We thank Guy Richardson for providing us with the Ptprq-CAT-KO mice, Rosalind Lacey for animal care, and Chris McGee and Ruben Bautista-Garcia for assistance with the microarray. The authors declare no competing financial interests.
Glossary
- GSEA
Gene Set Enrichment Analysis (software)
- IHC
inner hair cell
- MET
mechanoelectrical transducer (current)
- OHC
outer hair cell
- P
postnatal day
- Ptprq-CAT-KO
a catalytically inactive form of Ptprq
Author contributions
The scanning electron microscopy was carried out by J.C. and cartoons were drawn by M.L. RTPCR was carried out by A.H. and M.L. J.H. and M.L. collected and genotyped samples for RNA extraction. Microarray analysis was done by M.L. The electrophysiological experiments were carried out by S.L.J and W.M. The study was designed by K.P.S. and W.M. and the paper was written by J.C., M.L, W.M. and K.P.S.
References
- Benjamini Y, Hochberg Y. Controlling the false discovery rate: a practical and powerful approach to multiple testing. J. R. Stat. Soc. Ser. B. 1995;57:289–300. [Google Scholar]
- Bolstad B. 2001. Probe level quantile normalization of high density oligonucleotide array data. Available at http://bmbolstad.com/stuff/qnorm.pdf.
- Bolstad BM, Irizarry RA, Astrand M, Speed TP. A comparison of normalization methods for high density oligonucleotide array data based on variance and bias. Bioinformatics. 2003;19:185–193. doi: 10.1093/bioinformatics/19.2.185. [DOI] [PubMed] [Google Scholar]
- Bosher SK, Warren RL. Very low calcium content of cochlear endolymph, an extracellular fluid. Nature. 1978;273:377–378. doi: 10.1038/273377a0. [DOI] [PubMed] [Google Scholar]
- Chen J, Ingham N, Clare S, Raisen C, Vancollie VE, Ismail O, McIntyre RE, Tsang SH, Mahajan VB, Dougan G, Adams DJ, White JK, Steel KP. Mcph1-deficient mice reveal a role for MCPH1 in otitis media. PLoS ONE. 2013;8:e58156. doi: 10.1371/journal.pone.0058156. [DOI] [PMC free article] [PubMed] [Google Scholar]
- Crawford AC, Evans MG, Fettiplace R. Activation and adaptation of transducer currents in turtle hair cells. J. Physiol. 1989;419:405–434. doi: 10.1113/jphysiol.1989.sp017878. [DOI] [PMC free article] [PubMed] [Google Scholar]
- Crawford AC, Evans MG, Fettiplace R. The actions of calcium on the mechano-electrical transducer current of turtle hair cells. J. Physiol. 1991;434:369–398. doi: 10.1113/jphysiol.1991.sp018475. [DOI] [PMC free article] [PubMed] [Google Scholar]
- Erven A, Skynner MJ, Okumura K, Takebayashi S, Brown SD, Steel KP, Allen ND. A novel stereocilia defect in sensory hair cells of the deaf mouse mutant Tasmanian devil. Eur. J. Neurosci. 2002;16:1433–1441. doi: 10.1046/j.1460-9568.2002.02213.x. [DOI] [PubMed] [Google Scholar]
- Gentleman RC, Carey VJ, Bates DM, Bolstad B, Dettling M, Dudoit S, Ellis B, Gautier L, Ge Y, Gentry J, Hornik K, Hothorn T, Huber W, Iacus S, Irizarry R, Leisch F, Li C, Maechler M, Rossini AJ, Sawitzki G, Smith C, Smyth G, Tierney L, Yang JY, Zhang J. Bioconductor: open software development for computational biology and bioinformatics. Genome Biol. 2004;5:R80. doi: 10.1186/gb-2004-5-10-r80. [DOI] [PMC free article] [PubMed] [Google Scholar]
- Goodyear RJ, Legan PK, Wright MB, Marcotti W, Oganesian A, Coats SA, Booth CJ, Kros CJ, Seifert RA, Bowen-Pope DF, Richardson GP. A receptor-like inositol lipid phosphatase is required for the maturation of developing cochlear hair bundles. J. Neurosci. 2003;23:9208–9219. doi: 10.1523/JNEUROSCI.23-27-09208.2003. [DOI] [PMC free article] [PubMed] [Google Scholar]
- Goodyear RJ, Jones SM, Sharifi L, Forge A, Richardson GP. Hair bundle defects and loss of function in the vestibular end organs of mice lacking the receptor-like inositol lipid phosphatase PTPRQ. J. Neurosci. 2012;32:2762–2772. doi: 10.1523/JNEUROSCI.3635-11.2012. [DOI] [PMC free article] [PubMed] [Google Scholar]
- Holme RH, Kiernan BW, Brown SD, Steel KP. Elongation of hair cell stereocilia is defective in the mouse mutant whirler. J. Comp. Neurol. 2002;450:94–102. doi: 10.1002/cne.10301. [DOI] [PubMed] [Google Scholar]
- Hunter-Duvar IM. A technique for preparation of cochlear specimens for assessment with the scanning electron microscope. Acta Otolaryngol. Suppl. 1978;351:3–23. doi: 10.3109/00016487809122718. [DOI] [PubMed] [Google Scholar]
- Johnson SL, Forge A, Knipper M, Munkner S, Marcotti W. Tonotopic variation in the calcium dependence of neurotransmitter release and vesicle pool replenishment at mammalian auditory ribbon synapses. J. Neurosci. 2008;28:7670–7678. doi: 10.1523/JNEUROSCI.0785-08.2008. [DOI] [PMC free article] [PubMed] [Google Scholar]
- Johnson SL, Beurg M, Marcotti W, Fettiplace R. Prestin-driven cochlear amplification is not limited by the outer hair cell membrane time constant. Neuron. 2011;70:1143–1154. doi: 10.1016/j.neuron.2011.04.024. [DOI] [PMC free article] [PubMed] [Google Scholar]
- Johnson SL, Kennedy HJ, Holley MC, Fettiplace R, Marcotti W. The resting transducer current drives spontaneous activity in prehearing mammalian cochlear inner hair cells. J. Neurosci. 2012;32:10479–10483. doi: 10.1523/JNEUROSCI.0803-12.2012. [DOI] [PMC free article] [PubMed] [Google Scholar]
- Jokela H, Rantakari P, Lamminen T, Strauss L, Ola R, Mutka AL, Gylling H, Miettinen T, Pakarinen P, Sainio K, Poutanen M. Hydroxysteroid (17beta) dehydrogenase 7 activity is essential for fetal de novo cholesterol synthesis and for neuroectodermal survival and cardiovascular differentiation in early mouse embryos. Endocrinology. 2010;151:1884–1892. doi: 10.1210/en.2009-0928. [DOI] [PubMed] [Google Scholar]
- Kennedy HJ, Crawford AC, Fettiplace R. Force generation by mammalian hair bundles supports a role in cochlear amplification. Nature. 2005;433:880–883. doi: 10.1038/nature03367. [DOI] [PubMed] [Google Scholar]
- Kuhn S, Johnson SL, Furness DN, Chen J, Ingham N, Hilton JM, Steffes G, Lewis MA, Zampini V, Hackney CM, Masetto S, Holley MC, Steel KP, Marcotti W. miR-96 regulates the progression of differentiation in mammalian cochlear inner and outer hair cells. Proc. Natl. Acad. Sci. USA. 2011;108:2355–2360. doi: 10.1073/pnas.1016646108. [DOI] [PMC free article] [PubMed] [Google Scholar]
- Lewis MA, Quint E, Glazier AM, Fuchs H, De Angelis MH, Langford C, van Dongen S, Abreu-Goodger C, Piipari M, Redshaw N, Dalmay T, Moreno-Pelayo MA, Enright AJ, Steel KP. An ENU-induced mutation of miR-96 associated with progressive hearing loss in mice. Nat. Genet. 2009;41:614–618. doi: 10.1038/ng.369. [DOI] [PMC free article] [PubMed] [Google Scholar]
- Liu W, Li G, Chien JS, Raft S, Zhang H, Chiang C, Frenz DA. Sonic hedgehog regulates otic capsule chondrogenesis and inner ear development in the mouse embryo. Dev. Biol. 2002;248:240–250. doi: 10.1006/dbio.2002.0733. [DOI] [PubMed] [Google Scholar]
- Livak KJ, Schmittgen TD. Analysis of relative gene expression data using real-time quantitative PCR and the 2(-Delta Delta C(T)) Method. Methods. 2001;25:402–408. doi: 10.1006/meth.2001.1262. [DOI] [PubMed] [Google Scholar]
- Marcotti W, van Netten SM, Kros CJ. The aminoglycoside antibiotic dihydrostreptomycin rapidly enters mouse outer hair cells through the mechano-electrical transducer channels. J. Physiol. 2005;567:505–521. doi: 10.1113/jphysiol.2005.085951. [DOI] [PMC free article] [PubMed] [Google Scholar]
- Mencia A, Modamio-Hoybjor S, Redshaw N, Morin M, Mayo-Merino F, Olavarrieta L, Aguirre LA, del Castillo I, Steel KP, Dalmay T, Moreno F, Moreno-Pelayo MA. Mutations in the seed region of human miR-96 are responsible for nonsyndromic progressive hearing loss. Nat. Genet. 2009;41:609–613. doi: 10.1038/ng.355. [DOI] [PubMed] [Google Scholar]
- Mootha VK, Lindgren CM, Eriksson KF, Subramanian A, Sihag S, Lehar J, Puigserver P, Carlsson E, Ridderstrale M, Laurila E, Houstis N, Daly MJ, Patterson N, Mesirov JP, Golub TR, Tamayo P, Spiegelman B, Lander ES, Hirschhorn JN, Altshuler D, Groop LC. PGC-1alpha-responsive genes involved in oxidative phosphorylation are coordinately downregulated in human diabetes. Nat. Genet. 2003;34:267–273. doi: 10.1038/ng1180. [DOI] [PubMed] [Google Scholar]
- Morrison A, Hodgetts C, Gossler A, Hrabe de Angelis M, Lewis J. Expression of Delta1 and Serrate1 (Jagged1) in the mouse inner ear. Mech. Develop. 1999;84:169–172. doi: 10.1016/s0925-4773(99)00066-0. [DOI] [PubMed] [Google Scholar]
- Nayak G, Goodyear RJ, Legan PK, Noda M, Richardson GP. Evidence for multiple, developmentally regulated isoforms of Ptprq on hair cells of the inner ear. Dev. Neurobiol. 2011;71:129–141. doi: 10.1002/dneu.20831. [DOI] [PubMed] [Google Scholar]
- Odeh H, Hunker KL, Belyantseva IA, Azaiez H, Avenarius MR, Zheng L, Peters LM, Gagnon LH, Hagiwara N, Skynner MJ, Brilliant MH, Allen ND, Riazuddin S, Johnson KR, Raphael Y, Najmabadi H, Friedman TB, Bartles JR, Smith RJ, Kohrman DC. Mutations in Grxcr1 are the basis for inner ear dysfunction in the pirouette mouse. Am. J. Hum. Genet. 2010;86:148–160. doi: 10.1016/j.ajhg.2010.01.016. [DOI] [PMC free article] [PubMed] [Google Scholar]
- Ricci AJ, Fettiplace R. Calcium permeation of the turtle hair cell mechanotransducer channel and its relation to the composition of endolymph. J. Physiol. 1998;506(Pt 1):159–173. doi: 10.1111/j.1469-7793.1998.159bx.x. [DOI] [PMC free article] [PubMed] [Google Scholar]
- Riccomagno MM, Martinu L, Mulheisen M, Wu DK, Epstein DJ. Specification of the mammalian cochlea is dependent on Sonic hedgehog. Gene. Dev. 2002;16:2365–2378. doi: 10.1101/gad.1013302. [DOI] [PMC free article] [PubMed] [Google Scholar]
- Sakaguchi H, Tokita J, Naoz M, Bowen-Pope D, Gov NS, Kachar B. Dynamic compartmentalization of protein tyrosine phosphatase receptor Q at the proximal end of stereocilia: implication of myosin VI-based transport. Cell Motil. Cytoskel. 2008;65:528–538. doi: 10.1002/cm.20275. [DOI] [PubMed] [Google Scholar]
- Salt AN, Inamura N, Thalmann R, Vora A. Calcium gradients in inner ear endolymph. Am. J. Otolaryng. 1989;10:371–375. doi: 10.1016/0196-0709(89)90030-6. [DOI] [PubMed] [Google Scholar]
- Shehu A, Mao J, Gibori GB, Halperin J, Le J, Devi YS, Merrill B, Kiyokawa H, Gibori G. Prolactin receptor-associated protein/17beta-hydroxysteroid dehydrogenase type 7 gene (Hsd17b7) plays a crucial role in embryonic development and fetal survival. Mol. Endocrinol. 2008;22:2268–2277. doi: 10.1210/me.2008-0165. [DOI] [PMC free article] [PubMed] [Google Scholar]
- Smyth GK. Linear models and empirical bayes methods for assessing differential expression in microarray experiments. Stat. Appl. Genet. Mo. B. 2004;3:Article 3. doi: 10.2202/1544-6115.1027. [DOI] [PubMed] [Google Scholar]
- Smyth GK, Michaud J, Scott HS. Use of within-array replicate spots for assessing differential expression in microarray experiments. Bioinformatics. 2005;21:2067–2075. doi: 10.1093/bioinformatics/bti270. [DOI] [PubMed] [Google Scholar]
- Stottmann RW, Turbe-Doan A, Tran P, Kratz LE, Moran JL, Kelley RI, Beier DR. Cholesterol metabolism is required for intracellular hedgehog signal transduction in vivo. PLoS Genet. 2011;7:e1002224. doi: 10.1371/journal.pgen.1002224. [DOI] [PMC free article] [PubMed] [Google Scholar]
- Subramanian A, Tamayo P, Mootha VK, Mukherjee S, Ebert BL, Gillette MA, Paulovich A, Pomeroy SL, Golub TR, Lander ES, Mesirov JP. Gene set enrichment analysis: a knowledge-based approach for interpreting genome-wide expression profiles. Proc. Natl. Acad. Sci. USA. 2005;102:15545–15550. doi: 10.1073/pnas.0506580102. [DOI] [PMC free article] [PubMed] [Google Scholar]
- Team RC. R: A Language and Environment for Statistical Computing. Vienna, Austria: R Foundation for Statistical Computing; 2012. [Google Scholar]
- Zampini V, Ruttiger L, Johnson SL, Franz C, Furness DN, Waldhaus J, Xiong H, Hackney CM, Holley MC, Offenhauser N, Di Fiore PP, Knipper M, Masetto S, Marcotti W. Eps8 regulates hair bundle length and functional maturation of mammalian auditory hair cells. PLoS Biol. 2011;9:e1001048. doi: 10.1371/journal.pbio.1001048. [DOI] [PMC free article] [PubMed] [Google Scholar]
- Zine A, Van De Water TR, de Ribaupierre F. Notch signaling regulates the pattern of auditory hair cell differentiation in mammals. Development. 2000;127:3373–3383. doi: 10.1242/dev.127.15.3373. [DOI] [PubMed] [Google Scholar]


