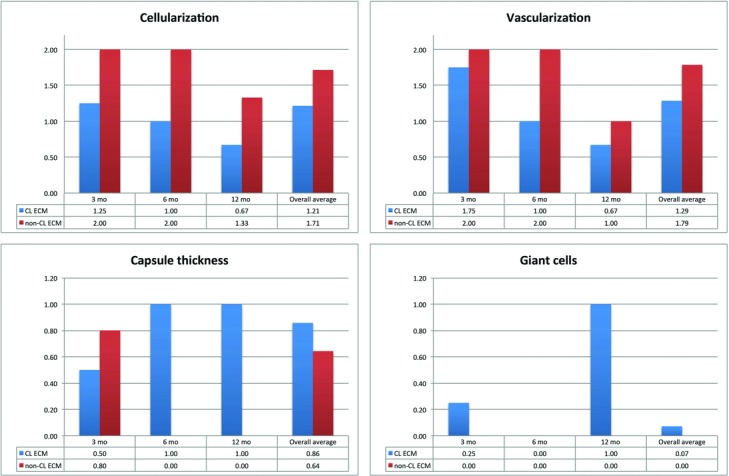
Figure 3.

Graphs showing the average cellularization, vascular density, capsule thickness, and number of giant cells in both types of graft materials. The average level of cellularization was significantly higher in the non-CL ECM grafts than in the CL ECM grafts at 6 months (2 vs 1; P = .029). The difference in cellularization was insignificant at 3 months (2 vs 1.25; P = 0.549) and 12 months (1.33 vs 0.67; P = .329). Vascularization was significantly higher in the non-CL ECM grafts than in the CL ECM grafts at 6 months postimplantation (2 vs 1; P = .029) and insignificant at 3 months (2 vs 1.75; P = .311) and 12 months (1 vs 0.67; P = 1). The capsules in the non-CL ECM were significantly thinner in the non-CL ECM at 6 months (0 vs 1; P = .005) and 12 months (0 vs 1; p = 0.009), compared to the capsules surrounding the CL-ECM grafts. Giant cells were missing in non-CL ECM and were present in CL ECM at 3 months and 12 months, but this result was not statistically significant. CL indicates cross-linked; ECM, extracellular matrix.
