Figure 7.

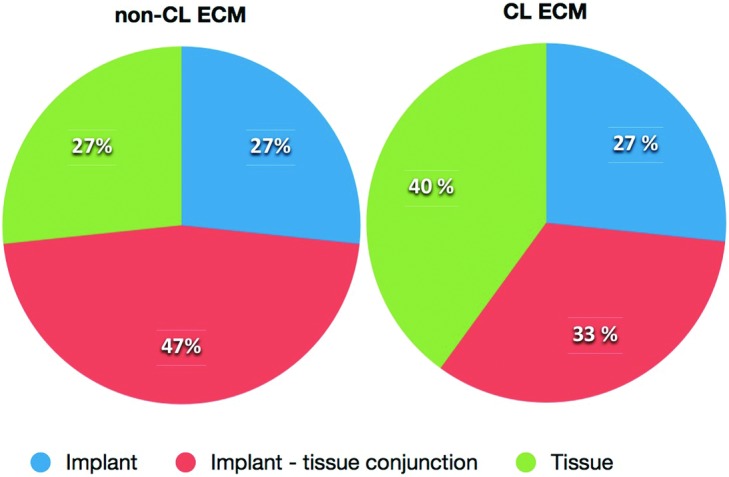
Graphs showing the site of rupture. It was evenly distributed among the implant, the implant-tissue conjunction, and the tissue.

Graphs showing the site of rupture. It was evenly distributed among the implant, the implant-tissue conjunction, and the tissue.