Introduction
Duchenne muscular dystrophy (DMD) is an X-linked recessive disorder affecting approximately 1 of 3,500 newborn human males in whom absence of the protein dystrophin causes progressive degeneration of skeletal and cardiac muscle [1-3]. No treatment halts or reverses the fatal progression of DMD. Although cell and gene therapy have shown tremendous potential in rescuing dystrophic progression, key questions must first be addressed in relevant animal models. Golden retriever muscular dystrophy (GRMD) is a spontaneous X-linked canine model of DMD. Unlike the dystrophin-deficient mdx mouse, which remains relatively normal clinically [4], affected GRMD dogs develop progressive, fatal disease strikingly similar to the human condition [5, 6]. Therefore, GRMD has been increasingly used in therapeutic preclinical trials[7]. The current outcome measurements in muscular dystrophy are suboptimal. Muscle biopsy is invasive and limited by specimen size. Various functional and muscle strength assessments require subjective effort and are susceptible to rater variation [8]. Magnetic resonance imaging (MRI) has been used increasingly to provide meaningful data on the natural history and response to therapy of a number of diseases, including DMD. Studies have also documented the value of MRI in characterizing the GRMD model. Kobayashi et al [9] showed that certain T2-weighted pulse sequences are sensitive in evaluation of skeletal muscle necrosis and/or inflammation.
Thibaud et al [10] recently reported the most comprehensive longitudinal characterization of MR imaging biomarkers in GRMD. MRI has also been used to track potential effects in GRMD therapeutic preclinical trials [11, 12]. However, the use of MRI as an objective and reliable surrogate biomarker is hampered by a lack of automated quantitative imaging analysis methods. Our group recently published a semi-automated quantification method for muscle MRI studies in GRMD dogs [13]. Here, we have used this method in a comprehensive GRMD MRI natural history study that includes both traditional and novel biomarkers. Moreover, we provide for the first time preliminary data from histopathologic correlation.
2. Materials and methods
2.1. Animals and anesthesia
This study was covered by IACUC Protocol 09-011.0 [Natural History and Immunological Parameters in the German Shorthaired Pointer Muscular Dystrophy (GSHPMD) Dog, PI Joe Kornegay, DVM, PhD] at the University of North Carolina at Chapel Hill (UNC-CH) funded by the Muscular Dystrophy Association. Phenotypic features, including MRI, functional studies, muscle biopsies, were assessed longitudinally in GRMD, GSHPMD and normal dogs produced in a colony at UNC-CH over the first year of life. MRI data from a total of 10 GRMD dogs and 8 normal littermates are reported. Dogs were used and cared for according to principles outlined in the National Institutes of Health Guide for the Care and Use of Laboratory Animals. The genotype was initially determined based on elevation of serum creatine kinase and confirmed by polymerase chain reaction (PCR) analysis. For all studies requiring anesthesia, dogs were premedicated with acepromazine maleate (0.2 mg/kg), butorphanol (0.4 mg/kg), and atropine sulfate (0.04 mg/kg), masked, and then intubated and maintained with isoflurane. The proximal pelvic limbs of all dogs were scanned at approximately 3 and 6 months of age. Additional imaging studies were completed at 9 to 12 months in half of each group of GRMD and normal dogs. Necropsy was performed in half of these dogs at 6 months of age and in the remaining half after 9-12 months.
2.2. Histopathologic studies
At 6 months of age, the cranial sartorius and vastus lateralis muscles were sampled by either an open surgical technique as previously described [14] or at necropsy. Frozen section specimens were processed for histochemical evaluation using established techniques [15]. Hematoxylin and eosin (H&E), acidic (pH 4.3) and basic (pH 9.4) ATPase, and trichrome stains were done. Semi-automated analysis was completed utilizing ImageJ software [16]. Type 1 and 2 fiber size was measured using minimal Feret's diameter [17] in the acidic ATPase stained sample. Percent area of connective tissue in the specimens was assessed in H&E stained samples. Necrotic and regenerated fibers were counted in a full cross section specimen field, and presented as numbers of necrotic or regenerated fibers per 1000 muscle fibers.
2.3. MRI acquisition
Dogs were scanned on a Siemens 3T Allegra Head-Only MRI scanner with a circular polarization (CP) head coil or Siemens 3T Tim Trio Whole-Body MRI scanner with a 32-channel body coil at the UNC-CH Biomedical Research Imaging Center (BRIC). Dogs were anesthetized, placed on an MRI gantry in the sternal (prone) position with the pelvic limbs extended and positioned in the coil centered at the midpoint of the femur.
The imaging protocol for the MRI scans is listed in Table 1. T2-weighted image sequences without (T2w) and with fat saturation (T2fs) were acquired using a variable-flip-angle turbo spin echo (TSE) sequence. The time between the excitation pulse and the center of k-space was 400 ms. Importantly, the contrast was not determined only by the TE (400 ms), but also by the flip angle evolution scheme. Although a traditional TSE sequence would have very little signal at 400 ms, the variable flip angle sequence is similar, in principle, to hyper-echo. The hyper-echo reduces the specific absorption rate (SAR), while the variable flip angle sequence allows long TE times [18, 19]. The entire proximal pelvic limbs were included in the field of view. T2 mapping was acquired by obtaining a multi-spin-echo T2 (MSE-T2) sequence that is a ten-echo Carr-Purcell-Meiboom-Gill sequence (Table 1). To make the acquisition time manageable, the MSET2 only covered the mid-femur section of the proximal pelvic limbs. MSE-T2 was used to calculate the values of T2 mapping, which is further described in section 2.4.4.
Table 1.
MR Image Acquisition Protocols.
| TR (ms) | TE (ms) | FA (°) | Resolution (mm3) | Scan Time (min) | |
|---|---|---|---|---|---|
| T2w | 3000 | 406-409 | variable | 1×1×1 | ~27 |
| T2fs | 3000 | 406-409 | variable | 1×1×1 | ~27 |
| MSE-T2 | 3000 | 7-70; Δ7 | 180 | 1×1×2 | ~37 |
FA: flip angle; MSE-T2, multi-spin-echo T2; TE, echo time; TR, repetition time.
2.4. Imaging analysis
Our biomarker quantification scheme is composed of three modules: muscle segmentation, pre-processing, and biomarker analysis. As a prerequisite, we first segmented seven major proximal pelvic limb muscles in the MRI images. Then, the process was continued with several pre-processing steps and calculation of the MRI biomarker maps. Finally, regional statistics of the MRI biomarkers, including statistical texture based biomarkers, were calculated for each segmented muscle. These biomarkers were used to assess longitudinal GRMD disease progression. Our detailed methodology has been published [20].
2.4.1. Muscle segmentation
In this study, we performed semi-automated full-length segmentation of seven major proximal pelvic limb muscles: adductor magnus (AD), biceps femoris (BF), cranial sartorius (CS), gracilis (GR), rectus femoris (RF), semitendinosus (ST), and vastus lateralis (VL). These muscles were selected based on our prior studies [6, 21] to ensure a balanced representation of flexors and extensors, variable sizes, and different histopathologic progression. Three coauthors (ZF, JW, and YS) manually delineated the outlines of each muscle in every fifth slice using the ITK-SNAP software (www.itksnap.org) [22]. Full length muscle volume was then determined using a straightforward volume interpolation method. Briefly, values in the segment between two manually segmented slices were determined by linearly combining the two manual segmentations and thresholding at 50% [20, 23, 24].
2.4.2. Pre-processing
The pre-processing includes intensity inhomogeneity correction, image registration, calculation of T2 value map, and intensity calibration, as detailed [20, 25].
2.4.3. Texture analysis biomarkers
Gray level run length analysis was proposed as an effective method to study visual texture a number of years ago [26]. While this method has been used to assess primary muscle diseases [27, 28], texture analysis was performed in 2D space and the regions of interest were determined manually. Our group modified this method by automatically generating consecutive three-dimensional (3D) volumes of interest (VOIs) and using full 3D run length matrix based texture features for the biomarker quantification. These methods provided stable and sensitive measures that capture the heterogeneous nature of dystrophic muscles lesions [24]. In this study, we utilized a first-order intensity histogram texture feature (Entropy) and two high order run length matrix features (short run emphasis and run length non-uniformity) for MRI biomarker quantification (see supplementary method - Texture Analysis). Based on the mathematical model, we refer to short run emphasis as the Small Lesion Index (SLI) and run length nonuniformity as the Heterogeneity Index (HI). Both SLI and HI were derived from the run-length matrix. Compared to histogram-based biomarkers that use intensity data only, the run-length matrix method takes into account both the spatial distribution and intensity of the voxels. A gray-level ‘run’ is defined as a set of consecutive voxels of similar intensity in a given direction within a predefined similarity range, where a voxel is the smallest volume unit of 3D space in the image. The MR signal in an imaging voxel is averaged from a 3D volume unit on a regularly spaced, three-dimensional grid. A 3D gray-level run is intended to detect lumps of MRI hyper-intensity that we anticipated would correlate to histologic areas of patchy necrosis.
2.4.4. Definition of biomarkers
For sake of the nine biomarkers studied, the three volume measurements were made on all seven muscles, while the intensity and texture values were only assessed in the BF, CS, and ST muscles, as well as a mean “all” for the seven muscles.
1). Volume
Muscle volume (mm3) was calculated from the muscle segmentation via voxel counting. We anticipated that GRMD dogs would generally have reduced muscle volumes compared to normal ones and that the degree of muscle atrophy would increase with age.
2). Vol/wt
Muscle volume corrected by body weight was defined as muscle volume in mm3 divided by the body weight in kg. This gave the relative muscle volume corrected for body size.
3). Vol/FemL
Muscle volume corrected by femur length was defined as muscle volume in mm3 divided by femur length in mm. This method, in principle, should provide a more accurate correction for body size than values corrected by body weight in that muscle atrophy/hypertrophy itself affects body weight.
*. Vol/FemA
Muscle volume corrected by mid-femur area was defined as muscle volume in mm3 divided by mid-femur bone cross-sectional area in mm2. The mid-femur level is determined by first identifying anatomical landmarks at the proximal limit of the femoral head and the distal limit of the condyle, and then dividing the distance between these landmarks in half. Vol/FemA largely tracked with Vol/wt and is only included in supplementary table, not in the primary analysis.
4). T2 mapping
The T2 values among different tissues vary normally and can be altered by disease. T2 weighted images provide image contrast based on T2 values. Since the signal intensity in T2 weighted images can vary greatly from patient to patient due to differences in coil sensitivity and MR scanner electronic gains, T2 weighted images are considered qualitative and have limited use for quantitative comparison. In contrast, T2 mapping can provide MR-tissue-specific quantitative T2 values that are scanner independent, allowing direct comparison of T2 values across different subjects. T2 mapping is also suitable for longitudinal comparisons as it is designed for quantifying structural properties such as water and fat. T2 mapping in this study was obtained by applying a MSE-T2 sequence. T2 mapping measurements were then derived by fitting an exponential decay curve to the signal intensity of the corresponding voxels using a linear-least-squares curve-fitting algorithm [29]. In MSE-T2, the intensity of a voxel as a function of echo time is fitted to a monoexponential function f (TEi) = ln [Ii(x,y,z)], where i is an index corresponding to the i-th TE of the MSE-T2 and Ii (x,y,z) is the image intensity for the voxel (x,y,z) in the i-th TE of the MSE-T2. The monomial coefficient from the linear-least-square curve fit was weighted inversely and assigned to each voxel of T2 value map. Because a value of T2 mapping is an inherent property of physical matter, it can be used for comparison across time and subjects. We anticipated increased T2 mapping values in GRMD dogs.
5). Fat Map
We quantified the loss in intensity between intensity-calibrated T2w and T2fs to compute an estimate of the fat signal in each voxel and thus create a Fat Map: Fat Map (x, y, z) = IT2w (x, y, z) – IT2fs (x, y, z). There are limitations to the reliability and variability of the calibration procedure as reported [12]. As an example, manual identification of subcutaneous fat is subject to human rater error and large variability of the fat measures in fat suppression-based MR protocols. Nonetheless, the calibrated Fat Map should reflect gross effects of fat infiltration. We anticipated higher Fat Map values in GRMD dogs.
6). Water Map
Because the fat signals were suppressed in the T2fs, the water signal in each voxel can be simply estimated from the intensity of the voxel in the intensity calibrated T2fs image, allowing us to create a Water Map: Water Map (x, y, z) = IT2FS (x, y, z). The Water Map has similar variability and stability issues as the Fat Map with respect to the expected variance of the calibrated intensity measures [9]; however, it should reflect gross effects of inflammation/edema. We anticipated higher Water Map values in GRMD dogs.
7). Entropy (see supplemental methods for details)
Entropy was calculated as follows: , where M is the number of histogram bins and pi = fi/N, where fi is the number of voxels with an intensity of i and N is the total number of voxels in a volume of interest (VOI). For each feature, we computed the average of all VOIs for each muscle. As Entropy is a histogram marker for heterogeneity, we anticipated higher Entropy in GRMD dogs.
8) Small Lesion Index (SLI)
The SLI is a marker for heterogeneity with 3D spatial information. SLI is a marker for overall patchiness of hyper-intensities, such as scattered small areas of necrosis, and indicates small lesion load. We predicted increased SLI in GRMD dogs.
9). Heterogeneity Index (HI)
HI is another marker for heterogeneity with 3D spatial information. HI is a marker for nonuniformity of run length. A higher value indicates more variably sized, patchy hyper-intense areas. We anticipated increased HI in GRMD dogs.
2.4. Statistical analysis
To quantify the longitudinal characteristics of the seven MRI biomarkers in this natural history study, we adopted a linear mixed model [30]. This model can be written as yij = β0 + β1ageij + β2 groupi + β3ageij × groupi + γ0i + εij, where the subscripts i and j represent the ith subject and the jth time of scan, respectively. We included age, group, and an interaction between age and group as fixed effects and an intercept as a random effect in the model. The yij is a feature of interest such as T2 mapping, ageij is age in days, and groupi is 0 for normal dogs and 1 for affected dogs.
We carried out a likelihood ratio test to examine the significance of age and group effects. After obtaining p-values from the likelihood ratio tests, we corrected for multiple comparisons by using the false discovery rate (FDR) method [31]. In addition, we tested whether two groups showed different patterns over time by testing slope differences to track the longitudinal changes. Specifically, we considered models as the following: yij = β0 + β1ageij + γ0i + εij for normal dogs and yij = (β0+β2) + (β1+β3)ageij + γ0i + εij for GRMD dogs. Therefore, the slopes are β1 and β1+β3 for each group. To test slope difference, we tested the null hypothesis that β3=0.
We used Mann-Whitney-Wilcoxon test [32] to compare normal and GRMD groups for each individual age (at 3, 6, and 9-12 months). This method is more suitable for datasets that contain outliers and does not require any distributional assumption.
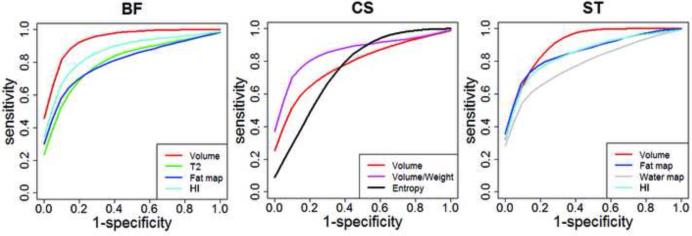
Furthermore, we carried out a linear discriminant analysis (LDA) [33] to separate two groups for each biomarker. More specifically, we used each biomarker, age, and an interaction between biomarker and age as input variables, and the group (GRMD or normal) indicator variable as a response. To examine which biomarker better discriminated the two groups, we calculated sensitivity (probability of correctly identifying a dog as GRMD) and specificity (probability of correctly identifying a dog as Normal). We then created Receiver Operating Characteristic (ROC) curves and generated Area Under Curve (AUC) to investigate the ability of each biomarker to discriminate normal and GRMD groups. For more stable ROC analysis, we applied the bootstrap resampling method with 1000 replications.
Finally, we computed Pearson correlation coefficients between histopathological indices and MRI biomarkers in CS and VL muscles. Only five (3 GRMD and 2 normal) dogs were assessed at 6 months in this preliminary analysis. We used R 3.0.1 software to fit models and perform all analyses[34]. Specifically, we applied the ‘lme4’ package for a linear mixed model and the ‘MASS’ and ‘ROCR’ packages for LDA and ROC analyses.
Results
A total of 45 scans from 10 GRMD dogs and 8 healthy control littermates were performed over a one year period. One each scan from 3-month-old GRMD and control dogs were excluded in data analysis due to technical concerns (T2w intensity was lower than T2fs in the original images). Because outliers were noted in the data, the Wilcoxon test was used for statistical analysis, without an assumption of sample distribution. Supplementary Table 1 includes raw data of eight biomarkers analyzed in seven full length muscles.
3.1 Observational assessment
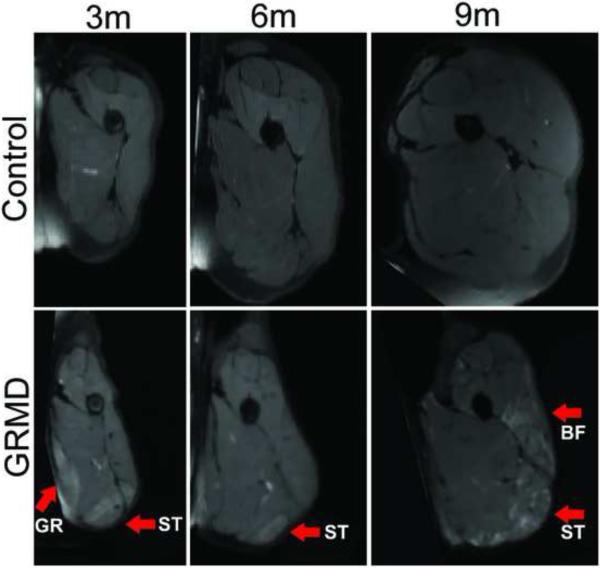
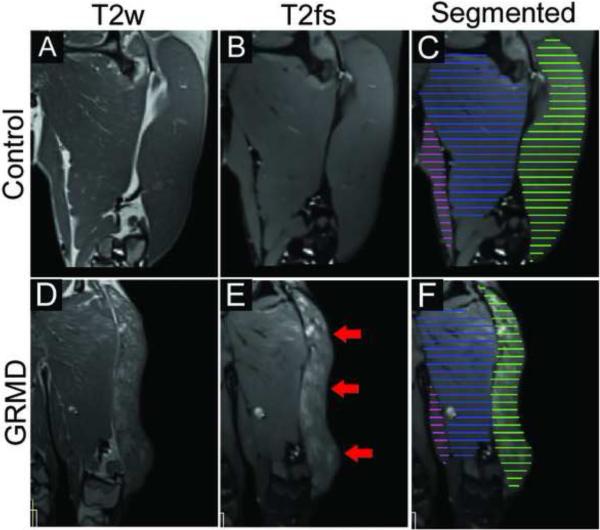
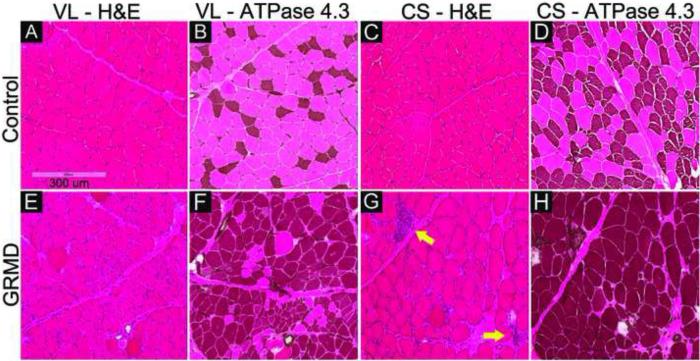
The appearance of muscles on MRI scans of GRMD and normal dogs differed markedly. Muscles of GRMD dogs were generally smaller, more angular, and had greater signal heterogeneity in both T2w and T2fs images. Differences were more pronounced at 6- and 9-12 months of age. Fig. 1 shows an example of progression over time and Fig. 2 shows the marked heterogeneity inter- and intra-muscularly. Typical dystrophic changes were apparent in GRMD dogs at 6 months (Fig. 3).
Fig. 1.
Examples of the mid-femur transverse view of T2 weighted fat suppresed images in a control dog (upper panel) and in a GRMD dog (lower panel) at 3, 6 and 9 months of age. The images are displayed in the same scale, reflecting relative size. The GRMD dog has limited muscle volume growth and muscles are angulated. There are areas of marked intramuscular heterogenenous hyperintensity in GRMD dogs. The arrows indictate severely afffected muscles such as the GR (gracilis), BF (biceps femoris) and ST (semitendinosus).
Fig. 2.
Examples of greater heterogenous hyperintensity on T2 images (without and with fat saturation) in a 9-month-old GRMD dog (lower panel) compared to a control 9-month-old dog (upper panel). BF shows marked intramuscular heterogenity (red arrows) which would be captured only if a full length segementation were used. C and F show the manual segmentation of every 5th slide, which are then interpolated to a full length segmentation (not shown here). AD, adductor, in blue; BF, biceps femoris, ingreen; GR, gracilis, in pink.
Fig. 3.
Muscle biopsy samples of cranial sartorius (CS) and vastus lateralis (VL) of a control dog (A through D) and A GRMD dog (E through H) at 6-months. H&E stains show typical dystrophic lesions in the affected dog (E and G): rounding of fibers, increased perimysial and endomysial connective tissue, increased fiber size variation, and necrotic fibers invaded by macrophages (yellow arrows), in comparison to normal muscle (A and C). Acidic ATPase stain (ATPase at pH 4.3) shows abnormal type I fiber predominance (darkly stained fibers) in the affected dog (F and H), compared to the normal checkerboard pattern of type 1 and type 2 fiber types in control dog (B and D). Myofiber diameters are larger in the CS versus VL GRMD muscles. All images were captured with the same magnification.
3.2 Quantitative assessment
In our previous methodology paper [25], we reported only the mean value of all muscles taken together to provide proof-of-concept that these biomarkers could differentiate affected from control groups. Longitudinal data from individual muscles was not reported in this previous publication [25].
3.2.1. Volumetric biomarkers
Stunting of GRMD dogs could cause muscles to be proportionally smaller. Thus, absolute muscle weights should ideally be corrected by some variable. While body weight has traditionally been used, some reduction in overall body weight also occurs due to the loss of muscle mass secondary to the dystrophic process. Therefore, values corrected for body weight probably under-estimate the degree of muscle involvement. We studied three correction factors for absolute muscle volume: Vol/Wt, Vol/FemL, and Vol/FemA (Supplementary Table 2). Vol/FemA values tracked closely with Vol/Wt, causing concerns that it might also overcorrect for the effects of muscle atrophy. Vol/FemL correlated more consistently with the absolute muscle volumes than the other two values (Supplementary Table 2). We included both Vol/Wt and Vol/FemL in all of our biomarker analysis, but not Vol/FemA.
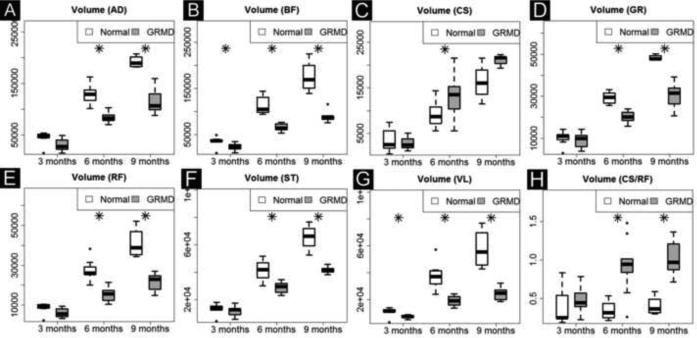
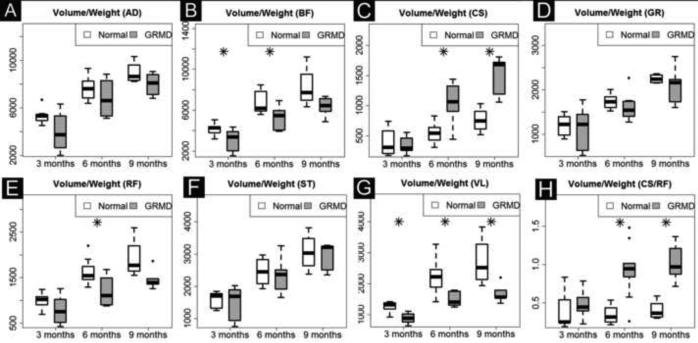
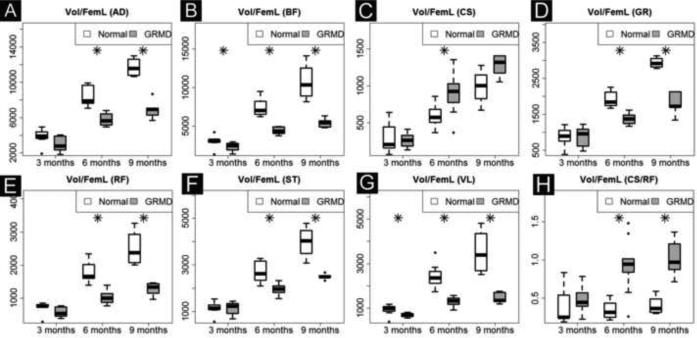
We analyzed the full length volume of seven muscles using an interpolated method (Fig. 2, C and F). Five biomarkers (Volume, Vol/Wt, Vol/FemL, T2 and Water map) showed a strong age effect (Table 2A). GRMD and control dogs had similar muscle volumes at 3 months of age; however, by 6 and 9-12 months, GRMD absolute volume (Fig. 4A and Table 2B), Vol/wt (Fig. 4B and Table 2C) and Vol/FemL (Fig. 4C and Table 2B) were reduced in all but the CS. The muscle volumetric changes were dynamic inter-muscularly and longitudinally. When corrected by body weight, the VL was the only GRMD muscle with significant atrophy at both 6- and 9-12 months; the BF and RF showed significant atrophy at 6-months but not 9-12 months (Fig 4B). On the other hand, all GRMD muscles except the CS, were significantly atrophied at 6- and 9-months (Fig. 4C), when corrected by Vol/FemL. The GRMD CS consistently had higher than normal volumetric measurements for all three methods; all values reached significance at 6 months but only Vol/Wt was significantly different at 9-12 months.
Table 2A.
P value of Testing for Age Effect Between GRMD and Control Cogs.
| Volume | Vol/wt | Vol/FemL | T2 | Fat map | Water map | Entropy | SLI | HI | |
|---|---|---|---|---|---|---|---|---|---|
| AD | 0.0001* | 0.0001* | 0.0000* | 0.0001* | 0.5932 | 0.0058* | 0.1242 | 0.0587^ | 0.0001* |
| BF | 0.0001* | 0.0001* | 0.0000* | 0.0001* | 0.0587^ | 0.0002* | 0.8062 | 0.2879 | 0.0001* |
| CS | 0.0001* | 0.0001* | 0.0000* | 0.0002* | 0.6614 | 0.2199 | 0.1858 | 0.0006* | 0.1223 |
| GR | 0.0001* | 0.0001* | 0.0000* | 0.0001* | 0.6737 | 0.0064* | 0.0006* | 0.0371* | 0.0939^ |
| RF | 0.0001* | 0.0001* | 0.0000* | 0.0001* | 0.6271 | 0.0012* | 0.2272 | 0.1214 | 0.0014* |
| ST | 0.0001* | 0.0001* | 0.0000* | 0.0001* | 0.8772 | 0.0027* | 0.3012 | 0.0566^ | 0.0026* |
| VL | 0.0001* | 0.0001* | 0.0000* | 0.0001* | 0.4241 | 0.0004* | 0.8062 | 0.1140 | 0.0587^ |
Fig. 4A.
Time course of full-length muscle volume change in GRMD and control dogs. GRMD dogs (shaded boxes) have limited muscle mass growth over time; the difference widens in all muscles except CS (C) that shows paradoxical hypertrophy. This difference is also evident when the ratio of CS/RF is plotted (H). AD, adductor magnus; BF, biceps femoris; CS, cranial Sartorius; GR, gracilis; RF, rectus femoris; ST, semitendinosus and VL, vastus lateralis.
* Denotes statistical significance for group difference ( p<0.05 corrected by multiple testing)
Table 2B.
P value of Testing for Group Difference (Adjusted for Age Effect) Between GRMD and Control Cogs
| Volume | Vol/wt | Vol/FemL | T2 | Fat map | Water map | Entropy | SLI | HI | |
|---|---|---|---|---|---|---|---|---|---|
| AD | 0.0001* | 0.1276 | 0.0000* | 0.0001* | 0.0317* | 0.0001* | 0.0002* | 0.0316* | 0.0001* |
| BF | 0.0001* | 0.0086* | 0.0000* | 0.0001* | 0.0001* | 0.0002* | 0.2336 | 0.0008* | 0.0001* |
| CS | 0.0026* | 0.0001* | 0.0015* | 0.0053* | 0.1464 | 0.0040* | 0.0001* | 0.0344* | 0.0483* |
| GR | 0.0001* | 0.8672 | 0.0000* | 0.0001* | 0.0123* | 0.0001* | 0.0001* | 0.0141* | 0.0015* |
| RF | 0.0001* | 0.0104* | 0.0000* | 0.0001* | 0.1043 | 0.0001* | 0.0001* | 0.0156* | 0.0011* |
| ST | 0.0001* | 0.8767 | 0.0000* | 0.0001* | 0.0009* | 0.0001* | 0.0022* | 0.0022* | 0.0001* |
| VL | 0.0001* | 0.0001* | 0.0000* | 0.0020* | 0.0454* | 0.0001* | 0.1217 | 0.0009* | 0.0165* |
Fig. 4B.
Muscle volume corrected by body weight (Vol/Wt). Muscles show differential growth patterns: in GRMD dogs, three muscles (BF, RF, VL) have slower volume growth (B, E and G), three muscles (AD, GR and ST) have similar volume growth (A, D and F), and one muscle (CS) has increased volume growth (C and H) over time. Each muscle volume (mm3) is divided by body weight (kg). AD, adductor magnus; BF, biceps femoris; CS, cranial sartorius; GR, gracilis; RF, rectus femoris; ST, semitendinosus and VL, vastus lateralis.
* Denotes statistical significance for group difference ( p<0.05 corrected by multiple testing).
Table 2C.
Testing for slope difference between GRMD and control dogs.
| Volume | Vol/wt | Vol/FemL | T2 | Fat map | Water map | Entropy | SLI | HI | |
|---|---|---|---|---|---|---|---|---|---|
| AD | 0.0001* | 0.6915 | 0.0000* | 0.5662 | 0.7187 | 0.2862 | 0.9710 | 0.6777 | 0.0224* |
| BF | 0.0001* | 0.4679 | 0.0000* | 0.0840^ | 0.1186^ | 0.1653 | 0.7187 | 0.6915 | 0.0070* |
| CS | 0.0689 | 0.0001* | 0.0038* | 0.7187 | 0.6915 | 0.5662 | 0.1652 | 0.1680 | 0.5430 |
| GR | 0.0001* | 0.9710 | 0.0000* | 0.9644 | 0.7187 | 0.1369^ | 0.1186 | 0.7235 | 0.2053 |
| RF | 0.0001* | 0.4331 | 0.0000* | 0.4778 | 0.7235 | 0.2585 | 0.5633 | 0.3340 | 0.0124* |
| ST | 0.0001* | 0.8960 | 0.0000* | 0.3592 | 0.8960 | 0.0607^ | 0.2330 | 0.1826 | 0.0407* |
| VL | 0.0001* | 0.1186 | 0.0000* | 0.7187 | 0.9644 | 0.6777 | 0.6915 | 0.6009 | 0.1562 |
AD, adductor magnus; BF, biceps femoris; CS, cranial Sartorius; GR, gracilis; RF, rectus femoris; HI, run-length non-uniformity; SLI, short run emphasis; ST, semitendinosus and VL, vastus lateralis.
Note:
denotes p < 0.05 that is false discovery rate (FDR) corrected for multiple testing.
denotes p was <0.05 before corrected by FDR.
Fig. 4C.
Muscle volume corrected by femur length (Vol/FemL). Vol/FemL showes more significnat group and logitudianl differences than Vol/wt. in four muscles: AD (A), BF (B), GR (D) and ST (F). These four muscles are generally quite atrophied in GRMD dogs.
3.2.2. Signal intensity based biomarkers
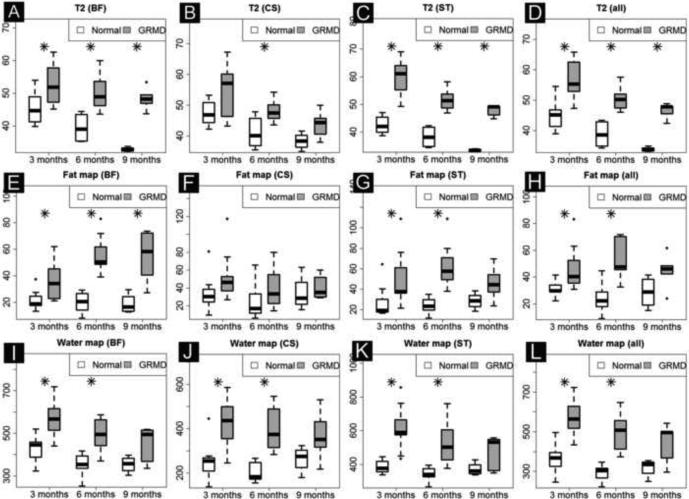
We analyzed three mean intensity based indices: T2 mapping, Fat Map and Water Map. All three indices reliably differentiated GRMD and control muscles in our longitudinal model, except for fat map in CS and RF (Table 2B). Most values for individual muscles were also higher in GRMD dogs at the three different ages (Fig. 4D). Fat and water map values distinguished GRMD from normal dogs more at 3 and 6 months versus 9-12 months of age. However, these indices did not differentiate longitudinal progression in GRMD compared to control dogs. Notable trends were seen in that T2 and Fat Map in BF and water map in GR and ST differed prior to correction with false discovery rate (FDR) (Table 2C).
Fig. 4D.
Intensity based biomarkers in BF, CS and ST (other four muscles are not shown, raw data included in Supplementary Table 1). T2 value consistently differentiates GRMD from control dogs at all three time points and in all muscles (A, B, D) except in CS (B) which undergoes parodoxical hypertrophy. Fat map (E and G) and water map (I and K) values for GRMD and normal dogs were distinghuished more at 3 and 6 months than 9 months of age.
BF, biceps femoris; CS, cranial Sartorius; ST, semitendinosus, and all that includes seven muscles.
* Denotes statistical significance for group difference ( p<0.05 corrected by multiple testing).
3.2.3. Texture analysis biomarkers
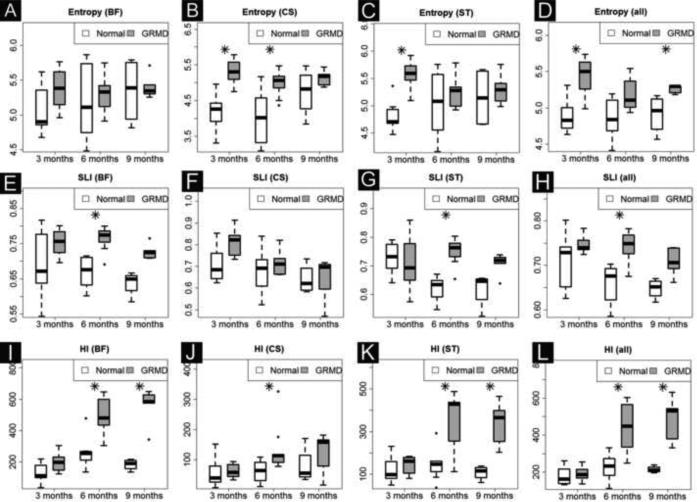
Like other indices, the three texture biomarkers (Entropy, SLI and HI) generally distinguished GRMD from control dogs longitudinally (Table 2B) and at the three ages (Fig. 4E). Values for GRMD dogs were typically higher, especially at 6 months of age. The slope progression for all but HI in the AD, BF, RF and ST muscles did not distinguish the two groups (Table 2C).
Fig. 4E.
Texture biomarkers in three muscles and average of all seven muscles (other four individual muscle data are not shown, but included in Supplementary Table 1). HI best distinguished GRMD and normal dogs longitudinally in two severely affected muscles: BF (I) and ST (K), but not in CS that has paradoxical hypertrophy in GRMD dogs.
All, average of all seven muscles; BF, biceps femoris; CS, cranial Sartorius; HI, Heterogeneity Index, SRI, Small Lesion Index and ST, semitendinosus.
* Denotes statistical significance for group difference (p<0.05 corrected by multiple testing).
3.2.4. Histopathological analysis
Samples of CS and VL collected at 6 months were analyzed in 3 GRMD and 2 control dogs (Table 3). GRMD dogs had evidence of muscle fiber necrosis and regeneration, not seen in control samples. There was also type I fiber preponderance and increased endomysial and perimysial connective tissue in GRMD muscles. GRMD myofiber diameter (measured as minimal Feret's diameter) was increased in CS and decreased in VL. Both GRMD muscles had increased fiber size variability. The degree of fatty deposition was minimal in both groups.
Table 3.
Summary of Histopathological Analysis.
| Muscle | Dog (N) | Necrotic fibers per 1000 fibers | Regenerated fibers per 1000 fibers | Minimum Feret diameter Mean [μM] | Minimum Feret diameter SD [μM] | Type1 fiber % | Connective tissue % of total area |
|---|---|---|---|---|---|---|---|
| CS | Control (2) | 0.6 | 0.2 | 39.2 | 13.6 | 56% | 13% |
| GRMD (3) | 63.3 | 16.2 | 51.5 | 18.4 | 94% | 30% | |
| *Difference (%) | > 100 | > 100 | 31% | 35% | 66% | 128% | |
| VL | Control (2) | none | none | 44.2 | 11.6 | 23% | 14% |
| GRMD (3) | 19.5 | 13.6 | 35.3 | 15.2 | 74% | 23% | |
| *Difference (%) | n/a | n/a | −20% | 31 % | 215% | 59% |
Changes indicate the GRMD compared to control dogs.
3.2.5. Finding the most sensitive and specific biomarkers
All nine biomarkers studied had fairly good sensitivity and specificity to detect group differences (corrected by age affect) between GRMD and normal dogs, with AUC values ranging from 0.599 to 1.000 (Table 4A). For tracking differential longitudinal progression, volume and HI performed best, with changes being most pronounced in the BF and ST (Table 4B, Fig. 5). Tables 5A and 5B show the correlation for MRI biomarkers and histological indices. Notably, the power of the correlation of MRI and histologic biomarkers was limited by the low number of samples assessed in this preliminary study, the fact that only the CS and VL were studied histologically, and the inherently small sample of tissue obtained at biopsy. Several histologic and MRI biomarkers correlated. The highest levels of correlation occurred between volumetric biomarkers and the values for myofiber necrosis and regeneration. Importantly, the correlation was positive for the CS and negative for the VL, reflecting the role that underlying disease has in hypertrophy and atrophy, respectively, in these two muscles. We expected that the intensity and texture biomarkers generally would correlate positively with the histopathologic indices of necrosis and regeneration. However, only the water map values correlated, presumably consistent with inflammation/edema associated with necrosis.
Table 4A.
The AUC for Group Difference Between GRMD and Control Dogs
| Volume | Vol/Wt | Vol/FemL | T2 | Fat map | Water map | Entropy | SLI | HI | |
|---|---|---|---|---|---|---|---|---|---|
| AD | 0.932 | 0.706 | 0.937 | 0.958 | 0.840 | 0.947 | 0.897 | 0.779 | 0.844 |
| BF | 0.956 | 0.816 | 0.959 | 0.917 | 0.939 | 0.908 | 0.643 | 0.884 | 0.917 |
| CS | 0.768 | 0.846 | 0.811 | 0.833 | 0.713 | 0.919 | 0.888 | 0.678 | 0.746 |
| GR | 0.868 | 0.599 | 0.872 | 0.945 | 0.800 | 0.950 | 0.956 | 0.800 | 0.833 |
| RF | 0.939 | 0.807 | 0.940 | 0.998 | 0.711 | 0.969 | 0.932 | 0.739 | 0.695 |
| ST | 0.862 | 0.550 | 0.849 | 1.000 | 0.908 | 0.941 | 0.765 | 0.853 | 0.855 |
| VL | 0.925 | 0.897 | 0.942 | 0.939 | 0.763 | 0.956 | 0.700 | 0.840 | 0.706 |
Table 4B.
The AUC for differential longitudinal progression between GRMD dogs and control dogs
| Volume | Vol/Wt | Vol/FemL | T2 | Fat map | Water map | Entropy | SLI | HI | |
|---|---|---|---|---|---|---|---|---|---|
| AD | 0.916 | 0.578 | 0.920 | 0.630 | 0.571 | 0.669 | 0.610 | 0.571 | 0.844 |
| BF | 0.974 | 0.701 | 0.973 | 0.799 | 0.766 | 0.675 | 0.571 | 0.675 | 0.864 |
| CS | 0.740 | 0.857 | 0.823 | 0.539 | 0.519 | 0.584 | 0.701 | 0.578 | 0.721 |
| GR | 0.877 | 0.539 | 0.901 | 0.494 | 0.584 | 0.656 | 0.669 | 0.643 | 0.773 |
| RF | 0.974 | 0.643 | 0.995 | 0.643 | 0.494 | 0.682 | 0.701 | 0.669 | 0.760 |
| ST | 0.922 | 0.591 | 0.951 | 0.753 | 0.539 | 0.779 | 0.695 | 0.799 | 0.818 |
| VL | 0.968 | 0.779 | 0.933 | 0.610 | 0.552 | 0.565 | 0.558 | 0.584 | 0.747 |
AD, adductor magnus; BF, biceps femoris; CS, cranial Sartorius; GR, gracilis; RF, rectus femoris; HI, heterogeneity index; SLI, small lesion index; ST, semitendinosus and VL, vastus lateralis.
Note: Bold number denotes the biomarker that has the highest AUC among 7 muscles.
Fig. 5.
ROC curve for differential longitudinal progression in GRMD and control dogs. BF, biceps femoris; CS, cranial sartorius; ROC, Receiver Operating Characteristic, and ST, semitendinosus. The biomarkers that have higher ROC values were chosen for graph.
Table 5A.
P values of Correlation of Histopathologic Indices and MRI Biomarkers in Cranial Sartoris (CS) Muscle
| Nec per 1000 | Reg per 1000 | Nec + Reg per 1000 | Minimum Feret mean | Minimum Feret SD | Type1% | Fibrosis% | |
|---|---|---|---|---|---|---|---|
| Volume | 0.088^ | 0.047* | 0.067^ | 0.330 | 0.682 | 0.206 | 0.122 |
| Vol/FemL | 0.092^ | 0.093^ | 0.082^ | 0.250 | 0.581 | 0.117 | 0.134 |
| Vol/FemA | 0.112 | 0.087^ | 0.087^ | 0.347 | 0.551 | 0.300 | 0.156 |
| Vol/wt | 0.022* | 0.036* | 0.017* | 0.246 | 0.432 | 0.146 | 0.051^ |
| T2 | 0.383 | 0.753 | 0.459 | 0.152 | 0.259 | 0.021* | 0.323 |
| Fat map | 0.337 | 0.202 | 0.275 | 0.830 | 0.938 | 0.415 | 0.581 |
| Water map | 0.047* | 0.042* | 0.036* | 0.358 | 0.433 | 0.162 | 0.172 |
| Entropy | 0.445 | 0.429 | 0.452 | 0.498 | 0.359 | 0.039* | 0.468 |
| SLI | 0.228 | 0.470 | 0.260 | 0.266 | 0.355 | 0.071^ | 0.278 |
| HI | 0.678 | 0.691 | 0.675 | 0.712 | 0.861 | 0.966 | 0.718 |
Nec, necrosis; Reg, regeneration; Wt, weight.
denotes p < 0.05
denotes p <0.1 and >0.05.
Table 5B.
P values of Correlation of Histopathologic Indices and MRI Biomarkers in Vastus Lateralis (VL) Muscle
| Nec per 1000 | Reg per 1000 | Nec + Reg per 1000 | Minimum Feret mean | Minimum Feret SD | Type1% | % fibrosis | |
|---|---|---|---|---|---|---|---|
| Volume | 0.012* | 0.047* | 0.025* | 0.330 | 0.577 | 0.064^ | 0.122 |
| Vol/FemL | 0.008* | 0.049* | 0.015* | 0.250 | 0.502 | 0.073^ | 0.134 |
| Vol/FemA | 0.720 | 0.933 | 0.868 | 0.347 | 0.551 | 0.345 | 0.443 |
| Vol/wt | 0.020* | 0.036* | 0.017* | 0.246 | 0.432 | 0.094^ | 0.187 |
| T2 | 0.383 | 0.753 | 0.459 | 0.059^ | 0.916 | 0.082^ | 0.317 |
| Fat map | 0.297 | 0.202 | 0.275 | 0.830 | 0.514 | 0.368 | 0.581 |
| Water map | 0.047* | 0.042* | 0.036* | 0.358 | 0.433 | 0.162 | 0.203 |
| Entropy | 0.500 | 0.429 | 0.452 | 0.498 | 0.470 | 0.766 | 0.701 |
| SLI | 0.961 | 0.680 | 0.881 | 0.266 | 0.355 | 0.547 | 0.587 |
| HI | 0.678 | 0.691 | 0.675 | 0.948 | 0.861 | 0.966 | 0.718 |
denotes p < 0.05
denotes p <0.1 and >0.05.
Discussion
This study focused on defining the natural history of objective MRI changes in muscles of GRMD dogs. We were particularly motivated to identify biomarkers that could be used to distinguish efficacy in preclinical trials over the 3 to 9 month period. Consistent with prior phenotypic studies, pelvic limb conformation seen with MRI was quite different in GRMD dogs because of differential muscle atrophy and hypertrophy. With regard to objective measurements, as reported previously [13], serial interpolation over the entire length of the muscle more accurately predicted effects than mid-muscle belly analysis. Consistent with our prior pathologic studies [35], GRMD dogs showed markedly progressive absolute muscle volume loss in six of the seven muscles studied, with the only exception being the CS, which undergoes paradoxical hypertrophy in CS [21] (Fig. 4A). With regard to a correction factor to account for GRMD stunting, values corrected for femur length most consistently tracked with absolute muscle weights. Body weight and femur cross sectional area corrections tracked closely and did not correlate as well with absolute values. We believe these two correction methods may over correct for the effects of muscle size, given that atrophy likely contributes to the reduction in body weight and may also influence cross sectional femur area.
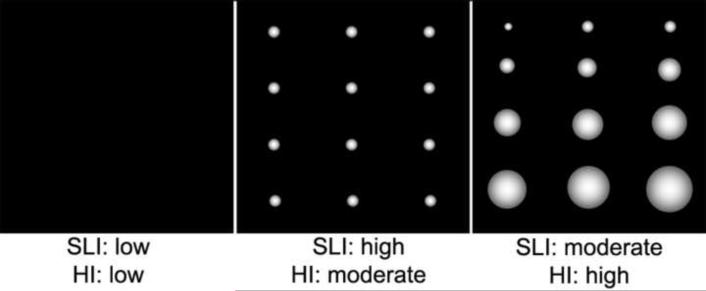
GRMD muscles were also distinguished by areas of increased hyperintensity on T2fs images. This change probably reflects edema associated with inflammation. GRMD dogs demonstrate remarkable deterioration over the 3 to 6 month period, as reflected by marked functional and pathologic changes [7]. While MRI changes identified in this study were dynamic across time within and among muscles, they were more prominent in the BF and ST. Yokota et al showed that T2w intensities were increased in GRMD versus normal dogs and restored with exon skipping treatment [11]. Walter et al also showed that T2 values are normalized after gene therapy in murine models of muscular dystrophy [36]. While T2 values clearly distinguished GRMD from normal dogs in our study, they also declined with age in both groups. Thus, this age effect must be considered when designing future therapeutic trials. In principle, higher T2 values could occur due to either increased water acutely or fat more chronically. We anticipated that Fat Map and Water Map derived from T2w and T2fs sequences would allow us to define the relative contributions of these corresponding histopathologic changes. However, the instability of the necessary intensity calibration limits their usefulness in tracking longitudinal changes [20]. Texture analysis adds 3D spatial information to intensity properties; SLI and HI capture different features of heterogeneity, as shown schematically in Fig. 6. These markers could be of particular value, given the known heterogeneity of dystrophic changes inter- and intra- muscularly. Other markers rely on mean values, which cancel out the range of intensities that occur with lesion heterogeneity. HI showed promise as a biomarker to track disease progression, particularly in the BF, ST, AD and RF muscles (Table 2C).
Fig. 6.
Diagram for texture heterogeneity markers: SLI and HI.
SLI is intended to detect small lumps of voxels with similar signal intensity. HI is intended to reflect the variable sizes of lumps of voxels with similar signal intensity. Both are calculated in 3D matrix
We were especially interested in finding changes that could be tracked longitudinally in the context of preclinical trials. Some of the MRI biomarkers in this study showed more pronounced group and age differences at 6 versus 9-12 months of age. This was also noted by Thibaud et al [10] and is in keeping with more severe disease progression over the 3 to 6 month period. While changes at 9 months are inherently more chronic, dogs are still too young to show marked fibrosis and fatty change that would be reflected on MRI. Taken together, our findings suggest MRI can be used as an outcome parameter to document longitudinal disease progression or response to therapy over the 3 to 6 month window that we have previously used for preclinical studies [7].
Ideally, MRI changes should correlate with histopathological changes. We are systematically assessing our histopathologic data through another study in which additional functional biomarkers will be correlated. Here, we present for the first time, preliminary correlative histopathologic data from GRMD dogs. Notably, our ability to correlate MRI and histologic biomarkers was limited by the low number of dogs assessed in this preliminary study, the fact that only the CS and VL were studied histologically, and the inherently small sample of tissue obtained at biopsy. With this said, the histopathologic data presented here provide a valuable glimpse at the ability of MRI to correlate with underlying lesions. In general, the multifocal histopathologic lesions of necrosis and regeneration, fibrosis, and type 1 fiber preponderance seen in GRMD dogs of this report are similar to those reported previously and in keeping with changes seen DMD [27,28]. Most muscles were atrophied, with the notable exception of the CS, which undergoes paradoxical hypertrophy. Fatty change was much less pronounced in GRMD than in DMD, in part because of the dogs’ relatively young age of 6 months. The high correlation between volumetric biomarkers and values for myofiber necrosis and regeneration probably reflects the broad impact of muscle disease on muscle size. This was borne out by the fact that the correlation was positive for the CS and negative for the VL, in keeping with the atrophy and hypertrophy, that occur in these muscles at 6 months of age [21]. Water map and necrosis indices correlated significantly, most likely reflecting edema associated with necrosis. The somewhat surprising lack of correlation between texture analysis biomarkers and histological features probably reflects fundamental scale differences. Texture analysis is done at the macro level (minimal unit of voxel is 1×1×1 mm3), while histopathological data are micro (in the scale of ~50 um for fiber diameter). Thus, each pixel of 1x1 mm2 holds ~ 400 myofibers in cross section. We believe that MRI biomarkers and histopathologic biomarkers are complimentary; MRI biomarkers may be capable of detecting macro scale pathological changes non-invasively, while histologic assessment offers microscopic scale information reflecting underlying pathogenesis at the cellular level. We are now conducting much larger scale histopathologic analysis on muscle whole mounts from necropsy samples and believe these values will better correlate with texture features.
This study and the field, in general, are hampered by lack of automated muscle segmentation methods. The interpolation method utilized in these dogs facilitated collection of data more representative of the whole muscle than traditional mid-muscle analysis. We are also working on an automated segmentation method that should substantially advance muscle MRI assessment.
5. Conclusions
MRI biomarkers are able to consistently differentiate group differences and some also track with differential longitudinal progression in GRMD. These MRI biomarkers have the potential to be used as non-invasive, objective surrogate biomarkers for future therapeutic trials. The best biomarkers should both distinguish disease group differences and also track differential longitudinal changes adjusted for age effect. In this study, we found that muscle volume and HI best distinguished longitudinal progression between GRMD and normal dogs; the BF, ST and CS muscles had the most consistent changes; and longitudinal changes over the 3 to 6 month period were more pronounced than those from 6 to 9 months. Our ongoing research is directed at extending these results via further histopathological validation and functional correlation.
Supplementary Material
Table 6.
Summary of MRI Biomarkers That Best Track Longitudinal Progression in GRMD Dogs.
| Volume | Vol/wt | Vol/FemL | T2 | Fat map | Water map | Entropy | SLI | HI | |
|---|---|---|---|---|---|---|---|---|---|
| BF | √ | √ | √ | √ | √ | ||||
| CS | √ | √ | √ | ||||||
| ST | √ | √ | √ | √ | √ |
BF, biceps femoris; CS, cranial sartorius; HI, heterogeneity index; SLI, small lesion index; ST, semitendinosus.
Acknowledgements
This work was supported by National Institutes of Health Grant Nos. R42 NS059095-03 (NINDS) (Styner), P30-HD003110-41 (NICHD) (Styner) and 1U24NS059696-01A1 (NINDS) (Kornegay), the Muscular Dystrophy Association (Kornegay), Wellstone center for Muscular Dystrophy Research [USPHS (NIAMS) 1U54AR056953-01], The North Carolina Translational and Clinical Sciences (NC TraCS) Institute [Tracs50K (50KR71104)] (Fan) and UNC Intellectual and Developmental Disabilities Research Center[P30 HD03110]. The authors thank Janet and Dan Bogan and Jennifer Dow for technical assistance in managing the dogs.
References
- 1.Cheung JY, et al. Calcium and ischemic injury. N Engl J Med. 1986;314(26):1670–6. doi: 10.1056/NEJM198606263142604. [DOI] [PubMed] [Google Scholar]
- 2.Edwards RH, et al. Role of mechanical damage in pathogenesis of proximal myopathy in man. Lancet. 1984;1(8376):548–52. doi: 10.1016/s0140-6736(84)90941-3. [DOI] [PubMed] [Google Scholar]
- 3.Hoffman EP, Brown RH, Jr., Kunkel LM. Dystrophin: the protein product of the Duchenne muscular dystrophy locus. Cell. 1987;51(6):919–28. doi: 10.1016/0092-8674(87)90579-4. [DOI] [PubMed] [Google Scholar]
- 4.Bulfield G, et al. X chromosome-linked muscular dystrophy (mdx) in the mouse. Proc Natl Acad Sci U S A. 1984;81(4):1189–92. doi: 10.1073/pnas.81.4.1189. [DOI] [PMC free article] [PubMed] [Google Scholar]
- 5.Cooper BJ, et al. The homologue of the Duchenne locus is defective in X-linked muscular dystrophy of dogs. Nature. 1988;334(6178):154–6. doi: 10.1038/334154a0. [DOI] [PubMed] [Google Scholar]
- 6.Kornegay JN, et al. Muscular dystrophy in a litter of golden retriever dogs. Muscle Nerve. 1988;11(10):1056–64. doi: 10.1002/mus.880111008. [DOI] [PubMed] [Google Scholar]
- 7.Kornegay JN, et al. Canine models of Duchenne muscular dystrophy and their use in therapeutic strategies. Mamm Genome. 2012;23(1-2):85–108. doi: 10.1007/s00335-011-9382-y. [DOI] [PMC free article] [PubMed] [Google Scholar]
- 8.Brooke MH, et al. Clinical trial in Duchenne dystrophy. I. The design of the protocol. Muscle Nerve. 1981;4(3):186–97. doi: 10.1002/mus.880040304. [DOI] [PubMed] [Google Scholar]
- 9.Kobayashi M, et al. Evaluation of dystrophic dog pathology by fat-suppressed T2-weighted imaging. Muscle Nerve. 2009;40(5):815–26. doi: 10.1002/mus.21384. [DOI] [PubMed] [Google Scholar]
- 10.Thibaud JL, et al. Comprehensive longitudinal characterization of canine muscular dystrophy by serial NMR imaging of GRMD dogs. Neuromuscul Disord. 2012;22:S85–S99. doi: 10.1016/j.nmd.2012.05.010. [DOI] [PubMed] [Google Scholar]
- 11.Yokota T, et al. Efficacy of systemic morpholino exon-skipping in duchenne dystrophy dogs. Ann Neurol. 2009 doi: 10.1002/ana.21627. [DOI] [PMC free article] [PubMed] [Google Scholar]
- 12.Le Guiner C, et al. Effctive limb transduction and pehotypic correcton after injection of rAAV8-U7 snRNA in GRMD dogs. Mol Ther. 2011;19(S29):S29. [Google Scholar]
- 13.Wang J, et al. A computerized MRI biomarker quantification scheme for a canine model of Duchenne muscular dystrophy. Int J Comput Assist Radiol Surg. 2013 doi: 10.1007/s11548-012-0810-6. [DOI] [PMC free article] [PubMed] [Google Scholar]
- 14.Childers MK, et al. Myofiber injury and regeneration in a canine homologue of Duchenne muscular dystrophy. Am J Phys Med Rehabil. 2001;80(3):175–81. doi: 10.1097/00002060-200103000-00004. [DOI] [PubMed] [Google Scholar]
- 15.Engel A. Myology. 3rd ed. 3 edition McGraw-Hill Professional; 2004. 1960. [Google Scholar]
- 16.Schneider CA, Rasband WS, Eliceiri KW. NIH Image to ImageJ: 25 years of image analysis. Nat Methods. 2012;9(7):671–5. doi: 10.1038/nmeth.2089. [DOI] [PMC free article] [PubMed] [Google Scholar]
- 17.Briguet A, et al. Histological parameters for the quantitative assessment of muscular dystrophy in the mdx-mouse. Neuromuscul Disord. 2004;14(10):675–82. doi: 10.1016/j.nmd.2004.06.008. [DOI] [PubMed] [Google Scholar]
- 18.Hennig J, Weigel M, Scheffler K. Multiecho sequences with variable refocusing flip angles: optimization of signal behavior using smooth transitions between pseudo steady states (TRAPS). Magn Reson Med. 2003;49(3):527–35. doi: 10.1002/mrm.10391. [DOI] [PubMed] [Google Scholar]
- 19.Hennig J, Speck O, Scheffler K. Optimization of signal behavior in the transition to driven equilibrium in steady-state free precession sequences. Magn Reson Med. 2002;48(5):801–9. doi: 10.1002/mrm.10274. [DOI] [PubMed] [Google Scholar]
- 20.Wang J, et al. MRI-based quantification of Duchenne muscular dystrophy in a canine model. proceedings of SPIE Medical Imaging: Biomedical Applications in Molecular, Structural, and Functional Imaging. 2011;7965:79650G1–7965G9. [Google Scholar]
- 21.Kornegay JN, et al. The cranial sartorius muscle undergoes true hypertrophy in dogs with golden retriever muscular dystrophy. Neuromuscul Disord. 2003;13(6):493–500. doi: 10.1016/s0960-8966(03)00025-7. [DOI] [PubMed] [Google Scholar]
- 22.Yushkevich PA, et al. User-guided 3D active contour segmentation of anatomical structures: significantly improved efficiency and reliability. Neuroimage. 2006;31(3):1116–28. doi: 10.1016/j.neuroimage.2006.01.015. [DOI] [PubMed] [Google Scholar]
- 23.Wang J, et al. Enhanced Atlas Selection for Multi-Atlas Segmentation with Application to Leg Muscle MRI. MICCAI 2012 Workshop on Multi-atlas Labeling. 2012 2012. [Google Scholar]
- 24.Wang J, et al. Statistical texture analysis based MRI quantification of Duchenne muscular dystrophy in a canine model. Proceedings of SPIE Medical Imaging: Biomedical Applications in Molecular, Structural, and Functional Imaging. 2013 In press. [Google Scholar]
- 25.Wang J, et al. A computerized MRI biomarker quantification scheme for a camine model of Duchenne muscular dystrophy. International Journal of Computer Assisted Radiology and Surgery. 2013 doi: 10.1007/s11548-012-0810-6. in print(in print) [DOI] [PMC free article] [PubMed] [Google Scholar]
- 26.Galloway M. Texture analysis Using Gray Level Run Lengths. Computer Graphics and Image Processing. 1975;4(4):172–179. [Google Scholar]
- 27.Herlidou S, et al. Comparison of automated and visual texture analysis in MRI: characterization of normal and diseased skeletal muscle. Magn Reson Imaging. 1999;17(9):1393–7. doi: 10.1016/s0730-725x(99)00066-1. [DOI] [PubMed] [Google Scholar]
- 28.Mahmoud-Ghoneim D, et al. Texture analysis of magnetic resonance images of rat muscles during atrophy and regeneration. Magn Reson Imaging. 2006;24(2):167–71. doi: 10.1016/j.mri.2005.10.002. [DOI] [PubMed] [Google Scholar]
- 29.Kim HK, et al. T2 mapping in Duchenne muscular dystrophy: distribution of disease activity and correlation with clinical assessments. Radiology. 2010;255(3):899–908. doi: 10.1148/radiol.10091547. [DOI] [PubMed] [Google Scholar]
- 30.Laird NM, Ware JH. Random-effects models for longitudinal data. Biometrics. 1982;38(4):963–74. [PubMed] [Google Scholar]
- 31.Benjamini Y, Hochberg Y. Controlling the false discovery rate: a practical and powerful approach to multiple testing. Journal of the royal statistical society, Series B. 1995;57(1):289–300. [Google Scholar]
- 32.Mann H, Whitney D. On a Test of Whether one of Two Random Variables is Stochastically Larger than the Other. Annals of Mathematical Statistics. 1941;18(1):50–60. [Google Scholar]
- 33.Fisher RA. The Statistical Utilization of Multiple Measurements. Annals of Eugenics. 1938;8(4):376–386. [Google Scholar]
- 34.R Core Team R: A language and environment for statistical computing. 2004 2013 Available from: http://www.R-project.org/
- 35.Kornegay JN, et al. The paradox of muscle hypertrophy in muscular dystrophy. Phys Med Rehabil Clin N Am. 2012;23(1):149–72. xii. doi: 10.1016/j.pmr.2011.11.014. [DOI] [PMC free article] [PubMed] [Google Scholar]
- 36.Walter G, et al. Noninvasive monitoring of gene correction in dystrophic muscle. Magn Reson Med. 2005;54(6):1369–76. doi: 10.1002/mrm.20721. [DOI] [PubMed] [Google Scholar]
Associated Data
This section collects any data citations, data availability statements, or supplementary materials included in this article.


