

Abstract
Quantitatively characterizing the development of cortical anatomical networks during the early stage of life plays an important role in revealing the relationship between cortical structural connection and high‐level functional development. The development of correlation networks of cortical‐thickness, cortical folding, and fiber‐density is systematically analyzed in this article to study the relationship between different anatomical properties during the first 2 years of life. Specifically, longitudinal MR images of 73 healthy subjects from birth to 2 year old are used. For each subject at each time point, its measures of cortical thickness, cortical folding, and fiber density are projected to its cortical surface that has been partitioned into 78 cortical regions. Then, the correlation matrices for cortical thickness, cortical folding, and fiber density at each time point can be constructed, respectively, by computing the inter‐regional Pearson correlation coefficient (of any pair of ROIs) across all 73 subjects. Finally, the presence/absence pattern (i.e., binary pattern) of the connection network is constructed from each inter‐regional correlation matrix, and its statistical and anatomical properties are adopted to analyze the longitudinal development of anatomical networks. The results show that the development of anatomical network could be characterized differently by using different anatomical properties (i.e., using cortical thickness, cortical folding, or fiber density). Hum Brain Mapp 35:3726–3737, 2014. © 2013 Wiley Periodicals, Inc.
Keywords: cortical development, early brain development, anatomical network, cortical folding
INTRODUCTION
Human brain could be characterized as a complex anatomical and functional network development over the whole life [Achard et al., 2006; Eguiluz et al., 2005; Salvador et al., 2005; Sporns et al., 2004; Stam, 2004; Stam et al.,2007]. Quantitative characterization of cortical network development during the early postnatal stage of life plays an important role in revealing the relationship between cortical structural connection and high‐level functional development [Nie et al., 2012a].
The functional network in human brain has been explored extensively using electroencephalogram [Micheloyannis et al., 2006; Stam et al., 2007], magnetoencephalographic recordings [Stam, 2004], and functional magnetic resonance imaging (fMRI) [Achard et al., 2006; Eguiluz et al., 2005; Gao et al., 2011; Salvador et al., 2005]. The small‐world property [Watts and Strogatz, 1998], which indicates that most nodes in the network are not neighbors of one another, but can be reached from every other by a small number of hops or steps, has been found in the functional network of the adult brain [Achard et al., 2006; Eguiluz et al., 2005; Salvador et al., 2005]. In the recent fMRI study [Gao et al., 2011], the small‐world topology is also identified in the newborn brain, along with longitudinal functional network development.
Meanwhile, the network of anatomical connections in the human brain has also been studied recently [Gong et al., 2009a; 2012; He et al., 2007; Sporns et al., 2005; Fan et al., 2011; Wee et al., 2011; Zhu et al., 2011]. The correlations of cortical thickness across individuals from different regions have been measured and formed as structural connections [He et al., 2007; Sporns et al., 2005; Shi et al., 2013]. The anatomical connections could also be estimated by regional diffusion‐based anatomical connectivity using probabilistic tractography [Gong et al., 2009a, 2012; Shi et al., 2012a]. In these studies, the small‐world property has been identified in both cortical‐thickness correlation network and fiber connection network. Though the thickness correlation network and fiber connection network show certain convergence, the difference existed in the two networks suggests that they can only represent part of anatomical network [Gong et al., 2012].
During the brain development, the biological mechanisms underlying the development of the cortical thickness, cortical folding, and fiber connections remain largely unclear. Serveral hypotheses have been proposed to explain the relationship between these anatomical properties [Nie et al., 2012b; Passingham et al., 2002; Van Essen, 1997]. The fiber connection is considered as the key factor determining the folding of the cortex, and the thickness difference between gyrus and sulcus is considered as a result of cortical folding [Van Essen, 1997]. In a recent study, the long‐range fiber connections are found concentrated on the gyri, which also indicates that the fiber connection might be highly correlated with cortical folding [Nie et al., 2012b].
Since the cortical thickness, cortical folding, and fiber density may show essential relationship during early brain development [Van Essen, 1997; Nie et al., 2012b], the development of their respective anatomical networks are systematically compared in this study, to investigate the relationship between different anatomical properties during the first 2 years of life. Specially, the longitudinal MR images of 73 healthy subjects from birth to 2 year old are used, and for each subject at each time point its cortical thickness, cortical folding, and fiber density are first projected to its inner cortical surface that has been parcellated into 78 regions of interest (ROI). Then, the correlation matrices for cortical thickness, cortical folding, and fiber density at each time point can be constructed, respectively, by computing the inter‐regional Pearson correlation coefficient of any pair of ROIs across subjects. Finally, the presence/absence pattern (i.e., binary pattern) of connection network is constructed from each inter‐regional correlation matrix, and its statistical and anatomical properties, especially the small‐world property and connectivity distribution using graph theoretical analysis, are adopted to analyze the longitudinal development of anatomical network. The results show that the development of anatomical network could be characterized differently by using different anatomical properties (i.e., using cortical thickness, cortical folding, or fiber density).
MATERIALS AND METHODS
Datasets and Image Preprocessing
T1 and T2 MR images of 73 healthy subjects were acquired longitudinally at birth, 1 year old, and 2 year old, and diffusion‐weighted images of 37 healthy subjects (a subset from the same 73 subjects) were acquired at 1 year old and 2 year old. The imaging parameters for T1 images (with 160 axial slices) are as follows: TR = 1900 ms, TE = 4.38 ms, flip angle = 7, acquisition matrix = 256 × 192, and voxel resolution = 1 × 1 × 1 mm3. The imaging parameters for T2 images (with 70 axial slices) are as follows: TR = 7380 ms, TE = 119 ms, flip angle = 150, acquisition matrix = 256 × 128, and voxel resolution = 1.25 × 1.25 × 1.95 mm3. And the imaging parameters for diffusion weighted images (with 60 axial slices) are as follows: TR/TE = 7680/82 ms, matrix size = 128 × 96, 42 noncollinear diffusion gradients, and diffusion weighting b = 1000 s/mm2. T2 image is linearly aligned onto the respective T1 image of the same subject, and further resampled to 1 × 1 × 1 mm3. Fractional anisotropy (FA) image is reconstructed from the DTI image and then aligned onto the warped T2 image of the same subject, and further resampled to 1 × 1 × 1 mm3. For each set of the aligned T1 and T2 images, the skull stripping is first performed to remove noncerebral tissues [Shi et al., 2012b], and also the cerebellum and brain stem are further removed semi‐automatically by a trained rater. The combined T1 and T2 image information is used to segment the brain image into gray matter, white matter (WM), and cerebrospinal fluid regions [Wang et al., 2011].
After topology correction of WM volume, the inner and outer cortical surfaces were reconstructed and represented by the triangular meshes, composed of a set of vertices and triangles [Liu et al., 2008]. As the transient subplate zone, which is interposed between the immature cortical plate and WM, may still exists at birth, the inner cortical surface at birth is defined as the interface between the cortex plate and WM zone (including WM and transient subplate zone). Using an infant version [Shi et al., 2010] of the automated anatomical labeling template [Tzourio‐Mazoyer et al., 2002], the cortical surfaces were parcellated into 78 ROIs by a high‐dimensional nonlinear hybrid (volumetric/surface) registration method [Liu et al., 2004; Shen and Davatzikos, 2002].
Measurement of Cortical Thickness, Cortical Folding, and Fiber Density
Cortical thickness
Cortical thickness was measured in the native space using the shortest distance between inner and outer cortical surfaces at each vertex [Li et al., 2012]. For each subject, regional cortical thickness was defined as the average thickness of all vertices belonging to the same ROI. A linear regression analysis was performed at every cortical region of each age to remove the effects of multiple confounding variables: gender and overall mean cortical thickness [He et al., 2007]. The residual of the regression was treated as the raw cortical thickness value of each ROI.
Cortical folding
Several quantitative methods for measuring cortical folding have been proposed in the literature. For example, the traditional gyrification index was first proposed by Zilles et al. [1988] to measure the cortical folding in a 2D slice, and recently extended to the 3D local gyrification by measuring the cortical surface area in a sphere [Schaer et al., 2008; Toro et al., 2008]. Meanwhile, curvature‐based methods have also been proposed to measure the complexity of the cortical folding especially in the developing brain [Pienaar et al., 2008; Rodriguez‐Carranza et al., 2007; Nie et al., 2010]. Recent comparison on the curvature‐based measurement and the gyrification index [Rodriguez‐Carranza et al., 2007] also shows that these two types of measurements perform similarly on inner cortical surfaces. In this paper, the curvedness [Koenderink and Vandoorn, 1992; Nie et al., 2012a] of the inner cortical surface was adopted to characterize the local change of the cortical folding. For each subject, regional cortical folding was defined as the average curvedness of all vertices belonging to the same ROI. Similarly, a linear regression analysis was performed at every cortical region of each age to remove the effects of multiple confounding variables: gender and overall mean cortical curvedness. The residual of the regression was treated as the raw cortical curvedness value of each ROI.
Fiber density
In previous studies [Gong et al., 2012, 2009a], fiber connection network was constructed using the DTI tractography method, in which the connection between two ROIs is directly defined as the fiber connection between these two ROIs. However, the fiber connection network has certain essential difference with anatomical correlation networks, especially that the negative correlation relationship cannot be well defined in the fiber connection networks [Gong et al., 2012]. Thus, the fiber density [Nie et al., 2012a], which is defined on the cortical surface, could be adopted to construct the correlation network that measures the fiber connection information. Specifically, to measure the fiber density on cortical surface, axonal fibers were first reconstructed via the streamline tractography method [Mori et al., 1999; Mori and van Zijl, 2002; Stieltjes et al., 2001], during which the FA threshold was set as 0.3. However, the fiber could be either outside the inner cortical surface if the gray matter is over‐segmented, or inside the inner cortical surface if the gray matter is under‐segmented as shown in Figure 1a. Hence, in order to use the fiber connection information on the cortex, we project the fibers onto the inner cortical surface as follows. If the end point of a fiber lies outside the cortex, we search along the fiber backwards the inner cortical surface (i.e., fiber 2 in Fig. 1a). Otherwise, we extend the fiber towards the inner cortical surface (i.e., fiber 1 in Fig. 1a). The searching process stops either when the fiber arrives at the surface, or exceeds a searching threshold (20 mm). In the very rare cases when a fiber cannot reach the surface, we treat this fiber as an outlier and remove it from the data. The fiber density could be defined as the number of fibers connected to a unit area (mm2) of cortical surface. An example of fiber density on a cortical surface is shown in Figure 1b. Similarly, a linear regression analysis was also performed at every cortical region of each age to remove the effects of multiple confounding variables: gender and overall mean cortical fiber density.
Figure 1.
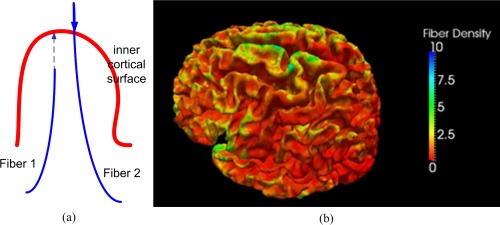
An example of (a) the projected fibers and (b) computed fiber density on a cortical surface. [Color figure can be viewed in the online issue, which is available at http://wileyonlinelibrary.com.]
Construction of Cortical‐Thickness, Cortical Folding, and Fiber‐Density Correlation Networks
The construction of the anatomical connection matrix is the key issue in characterizing human brain network [Sporns et al., 2005]. In this study, the anatomical connection as statistical associations in cortical thickness between brain regions was defined similarly as in the previous studies [Gong et al., 2012; Lerch et al., 2006; Worsley et al., 2005]. Specifically, the statistical similarity between two brain regions was measured by computing the inter‐regional Pearson correlation coefficient of cortical thickness across 73 subjects. In this way, the inter‐regional symmetric correlation matrices (78 × 78) of cortical‐thickness network can be constructed for neonate, 1 year old, and 2 year old, respectively, as shown in Figure 2a–c. Similarly, the correlation matrices for cortical curvedness can also be computed for three different time points, as shown in Figure 2d–f. Finally, the inter‐regional symmetric correlation matrices (78 × 78) of fiber‐density network were similarly constructed by calculating the Pearson correlation coefficients of fiber density of any pair of regions across 37 subjects, with respective results for 1 year old and 2 year old, shown in Figure 2g–h.
Figure 2.
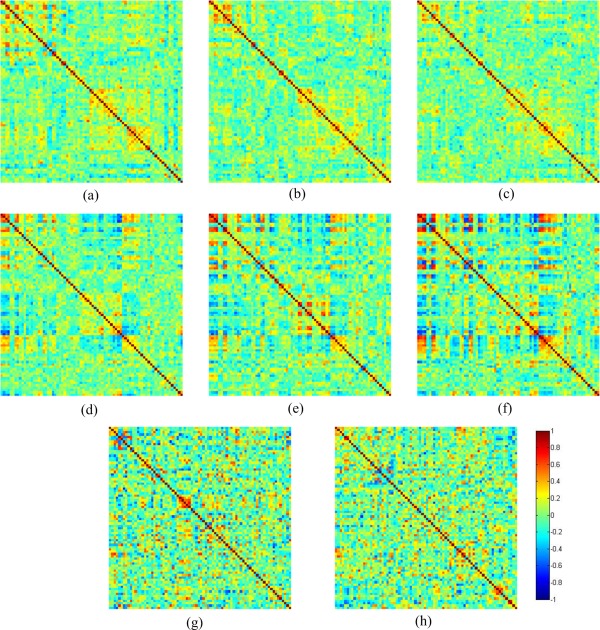
The cortical‐thickness correlation matrices for (a–c) neonate, 1 year old, and 2 year old. The curvedness correlation matrices for (d–f) neonate, 1 year old, and 2 year old. The fiber‐density correlation matrices for (g,h) 1 year old and 2 year old. [Color figure can be viewed in the online issue, which is available at http://wileyonlinelibrary.com.]
Comparison of Correlation Networks
The above processing results in multiple 78 × 78 symmetric correlation matrices for neonate, 1 year old, and 2 year old. For conceptual simplicity, our present study will focus on a presence/absence pattern (i.e., binary pattern) of connections. Similar to the previous studies [Achard and Bullmore, 2007; Bassett et al., 2008; Gong et al., 2012], we employed a sparsity‐based thresholding approach, where the sparsity was defined as the ratio of the number of actual connections to the number of possible connections (78(78−1)/2 = 3003) within the network. Specifically, we applied the same sparsity threshold to all matrices, ensuring the same number of supra‐threshold regional pair. As there is no definitive choice for a single threshold, we identified a thresholding range for yielding a fully connected cortical network with a small‐world topology, as previously proposed by Bassett et al. [2008].
To compare the convergence of two networks, we calculated the percentage of convergence (PC) via dividing the number of convergent regional pairs ( ) by the number of all supra‐threshold regional pairs ( ):
where the PC is defined as the function of sparsity. As the same sparsity threshold is applied to both networks, the number of all supra‐threshold regional pairs is identical for both networks.
Comparison of Network Topological Properties
Previous studies have demonstrated the small‐world topology of both diffusion and thickness correlation networks, characterized by highly efficient information transfer both locally and globally [Gong et al., 2009a; He et al., 2007; Iturria‐Medina et al., 2008]. The small‐world topology was originally proposed by using two classic graph parameters: clustering coefficient and characteristic path length (Watts and Strogatz, 1998]. This concept was then generalized by introducing network efficiency that has a number of conceptual and technical advantages [Achard and Bullmore, 2007]. Conceptually, the local clustering C and characteristic path length L correspond to the local and global efficiency of the network, respectively. Here, the network global efficiency is defined as the inverse of the harmonic mean of shortest path length ( ) between each pair of nodes within the network:
High global efficiency indicates better communication within the networks. Meanwhile, the local efficiency represents how much the complex network is fault‐tolerant, indicating how well the information is communicated within the neighbors of a given node when this node is removed [Gong et al., 2012]. Here, the local efficiency for each node could be calculated as the global efficiency of the neighborhood subgraph of the node. Then, the local efficiencies across all nodes within the network are further averaged to estimate the network local efficiency:
In the study of functional network, a small number of regions (hubs) with an unusually large number of connections have been identified [Eguiluz et al., 2005]. Usually, the nodes with the smallest mean shortest path length, or the largest degree (number of connections to the node), were considered as the hubs of the network [Achard et al., 2006]. As described by Gong et al. [2009b], to measure the connections of each node ( ), the regional efficiency E r(i) is defined as
Thus the regions were identified as the hubs in correlation networks if their regional efficiency was at least one standard deviation (STD) greater than the average regional efficiency of the network.
RESULTS
The Development of Correlation Matrices
The changes of correlation matrices can directly reflect the development of different anatomical properties. As can be seen from Figure 2a–c, the cortical‐thickness correlation matrices at different ages show similar patterns but with decreasing overall absolute correlation value. On the contrary, the curvedness correlation matrices show the increasing overall absolute correlation value with even more similar connection patterns as shown in Figure 2d–f). However, as indicated in Figure 2g–h, the fiber‐density correlation matrices show less similarity between 1‐ and 2 year old, compared to the respective cortical‐thickness or curvedness correlation network.
The Development of Network Topological Properties
The developments of global and local efficiency on cortical‐thickness, curvedness, and fiber‐density correlation networks at each year are shown in Figure 3 by different color curves. The changes of the global efficiency in cortical‐thickness correlation networks is nonsignificant as shown in Figure 3a, and the local efficiency in cortical‐thickness correlation networks decreases during the brain development after birth as shown in Figure 3b. The developmental pattern of the global and local efficiency in the fiber‐density correlation networks, as shown in Figure 3e and f, respectively, is similar to that of the cortical‐thickness correlation networks. On the contrary, the local efficiency in the curvedness correlation networks increases during the brain development after birth, as shown in Figure 3d, whereas the global efficiency decreases as shown in Figure 3c.
Figure 3.
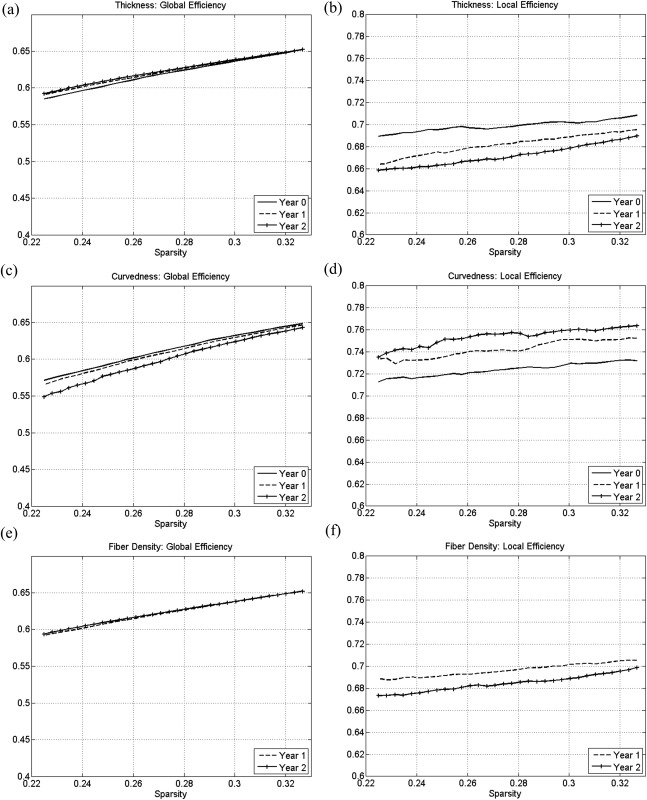
The development of global and local efficiency in (a,b) cortical‐thickness, (c,d) curvedness, and (e,f) fiber‐density correlation networks.
We also compared the global and local efficiency between different types of correlation networks. All three correlation networks show similar global efficiency values (about 0.62 at sparsity equal to 0.30) as shown in Figure 3. And the curvedness correlation networks show the highest local efficiency (about 0.75 at sparsity equal to 0.30), whereas the local efficiency of both cortical‐thickness and fiber‐density correlation networks is smaller than 0.70 at sparsity equal to 0.30.
The Convergence of Network During Development
The consistency of cortical‐thickness correlation networks (or curvedness correlation networks) during the brain development of the first 2 years of life is shown in Figure 4. The percentage of convergences between 2 year old and 1 year old are higher than the percentage of convergences between 1 year old and neonate in both cortical‐thickness and curvedness correlation networks, as indicated in Figure 4a and b, respectively. This result indicates that the network architecture may remain more similar during the development from 1 year old to 2 year old.
Figure 4.
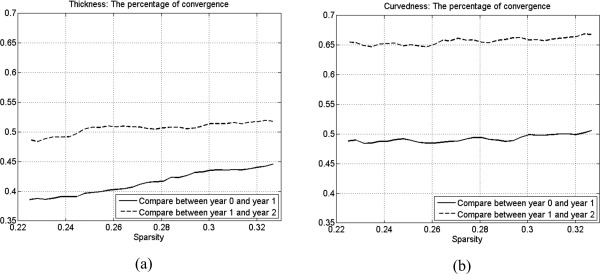
The development of percentage of convergence in (a) cortical‐thickness and (b) curvedness correlation networks.
The primary and secondary folding structures have been well developed before birth, and the tertiary folding structures are still undergoing rapid development after birth [Nie et al., 2012a; Toro and Burnod, 2005]. Meanwhile, the cortical thicknesses at different cortical regions are still developing rapidly and differently after birth [Sowell et al., 2004]. Thus, we also compared the percentage of convergences between the cortical‐thickness and the curvedness correlation networks as shown in Figure 4. The percentages of convergences of curvedness correlation networks (Fig. 4b) show higher value both on convergences curves between 1 year old and neonate and between 2 year old and 1 year old, compared to those of cortical‐thickness correlation networks (Fig. 4a). This result indicates that the development of cortical folding network after birth is relatively subtle, compared to the cortical‐thickness correlation network, and it also shows that the cortical anatomical network should be analyzed by multiple cortical properties such as thickness, folding, and fiber connections together.
The Convergence of Different Networks
To further compare the difference of correlation networks, the percentage of convergence was calculated between correlation networks at each age, as shown in Figure 5. As we can see, the PCs of different types of correlation network (in Fig. 5) are much lower than the PCs in the same type of correlation network between different ages (in Fig. 4) (P<0.05). This result further indicates that the cortical anatomical network should be constructed and analyzed by different anatomical properties.
Figure 5.
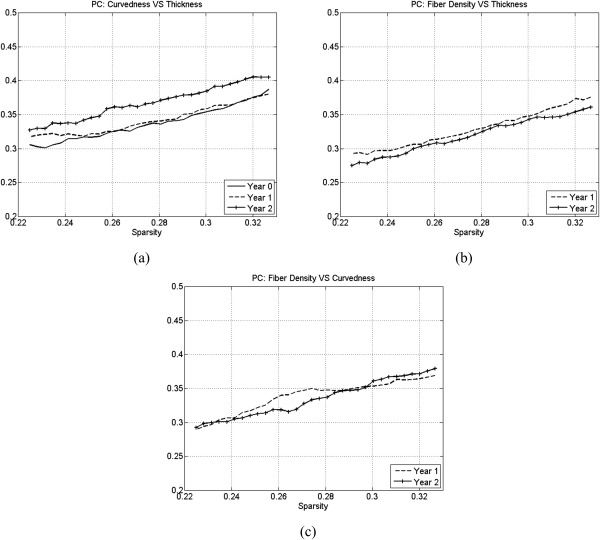
The percentage of convergence (PC) between cortical‐thickness, curvedness, and fiber‐density correlation networks at each year: (a) curvedness vs. thickness, (b) fiber density vs. thickness, and (c) fiber density vs. curvedness.
By comparing cortical‐thickness and curvedness correlation networks, we found that the PC at 1 year old is smaller than at both birth and 2 year old as shown in Figure 5a (P<0.05). And we also found that the PC of fiber‐density and thickness correlation network are similar at 1 and 2 year olds as shown in Figure 5b, and the PC of fiber‐density and curvedness correlation network are also similar at 1 and 2 year olds as shown in Figure 5c.
The Development of Hub Regions in Correlation Networks
The hub regions of cortical‐thickness, curvedness, and fiber‐density correlation networks from neonate to 2 year old are shown in Figure 6. In the cortical‐thickness correlation networks, the left visual region is identified as a hub region consistently during the development, while the hub regions in the frontal lobe disappear after the first 2 years of development as shown in Figure 6. On the contrary, the hub regions in the frontal lobe remain consistently in the curvedness correlation networks during the development, while the hub regions in other lobes disappear as shown in Figure 6. In the fiber‐density correlation networks, the hubs regions remain consistently during the development as shown in Figure 6. By comparing the hub regions in the cortical‐thickness and curvedness correlation networks, we find that the hub regions are similar at neonate and then become totally different at 2 year old. This result indicates that the development of hub regions in the correlation networks shows different patterns in different types of anatomical networks.
Figure 6.
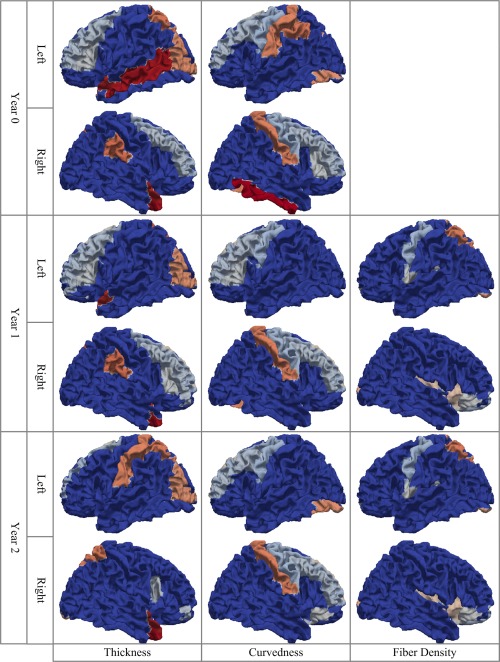
The hub regions of cortical‐thickness, curvedness and fiber density correlation networks from neonate to 2 year old (the non‐blue regions are hubs). [Color figure can be viewed in the online issue, which is available at http://wileyonlinelibrary.com.]
DISCUSSION AND CONCLUSION
For the first time, the development of cortical‐thickness, cortical‐folding, and fiber‐density correlation networks are systematically analyzed to study the relationship between different anatomical properties during the brain development in the first 2 years of life. Though other cortical measurements might also reach similar results, these three measurements were adopted in our experiments considering that the cortical thickness, cortical folding, and fiber connection are the three most important features measuring the distinguished attributes of the cortex for characterizing cortical structures and brain network connections. The results show that the development of anatomical networks could be characterized differently by using different anatomical properties.
The developments of different types of correlation networks illustrate different properties in our results. As the cortical thicknesses at different cortical regions are still developing rapidly and differently after birth [Li et al., 2013; Sowell et al., 2004] because of dendrite development and pruning processes, the local efficiency decreases during the first 2 years of Life. Meanwhile, the hub regions disappear in the high‐level functional region (frontal lobe) and remain consistently (visual area) or appear (post‐central gyrus) in the early developed region. As only the tertiary folding structures are still undergoing rapid development after birth [Nie et al., 2012a; Toro and Burnod, 2005], the cortical‐folding correlation networks show contrary features in our results. For example, the hub regions disappear in early developed region (postcentral gyrus) and remain consistently in the developing high‐level function region (frontal lobe). As the fiber density mainly measures the density of long fibers, which should be developed before birth [Van Essen, 1997], the topology and hub regions of fiber‐density correlation networks remains consistently from 1 year old to 2 year old. The development of anatomical networks also shows different patterns compared to the development of functional network obtained by fMRI studies [Gao et al., 2011].
During the brain development, the mechanisms of cortical folding remains unclear. Serveral hypotheses have been proposed to explain the relationship between these anatomical properties [Nie et al., 2012b; Passingham et al., 2002; Van Essen, 1997]. The areal difference, especially the cytoarchitectonic difference that causes regional mechanical property (such as cortical thickness) variation, is considered as the determinant factor in gyrification. On the other hand, the variation of regional cortical thickness is also considered as the result of gyrification determined by fiber connections [Van Essen, 1997]. In our result, both cortical‐thickness and fiber‐density networks show certain convergence with cortical folding networks, but we also identify the difference between networks, especially the different developmental pattern of networks in the first 2 years of life. This indicates that the cortical folding pattern cannot be simply determined by any single factor, and also could be affected by different factors at different developmental stages.
There are still certain methodological issues that need to be addressed in our future work. First, the microstructural fiber connections in the brain could not be fully tracked using the current diffusion MRI tractography methods. Comparing to the diameter of the actual fiber, the resolution of DTI image is still not high enough to resolve the crossing fiber bundles. More accurate measurement of fiber connection needs more sophisticated tractography algorithms and higher resolution of diffusion imaging techniques in the future. Second, the sub‐cortical structures which include huge number of fiber connections to the cortex could be included in the future work. Third, as the cortical measurements could also be extracted using other methods/tools or from other definitions, the results derived might be different, which is the issue that could be studied in the future. Finally, it has been demonstrated that brain network topology depends on the scheme of brain parcellation [Wang et al., 2009; Zalesky et al., 2010]. Thus, different parcellations of the cortical surface [Li et al., 2009] could be also studied in the future.
ACKNOWLEDGMENT
This work was supported in part by NIH grants EB006733, EB008374, EB009634, AG041721, MH100217, and AG042599. This work was also partially supported by the National Research Foundation grant (No. 2012‐005741) funded by the Korean government.
REFERENCES
- Achard S, Bullmore E (2007): Efficiency and cost of economical brain functional networks. PLoS Comput Biol 3:174–183. [DOI] [PMC free article] [PubMed] [Google Scholar]
- Achard S, Salvador R, Whitcher B, Suckling J, Bullmore E (2006): A resilient, low‐frequency, small‐world human brain functional network with highly connected association cortical hubs. J Neurosci 26:63–72. [DOI] [PMC free article] [PubMed] [Google Scholar]
- Bassett D, Bullmore E, Verchinski BA, Mattay VS, Weinberger KQ, Meyer‐Lindenberg A, (2008) : Hierarchical organization of human cortical networks in health and schizophrenia. J Neurosci 28:9239–9248. [DOI] [PMC free article] [PubMed] [Google Scholar]
- Eguiluz VM, Chialvo DR, Cecchi GA, Baliki M, Apkarian A.V (2005): Scale‐free brain functional networks. Phys Rev Lett 94:018102. [DOI] [PubMed] [Google Scholar]
- Fan Y, Shi F, Smith JK, Lin W, Gilmore JH, Shen D (2011): Brain anatomical networks in early human brain development. Neuroimage 54:1862–1871. [DOI] [PMC free article] [PubMed] [Google Scholar]
- Gao W, Gilmore J.H, Giovanello K.S, Smith J.K, Shen D, Zhu H, Lin W (2011): Temporal and spatial evolution of brain network topology during the first two years of life. PLoS One 6:e25278. [DOI] [PMC free article] [PubMed] [Google Scholar]
- Gong G, He Y, Chen Z.J, Evans A.C (2012): Convergence and divergence of thickness correlations with diffusion connections across the human cerebral cortex. Neuroimage 59:1239–1248. [DOI] [PubMed] [Google Scholar]
- Gong G, He Y, Concha L, Lebel C, Gross D.W, Evans A.C, Beaulieu C (2009a): Mapping anatomical connectivity patterns of human cerebral cortex using in vivo diffusion tensor imaging tractography. Cerebral Cortex 19:524–536. [DOI] [PMC free article] [PubMed] [Google Scholar]
- Gong G, Rosa‐Neto P, Carbonell F, Chen Z.J, He Y, Evans A.C (2009b): Age‐ and gender‐related differences in the cortical anatomical network. J Neurosci 29:15684–15693. [DOI] [PMC free article] [PubMed] [Google Scholar]
- He Y, Chen Z.J, Evans A.C (2007): Small‐world anatomical networks in the human brain revealed by cortical thickness from MRI. Cereb Cortex 17:2407–2419. [DOI] [PubMed] [Google Scholar]
- Iturria‐Medina Y, Sotero R.C, Canales‐Rodriguez E.J, Aleman‐Gomez Y, Melie‐Garcia L (2008): Studying the human brain anatomical network via diffusion weighted MRI and graph theory. Neuroimage 40:1064–1076. [DOI] [PubMed] [Google Scholar]
- Koenderink J.J, Vandoorn A.J, (1992): Surface shape and curvature scales. Image Vision Comput 10:565–565. [Google Scholar]
- Lerch J.P, Worsley K, Shaw WP, Greenstein D.K, Lenroot R.K, Giedd J, Evans A.C (2006): Mapping anatomical correlations across cerebral cortex (MACACC) using cortical thickness from MRI. Neuroimage 31:993–1003. [DOI] [PubMed] [Google Scholar]
- Li G, Guo L, Nie J, Liu T (2009): Automatic cortical sulcal parcellation based on surface principal direction flow field tracking. Neuroimage 46:923–937. [DOI] [PMC free article] [PubMed] [Google Scholar]
- Li G, Nie J, Wu G, Wang Y, Shen D (2012): Consistent reconstruction of cortical surfaces from longitudinal brain MR images. Neuroimage 59:3805–3820. [DOI] [PMC free article] [PubMed] [Google Scholar]
- Li G, Nie J, Wang L, Shi F, LinW, Gilmore JH, Shen D (2013): Mapping Region‐Specific Longitudinal Cortical Surface Expansion from Birth to 2 Years of Age. Cereb Cortex 23:2724–2733. [DOI] [PMC free article] [PubMed] [Google Scholar]
- Liu T, Nie J, Tarokh A, Guo L, Wong S.T (2008): Reconstruction of central cortical surface from brain MRI images: method and application. Neuroimage 40:991–1002. [DOI] [PMC free article] [PubMed] [Google Scholar]
- Liu T, Shen D, Davatzikos C (2004): Deformable registration of cortical structures via hybrid volumetric and surface warping. Neuroimage 22:1790–1801. [DOI] [PubMed] [Google Scholar]
- Micheloyannis S, Pachou E, Stam C.J, Vourkas M, Erimaki S, Tsirka V (2006): Using graph theoretical analysis of multi channel EEG to evaluate the neural efficiency hypothesis. Neurosci Lett 402:273–277. [DOI] [PubMed] [Google Scholar]
- Mori S, Crain B.J, Chacko V.P, van Zijl P.C (1999): Three‐dimensional tracking of axonal projections in the brain by magnetic resonance imaging. Ann Neurol 47:265–269. [DOI] [PubMed] [Google Scholar]
- Mori S, van Zijl P.C (2002): Fiber tracking: Principles and strategies—A technical review. NMR Biomed 15:468–480. [DOI] [PubMed] [Google Scholar]
- Nie J, Guo L, Li G, Faraco C, Stephen Miller L, Liu T (2010): A computational model of cerebral cortex folding. J Theor Biol 264:467–478. [DOI] [PMC free article] [PubMed] [Google Scholar]
- Nie J, Guo L, Li K, Wang Y, Chen G, Li L, Chen H, Deng F, Jiang X, Zhang T, Huang L, Faraco C, Zhang D, Guo C, Yap P.T, Hu X, Li G, Lv J, Yuan Y, Zhu D, Han J, Sabatinelli D, Zhao Q, Miller L.S, Xu B, Shen P, Platt S, Shen D, Liu T (2012a): Axonal fiber terminations concentrate on gyri. Cereb Cortex 22:2831–2839. [DOI] [PMC free article] [PubMed] [Google Scholar]
- Nie J, Li G, Wang L, Gilmore JH, Lin W, Shen D (2012b): A computational growth model for measuring dynamic cortical development in the first year of life. Cereb Cortex 22:2272–2284. [DOI] [PMC free article] [PubMed] [Google Scholar]
- Passingham RE, Stephan KE, Kotter R (2002): The anatomical basis of functional localization in the cortex. Nat Rev Neurosci 3:606–616. [DOI] [PubMed] [Google Scholar]
- Pienaar R, Fischl B, Caviness V, Makris N, Grant P.E (2008): A methodology for analyzing curvature in the developing brain from preterm to adult. Int J Imaging Syst Technol 18:42–68. [DOI] [PMC free article] [PubMed] [Google Scholar]
- Rodriguez‐Carranza C.E, Mukherjee P, Vigneron D, Barkovich J, Studholme C (2007): Comparing 3D Gyrification Index and area‐independent curvature‐based measures in quantifying neonatal brain folding. Proc SPIE:pp. 6512, 65120N. [Google Scholar]
- Salvador R, Suckling J, Coleman M.R, Pickard J.D, Menon D, Bullmore E (2005): Neurophysiological architecture of functional magnetic resonance images of human brain. Cerebral Cortex 15:1332–1342. [DOI] [PubMed] [Google Scholar]
- Schaer M, Cuadra M.B, Tamarit L, Lazeyras F, Eliez S, Thiran J.P (2008): A surface‐based approach to quantify local cortical gyrification. IEEE Trans Med Imaging 27:161–170. [DOI] [PubMed] [Google Scholar]
- Shen D, Davatzikos C, (2002): HAMMER: Heirarchical attribute matching mechanism for elastic registration. IEEE Trans Med Imaging 21:1421–1439. [DOI] [PubMed] [Google Scholar]
- Shi F, Yap PT, Wu G, Jia H, Gilmore JH, Lin W, Shen D (2010): Infant Brain Atlases from Neonates to 1‐ and 2‐year‐olds. PLoS ONE 6:e18746. [DOI] [PMC free article] [PubMed] [Google Scholar]
- Shi F, Yap PT, Gao W, Lin W, Gilmore JH, Shen D (2012a): Altered Structural Connectivity in Neonates at Genetic Risk for Schizophrenia: A Combined Study Using Morphological and White Matter Networks. Neuroimage 62:1622–1633. [DOI] [PMC free article] [PubMed] [Google Scholar]
- Shi F, Wang L, Dai Y, Gilmore JH, Lin W, Shen D (2012b): LABEL: Pediatric Brain Extraction Using Learning‐based Meta‐algorithm. Neuroimage 62:1975–1986. [DOI] [PMC free article] [PubMed] [Google Scholar]
- Shi F, Wang L, Peng Z, Wee CY, Shen D (2013): Altered Modular Organization of Structural Cortical Networks in Children with Autism. PLOS ONE 8:e6313. [DOI] [PMC free article] [PubMed] [Google Scholar]
- Sowell ER, Thompson PM, Leonard CM, Welcome SE, Kan E, Toga AW (2004): Longitudinal mapping of cortical thickness and brain growth in normal children. J Neurosci 24:8223–8231. [DOI] [PMC free article] [PubMed] [Google Scholar]
- Sporns O, Chialvo DR, Kaiser, M , Hilgetag CC (2004): Organization, development and function of complex brain networks. Trends Cogn Sci 8:418–425. [DOI] [PubMed] [Google Scholar]
- Sporns, O , Tononi, G , Kotter, R (2005): The human connectome: A structural description of the human brain. PLoS Comput Biol 1:e42. [DOI] [PMC free article] [PubMed] [Google Scholar]
- Stam C.J (2004): Functional connectivity patterns of human magnetoencephalographic recordings: a ‘small‐world’ network? Neurosci Lett 355:25–28. [DOI] [PubMed] [Google Scholar]
- Stam CJ, Jones B.F, Nolte G, Breakspear M, Scheltens P (2004): Small‐world networks and functional connectivity in Alzheimer's disease. Cereb Cortex 17:92–99. [DOI] [PubMed] [Google Scholar]
- Stieltjes B, Kaufmann W.E, Zijl P.C.M.v, Fredericksen K, Pearlson G.D, Mori S (2001): Diffusion tensor imaging and axonal tracking in the human brainstem. Neuroimage 14:723–735. [DOI] [PubMed] [Google Scholar]
- Toro R, Burnod Y, (2005): A morphogenetic model for the development of cortical convolutions. Cereb Cortex 15:1900–1913. [DOI] [PubMed] [Google Scholar]
- Toro R, Perron M, Pike B, Richer L, Veillette S, Pausova Z, Paus T (2008): Brain size and folding of the human cerebral cortex. Cereb Cortex 18:2352–2357. [DOI] [PubMed] [Google Scholar]
- Tzourio‐Mazoyer N, Landeau B, Papathanassiou D, Crivello F, Etard O, Delcroix N, Mazoyer B, Joliot M (2002): Automated anatomical labeling of activations in SPM using a macroscopic anatomical parcellation of the MNI MRI single‐subject brain. Neuroimage 15:273–289. [DOI] [PubMed] [Google Scholar]
- Van Essen D.C (1997): A tension‐based theory of morphogenesis and compact wiring in the central nervous system. Nature 385:313–318. [DOI] [PubMed] [Google Scholar]
- Wang J, Wang L., Zang Y, Yang H, Tang H, Gong Q, Chen Z, Zhu C, He Y (2009): Parcellation‐dependent small‐world brain functional networks: a resting‐state fMRI study. Hum Brain Mapp 30:1511–1523. [DOI] [PMC free article] [PubMed] [Google Scholar]
- Wang L, Shi F, Yap PT, Gilmore JH, Lin W, Shen D (2011): Accurate and Consistent 4D Segmentation of Serial Infant Brain MR Images. LNCS 2011 2712:93–101. [Google Scholar]
- Watts DJ, Strogatz SH (1998): Collective dynamics of ‘small‐world’ networks. Nature 393:440–442. [DOI] [PubMed] [Google Scholar]
- Wee CY, Yap PT, Li W, Denny K, Browndyke JN, Potter GG, Welsh‐Bohmer KA, Wang L, Shen D (2011): Enriched white matter connectivity networks for accurate identification of MCI patients. Neuroimage 54:1812–1822. [DOI] [PMC free article] [PubMed] [Google Scholar]
- Worsley KJ, Chen JI, Lerch, J , Evans AC (2005): Comparing functional connectivity via thresholding correlations and singular value decomposition. Philos Trans R Soc Lond B Biol Sci 360:913–920. [DOI] [PMC free article] [PubMed] [Google Scholar]
- Zalesky A, Fornito A, Harding IH, Cocchi L, Yücel M, Pantelis C, Bullmore ET (2010): Whole‐brain anatomical networks: Does the choice of nodes matter? Neuroimage 50:970–983. [DOI] [PubMed] [Google Scholar]
- Zhu D, Li K, Guo L, Jiang X, Zhang T, Zhang D, Chen H, Deng F, Faraco C, Jin C, Wee CY, Yuan Y, Lv P, Yin Y, Hu X, Duan L, Hu X, Han J, Wang L, Shen D, Miller LS, Li L, Liu T (2011): DICCCOL: dense individualized and common connectivity-based cortical landmarks. Cereb Cortex 23:786–800. [DOI] [PMC free article] [PubMed] [Google Scholar]
- Zilles K, Armstrong E, Schleicher A, Kretschmann HJ (1988): The human pattern of gyrification in the cerebral cortex. Anat Embryol (Berl) 179:173–179. [DOI] [PubMed] [Google Scholar]