

Abstract
Background
As a pregnancy continues beyond term the risks of babies dying inside the womb or in the immediate newborn period increase. Whether a policy of labour induction at a predetermined gestational age can reduce this increased risk is the subject of this review.
Objectives
To evaluate the benefits and harms of a policy of labour induction at term or post-term compared with awaiting spontaneous labour or later induction of labour.
Search methods
We searched the Cochrane Pregnancy and Childbirth Group’s Trials Register (31 March 2012).
Selection criteria
Randomised controlled trials conducted in women at or beyond term. The eligible trials were those comparing a policy of labour induction with a policy of awaiting spontaneous onset of labour. Cluster-randomised trials and cross-over trials are not included. Quasi-random allocation schemes such as alternation, case record numbers or open random-number lists were not eligible.
Data collection and analysis
Two review authors independently assessed trials for inclusion. Two review authors independently assessed trial quality and extracted data. Data were checked for accuracy. Outcomes are analysed in two main categories: gestational age and cervix status.
Main results
We included 22 trials reporting on 9383 women. The trials were generally at moderate risk of bias.
Compared with a policy of expectant management, a policy of labour induction was associated with fewer (all-cause) perinatal deaths: risk ratio (RR) 0.31, 95% confidence interval (CI) 0.12 to 0.88; 17 trials, 7407 women. There was one perinatal death in the labour induction policy group compared with 13 perinatal deaths in the expectant management group. The number needed to treat to benefit (NNTB) with induction of labour in order to prevent one perinatal death was 410 (95% CI 322 to 1492).
For the primary outcome of perinatal death and most other outcomes, no differences between timing of induction subgroups were seen; the majority of trials adopted a policy of induction at 41 completed weeks (287 days) or more.
Fewer babies in the labour induction group had meconium aspiration syndrome (RR 0.50, 95% CI 0.34 to 0.73; eight trials, 2371 infants) compared with a policy of expectant management. There was no statistically significant difference between the rates of neonatal intensive care unit (NICU) admission for induction compared with expectant management (RR 0.90, 95% CI 0.78 to 1.04; 10 trials, 6161 infants). For women in the policy of induction arms of trials, there were significantly fewer caesarean sections compared with expectant management in 21 trials of 8749 women (RR 0.89, 95% CI 0.81 to 0.97).
Authors’ conclusions
A policy of labour induction compared with expectant management is associated with fewer perinatal deaths and fewer caesarean sections. Some infant morbidities such as meconium aspiration syndrome were also reduced with a policy of post-term labour induction although no significant differences in the rate of NICU admission were seen.
However, the absolute risk of perinatal death is small. Women should be appropriately counselled in order to make an informed choice between scheduled induction for a post-term pregnancy or monitoring without induction (or delayed induction).
Medical Subject Headings (MeSH): * Pregnancy, Prolonged; *Watchful Waiting; Cesarean Section [utilization]; Infant Mortality; Infant, Newborn; Labor, Induced [*adverse effects]; Randomized Controlled Trials as Topic; Risk
MeSH check words: Female, Humans, Pregnancy
BACKGROUND
A pregnant women is ‘at term’ when her pregnancy duration reaches 37 weeks. Up to 10% of pregnancies continue beyond 294 days (420/7 weeks) and are described as being ‘post-term’ or ‘postdate’ (Olesen 2003; Roos 2010; Zeitlin 2007), although this can vary markedly between countries. This variation suggests that there are different policies and practices for managing post-term pregnancies in Europe (Zeitlin 2007) and beyond.
While the aetiology of post-term birth is not well elucidated (Mandruzzato 2010), risk factors such as obesity, nulliparity and maternal age greater than 30 years have been associated with an increased risk of post-term birth (Arrowsmith 2011; Caughey 2009b; Roos 2010). Placental senescence may play a role in the pathophysiology of post-term birth (Mandruzzato 2010).
Both the mother and the infant are at increased risk of adverse events when the pregnancy continues beyond term. Hilder 1998 reported the risk of fetal or infant loss per 1000 ongoing pregnancies beyond term. After 41 weeks, neonatal and postneonatal death risk increased significantly. Olesen et al conducted a cross-sectional study of birth registry data between 1978 to 1993 in Denmark (Olesen 2003) showing similar results, that is, significant increase in perinatal death and morbidities. The majority of post-term births occurred at 42 weeks (87%) while less than 1% of women gave birth at 44 weeks or later. The overall risk of perinatal death was 0.4% in the post-term group and 0.3% in the term group in the Olesen et al study. In a later study report from the Norwegian Birth Registry (Heimstad 2008), the perinatal death rate was 0.018% at day 287 and 0.51% at day 302+. These findings are important in that, even in a setting where early booking allows accurate assessment of gestational age and antenatal services are accessible for most women, post-term pregnancy constitutes a high-risk situation, especially for the baby.
The obstetric problems associated with post-term pregnancy include induction of labour with an unfavourable cervix, caesarean section, prolonged labour, postpartum haemorrhage and traumatic birth. It is likely that some of these unwanted outcomes result from intervening when the uterus and cervix are not ready for labour.
Early pregnancy ultrasound is associated with a reduced incidence of post-term pregnancy possibly by avoiding misclassification (Whitworth 2010). Induction of labour is widely practised to try and prevent the problems mentioned above and improve the health outcome for women and their infants. Unfortunately, labour induction may itself cause problems especially when the cervix is not favourable. Furthermore, the ideal timing for induction of labour is not clear. In the past there was a tendency to await spontaneous labour until 42 completed weeks. However, an earlier version of this review, last revised in 1999, suggested that induction of labour at or from 41 weeks reduced perinatal mortality without increasing caesarean section and other adverse outcomes (Crowley 2006). Other authors have concluded that labour induction at 41 weeks or more is associated with a reduced caesarean section rate and no difference in perinatal mortality (Sanchez-Ramos 2003). Earlier studies have also looked at interventions before the post-term stage is reached.
The gestational age and cervix being unfavourable may affect the success of the induction of labour and the resulting caesarean section rates. When the cervix is favourable (usually a Bishop score of six or more), induction is often carried out by oxytocin and artificial rupture of amniotic membranes. If the cervix is not favourable then usually a prostaglandin gel or tablet is placed in the vagina or cervix to ripen the cervix and initiate the uterine contractions and labour. Many protocols are used with varying repeat intervals and transition to oxytocin and amniotomy depending on the onset of uterine contractions and progress of cervical dilatation. Recently, the use of oral (Alfirevic 2006) and vaginal (Hofmeyr 2010) misoprostol for labour induction have been reviewed.
The earlier versions of this review included interventions such as early pregnancy ultrasound that may have an effect on the outcome of pregnancies for women at or beyond term. (This topic is addressed in the Cochrane review ‘Ultrasound for fetal assessment in early pregnancy’ (Whitworth 2010).) In this update, we evaluate labour induction at or beyond term compared with expectant management which may include various intensities of monitoring.
OBJECTIVES
To assess the effects of a policy of labour induction at or beyond term compared with a policy of awaiting spontaneous labour indefinitely (until a later gestational age or until a maternal or fetal indication for induction of labour is identified) on pregnancy outcomes for the infant and the mother.
METHODS
Criteria for considering studies for this review
Types of studies
Randomised controlled trials were eligible for inclusion in the review. Cluster-randomised trials and cross-over trials were not included. Quasi-random allocation schemes such as alternation, case record numbers or open random-number lists were not eligible.
Types of participants
Pregnant women at or beyond term were the participants in the trials eligible for this review. Since a risk factor at this stage of pregnancy would normally require an intervention, only trials including women at low risk for complications were eligible. We accepted the trialists’ definition of ‘low risk’. The trials of induction of labour in women with prelabour rupture of membranes at or beyond term were not considered in this review (Dare 2006), although some women participating in the eligible trials may have had ruptured membranes.
Types of interventions
The experimental intervention evaluated in this review is a policy of labour induction at a predetermined gestational age. This policy is compared with ‘expectant management’ until an indication for birth arises. The trial protocols differ according to:
gestational age;
actual method of labour induction (prostaglandins, misoprostol, +/− oxytocin), protocol used (dosage of any drugs, timing, frequency of use and mode of administration);
expectant management protocols (intensity of fetal well-being assessment and fetal monitoring techniques used).
Types of outcome measures
Primary outcome
The primary outcome of this review was perinatal mortality, defined as intrauterine deaths plus newborn deaths in the first week of life.
Secondary outcomes
For the infant/child
Perinatal mortality (stillbirth, newborn deaths within first week)
Birth asphyxia (as defined by trialists)
Admission to neonatal intensive care unit
Neonatal convulsions
Neonatal encephalopathy
Use of anticonvulsants
Meconium aspiration syndrome
Pneumonia
Apgar score less than seven at five minutes
Neurodevelopment at childhood follow-up
For the mother
Mode of birth (caesarean section, vaginal)
Operative vaginal birth (forceps or ventouse)
Analgesia used
Perineal trauma
Prolonged labour (cut-off used by the trialists was used)
Postpartum haemorrhage (cut-off used by the trialists was used)
Anxiety before birth
Other measures of satisfaction with the approach
Breastfeeding at discharge
Postnatal depression
We extracted other outcomes reported by the trialists if they related to the outcomes listed. Cost-related analyses were included in the results and discussion sections.
Health services use
Length of maternal postnatal stay
Length of neonatal postnatal stay
Length of labour
Search methods for identification of studies
Electronic searches
We searched the Cochrane Pregnancy and Childbirth Group’s Trials Register by contacting the Trials Search Co-ordinator (31 March 2012).
The Cochrane Pregnancy and Childbirth Group’s Trials Register is maintained by the Trials Search Co-ordinator and contains trials identified from:
monthly searches of the Cochrane Central Register of Controlled Trials (CENTRAL);
weekly searches of MEDLINE;
weekly searches of EMBASE;
handsearches of 30 journals and the proceedings of major conferences;
weekly current awareness alerts for a further 44 journals plus monthly BioMed Central email alerts.
Details of the search strategies for CENTRAL, MEDLINE and EMBASE, the list of handsearched journals and conference proceedings, and the list of journals reviewed via the current awareness service can be found in the ‘Specialized Register’ section within the editorial information about the Cochrane Pregnancy and Childbirth Group.
Trials identified through the searching activities described above are each assigned to a review topic (or topics). The Trials Search Co-ordinator searches the register for each review using the topic list rather than keywords.
We did not apply any language restrictions.
Data collection and analysis
For the methods used when assessing the trials identified in the previous version of this review, see Appendix 1.
For this update, we used the following methods when assessing the trials identified by the updated search (Heimstad 2007a; Hernandez-Castro 2008; Imsuwan 1999; Nicholson 2008; Nielsen 2005; Rijnders 2007; Sahraoui 2005).
Selection of studies
Two review authors independently assessed for inclusion all the potential studies we identified as a result of the search strategy. We resolved disagreements through discussion or, when required, we consulted a third review author.
Data extraction and management
For eligible studies, two review authors extracted the data using a data extraction form. We resolved discrepancies through discussion or by consulting a third person. Data were entered into Review Manager software (RevMan 2011) and checked for accuracy. When information regarding any of the above was unclear, we attempted to contact authors of the original reports to provide further details.
Assessment of risk of bias in included studies
Two review authors independently assessed risk of bias for each study using the criteria outlined in the Cochrane Handbook for Systematic Reviews of Interventions (Higgins 2011). Disagreements were resolved by discussion or by involving a third assessor.
(1) Random sequence generation (checking for possible selection bias)
For each included study we described the method used to generate the allocation sequence in sufficient detail to allow an assessment of whether it should produce comparable groups.
We assessed the method as:
low risk of bias (any truly random process, e.g. random number table; computer random number generator);
high risk of bias (any non random process, e.g. odd or even date of birth; hospital or clinic record number); or
unclear risk of bias.
(2) Allocation concealment (checking for possible selection bias)
For each included study we described the method used to conceal allocation to interventions prior to assignment and assessed whether intervention allocation could have been foreseen in advance of, or during recruitment, or changed after assignment.
We assessed the methods as:
low risk of bias (e.g. telephone or central randomisation; consecutively numbered sealed opaque envelopes);
high risk of bias (open random allocation; unsealed or non-opaque envelopes, alternation; date of birth); or
unclear risk of bias.
(3.1) Blinding of participants and personnel (checking for possible performance bias)
For each included study we described the methods used, if any, to blind study participants and personnel from knowledge of which intervention a participant received. We judged studies to be at low risk of bias if they were blinded, or if we judged that the lack of blinding could not have affected the results.
We assessed the methods as:
low, unclear or high risk of bias for participants;
low, unclear or high risk of bias for personnel.
(3.2) Blinding of outcome assessment (checking for possible detection bias)
For each included study we described the methods used, if any, to blind outcome assessors from knowledge of which intervention a participant received.
We assessed the methods as:
low, unclear or high risk of bias for outcome assessors.
(4) Incomplete outcome data (checking for possible attrition bias due to the amount, nature and handling of incomplete outcome data)
For each included study we described the completeness of data including attrition and exclusions from the analysis. We stated whether attrition and exclusions were reported, the numbers included in the analysis at each stage (compared with the total randomised participants), reasons for attrition or exclusion where reported, and whether missing data were balanced across groups or were related to outcomes. Where sufficient information was reported by the trial authors, we re-included missing data in the analyses which we undertook. We assessed methods as:
low risk of bias (e.g. no missing outcome data; missing outcome data balanced across groups);
high risk of bias (e.g. numbers or reasons for missing not balanced across groups; ‘as treated’ analysis done with substantial departure of intervention received from that assigned at randomisation); or
unclear risk of bias.
(5) Selective reporting bias (checking for possible reporting bias)
For each included study, we described how we investigated the possibility of selective outcome reporting bias and what we found. We assessed the methods as:
low risk of bias (where it is clear that all of the study’s prespecified outcomes and all expected outcomes of interest to the review have been reported);
high risk of bias (where not all the study’s pre-specified outcomes have been reported; one or more reported primary outcomes were not pre-specified; outcomes of interest are reported incompletely and so cannot be used; study fails to include results of a key outcome that would have been expected to have been reported); or
unclear risk of bias.
(6) Other sources of bias (checking for bias due to problems not covered by (1) to (5) above)
For each included study we described any important concerns we have about other possible sources of bias.
We assessed whether each study was free of other problems that could put it at risk of bias:
low risk of other bias;
high risk of other bias; or
unclear whether there is risk of other bias.
(7) Overall risk of bias
We made explicit judgements about whether studies are at high risk of bias, according to the criteria given in the Handbook (Higgins 2011). With reference to (1) to (6) above, we assessed the likely magnitude and direction of the bias and whether we considered it likely to impact on the findings.
Measures of treatment effect
Dichotomous data
For dichotomous data, we presented results as risk ratio with 95% confidence intervals.
Continuous data
For continuous data, we used the mean difference with 95% confidence intervals if outcomes were measured in the same way between trials.
Dealing with missing data
For included studies, we noted levels of attrition. We intended to explore the impact of including studies with high levels of missing data in the overall assessment of treatment effect by using sensitivity analyses but most trials reported low levels of missing data. For all outcomes we carried out, as far as possible, analyses on an intention-to-treat basis, i.e. we attempted to include all participants randomised to each group in the analyses. The denominator for each outcome in each trial was the number randomised minus any participants whose outcomes were known to be missing.
Assessment of heterogeneity
We assessed statistical heterogeneity in each meta-analysis using the T2, I2 and Chi2 statistics. We regarded heterogeneity to be substantial when I2 was greater than 30% and either T2 was greater than zero, or there was a low P value (less than 0.10) in the Chi2 test for heterogeneity.
Assessment of reporting biases
We investigated reporting biases (such as publication bias) by visually assessing funnel plots for meta-analyses of more than 10 trials.
Data synthesis
We carried out statistical analysis using the Review Manager software (RevMan 2011). We used fixed-effect inverse variance meta-analysis for combining data where trials were examining the same intervention, and the trials’ populations and methods were judged to be sufficiently similar.
Where substantial heterogeneity was identified in a fixed-effect meta-analysis, we noted this and repeated the analysis using a random-effects method and presented the analysis as the average treatment effect with 95% confidence intervals and the estimates of T2 and I2.
Subgroup analysis and investigation of heterogeneity
We planned to conduct the following a priori subgroup analyses.
-
Gestational age by week of gestation when induction was intended in the intervention arm.
In this update we have presented the main groups as close to this as study reporting would allow - gestational ages 37 to 39 weeks; 39 to 40 weeks; 41 completed weeks (287 days) and > 41 completed weeks (> 287 days).
Condition of cervix (favourable versus unfavourable).
By method of induction (including dosage, timing, frequency and mode of administration).
We conducted the first two analyses but did not have sufficient data to look at the results by method of induction.
We examined and reported on the results of interaction tests for outcomes assessed under either fixed-effect or random-effects models.
Sensitivity analysis
Only three trials (Hannah 1992; Heimstad 2007a; NICHHD 1994) reported adequate methods of allocation concealment with no other bias component judged to be of high risk. Consequently we did not carry out sensitivity analyses according to risk of bias but will do so in future updates of this review as more data become available.
RESULTS
Description of studies
See: Characteristics of included studies; Characteristics of excluded studies; Characteristics of ongoing studies.
For this update we have now incorporated the trial reports that were previously awaiting classification. We have included three new trials (Heimstad 2007a; Nielsen 2005; Sahraoui 2005), excluded three new trials (Hernandez-Castro 2008; Imsuwan 1999; Nicholson 2008) and added one ongoing trial (Rijnders 2007).
This updated review is now comprised of 22 included studies reporting on 9383 women (see Characteristics of included studies), 64 excluded studies (see Characteristics of excluded studies) and one ongoing study (see Characteristics of ongoing studies).
Most of the excluded trials were comparisons of different labour induction or cervical ripening protocols. More details are provided in the Characteristics of excluded studies table.
Gestational age at trial entry
All trials included low-risk women with ‘certain’ gestational age and gestational age was generally well reported.
Cervix status
Eleven trials did not mention or specify cervix status as an inclusion criterion (Augensen 1987; Bergsjo 1989; Breart 1982; Chakravarti 2000; Cole 1975; Heimstad 2007a; Henry 1969; James 2001; Roach 1997; Suikkari 1983; Witter 1987). Eight trials included women with unfavourable cervix (Dyson 1987; Gelisen 2005; Hannah 1992; Herabutya 1992; Martin 1989; NICHHD 1994; Ocon 1997; Sahraoui 2005) and three with favourable cervical status (Chanrachkul 2003; Egarter 1989; Nielsen 2005).
Settings
Of the 22 included trials:
five were conducted in USA (Dyson 1987; Martin 1989; NICHHD 1994; Nielsen 2005; Witter 1987);
two in China (Bergsjo 1989; Roach 1997);
two in India (Chakravarti 2000; James 2001);
two in Thailand (Chanrachkul 2003; Herabutya 1992);
two in Norway (Augensen 1987; Heimstad 2007a);
two in the UK (Cole 1975; Henry 1969);
one in Tunisia (Sahraoui 2005);
one in Turkey (Gelisen 2005)
one in Canada (Hannah 1992);
one in France (Breart 1982);
one in Austria (Egarter 1989);
one in Spain (Ocon 1997); and
one in Finland (Suikkari 1983).
Interventions
All trials were conducted in hospitals with various intensities of fetal monitoring both in the induction and expectant management groups (see Characteristics of included studies).
Timing of induction - induction group
Although we had intended to report gestation by intended time of induction in the policy of labour induction arm, we were limited to the following five categories due to incomplete reporting and policies that overlapped weeks of gestation:
37 to 39 weeks: one trial (Breart 1982) induced women at 37 to 39 weeks gestation (number of days not reported) in the policy of labour induction arm.
39 to 40 weeks (days not reported): three trials induced women at 39 to 40 weeks (up to 286 days) gestation in the policy of labour induction arms (Cole 1975; Egarter 1989; Nielsen 2005).
< 41 weeks (days not reported): one trial (Chakravarti 2000) reported that they induced women in the policy of labor induction at less than 41 weeks.
41 completed weeks (287 days): four trials reported that they induced women in the intervention arm at 41 completed weeks (410/7 or 287 days) - Dyson 1987; Gelisen 2005; James 2001; Martin 1989.
> 41 weeks (> 287 days): in the remaining 13 trials (Augensen 1987; Bergsjo 1989; Chanrachkul 2003; Hannah 1992; Heimstad 2007a; Henry 1969; Herabutya 1992; NICHHD 1994; Ocon 1997; Roach 1997; Sahraoui 2005; Suikkari 1983; Witter 1987), women in the policy of labour induction arms were generally induced after 287 days gestation up to 294 days (42 completed weeks), with the NICHHD 1994 trial extending from 41 to 43 completed weeks (430/7; 301 days).
In some trials, the actual gestational age at induction in the induction groups may have been slightly later than the gestational threshold specified at trial entry (e.g. Hannah 1992).
See of included studies table for further details.
Method of induction - induction group
Labour induction was by oxytocin with or without artificial rupture of membranes in most trials. In trials recruiting women with unfavourable cervix, priming with prostaglandins or laminaria were often undertaken before induction.
Of the 22 included trials:
one trial did not report the method used (Chakravarti 2000);
17 trials used oxytocin infusion in some or all women in their intervention group (Augensen 1987; Bergsjo 1989; Breart 1982; Chanrachkul 2003; Cole 1975; Dyson 1987; Gelisen 2005; Hannah 1992; Heimstad 2007a; Henry 1969; Herabutya 1992; James 2001; Martin 1989; NICHHD 1994; Nielsen 2005; Suikkari 1983; Witter 1987). Of those trials, only one used oxytocin as the sole method of induction (Augensen 1987). Eleven trials used artificial rupture of membranes (AROM), as well as oxytocin infusion (when possible) (Bergsjo 1989; Breart 1982; Chanrachkul 2003; Cole 1975; Heimstad 2007a; Henry 1969; Herabutya 1992; James 2001; Nielsen 2005; Suikkari 1983; Witter 1987);
none of the included trials used AROM as the sole method of induction;
eight trials used intravaginal prostaglandin E2 for some or all women in the intervention group (in either gel or pessary form) (Dyson 1987; Egarter 1989; Hannah 1992; Herabutya 1992; NICHHD 1994; Ocon 1997; Roach 1997; Sahraoui 2005). Four trials used prostaglandin E2 as the sole method of induction (Egarter 1989; Ocon 1997; Roach 1997; Sahraoui 2005) and four trials used a combination of prostaglandin and oxytocin +/− AROM (Dyson 1987; Hannah 1992; Herabutya 1992; NICHHD 1994);
two trials used vaginal misoprostol in some or all women in the intervention group (Gelisen 2005; Heimstad 2007a);
two trials had more than one intervention group (Gelisen 2005; NICHHD 1994), although the placebo priming and oxytocin arm in NICHHD 1994 was not included in this review. The Gelisen 2005 trial had three labour induction arms with misoprostol, oxytocin and Foley catheter.
Expectant management group protocols
For the majority of trials, expectant management protocols included various combinations of fetal heart rate monitoring, ultrasound for amniotic fluid measurements and, in earlier studies, biochemical tests. Two trials had no intervention, followed by induction of labour (IOL) (if no spontaneous labour) at 43 weeks (Bergsjo 1989) or 41 weeks (Cole 1975).
Of the 22 included trials, no gestational age limit for induction was imposed or reported in seven (Dyson 1987; Henry 1969; James 2001; Ocon 1997; Roach 1997; Suikkari 1983; Witter 1987). In the remaining 15 trials, women were induced at the following times (unless they went into spontaneous labour earlier) in the expectant management groups:
IOL at 41 weeks (Cole 1975).
IOL at 42 weeks (Breart 1982; Chakravarti 2000; Egarter 1989; Gelisen 2005; Nielsen 2005; Sahraoui 2005).
IOL at 42 to 43 weeks (Augensen 1987).
IOL at 43 weeks (Bergsjo 1989; Heimstad 2007a; Martin 1989).
IOL at 44 weeks (Chanrachkul 2003; Hannah 1992; Herabutya 1992; NICHHD 1994).
Risk of bias in included studies
Two trials (Chakravarti 2000; Suikkari 1983) are available only as abstracts and despite extensive searches we could not locate full publications of the studies, which limited our assessment of their risk of bias.
We judged the majority of included trials to be at moderate risk of bias (Figure 1; Figure 2).
Figure 1. Risk of bias graph: review authors’ judgements about each risk of bias item presented as percentages across all included studies.

Figure 2. Risk of bias summary: review authors’ judgements about each risk of bias item for each included study.

Allocation
Ten trials reported using some form of adequate random sequencing such as a computer-generated sequence or a list of random numbers (low risk of bias). The remaining 12 trials did not report how a random sequence was generated.
Of the 22 included trials, only four reported a method of allocation concealment likely to have a low risk of bias - either central randomisation or sequentially numbered sealed opaque envelopes (Hannah 1992; Heimstad 2007a; NICHHD 1994; Nielsen 2005). Seven trials reported that they used an envelope system with an unclear risk of bias (Breart 1982; Dyson 1987; Gelisen 2005; James 2001; Martin 1989; Roach 1997; Witter 1987), one trial reported a partial third party system also with unclear risk of bias (Augensen 1987) and 10 trials did not report a method for concealing allocation (Bergsjo 1989; Chakravarti 2000; Chanrachkul 2003; Cole 1975; Egarter 1989; Henry 1969; Herabutya 1992; Ocon 1997; Sahraoui 2005; Suikkari 1983).
Blinding
Performance bias
Given the nature of the intervention (induction of labour) versus expectant management, it was not possible for participants or clinicians to be blinded to the treatment group.
Detection bias
It would have been possible for outcome assessment to have been undertaken by someone blinded to allocation groups. However, all studies but one did not report whether or not outcome assessment was blinded. One study indicated partial blinding of outcome assessment (Hannah 1992); an adjudication of abnormal neonatal outcomes was undertaken by a neonatologist who was unaware of the mothers’ group assignments.
Measurement of outcomes such as perinatal death should not be biased by lack of blinding.
Incomplete outcome data
The majority of trials (19/22) were judged to be at low risk of attrition bias, with three trials judged to be at unclear risk of attrition bias (Breart 1982; Cole 1975; Egarter 1989). We judged the Breart 1982 and Egarter 1989 trials to be at unclear risk of bias, due to protocol deviations and we judged the Cole 1975 study to be at increased risk due to post-randomisation exclusion of mistakenly included participants. In the Hannah 1992 trial, seven women whose babies had lethal congenital anomalies were excluded after randomisation, and this may have influenced the comparisons for perinatal death rates, as other trials did not exclude such anomalies or did not state that they did. In the Witter 1987 trial, some women gave birth prior to 42 weeks (35/103 in the intervention group and 39/97 in the expectant group) and were included in analyses, in contrast to other trials where births prior to the interventions were excluded.
Selective reporting
We judged the risk of selective reporting bias to be high for four trials and unclear for a further six trials. The trials rated as high risk of bias failed to report on the primary outcome of perinatal death and usually omitted other expected outcomes as well (Breart 1982; Nielsen 2005; Roach 1997; Witter 1987). For the trials rated as unclear risk of bias, two were only available as abstracts (Chakravarti 2000; Suikkari 1983) with abbreviated reporting of outcomes and the Bergsjo 1989; Egarter 1989; and Henry 1969 trials also did not appear to fully report their outcomes. The Ocon 1997 trial appears not to have reported perinatal deaths (although this paper had to be translated to English so there is some uncertainty about this).
Other potential sources of bias
Most of the trials appeared to be free of other potential sources of bias. We judged three trials to be at unclear risk of bias - Chakravarti 2000 and Suikkari 1983 because of the limited reporting in these abstracts; and in Egarter 1989 there was some imbalance in the numbers of women randomised to each group.
Effects of interventions
We have presented the results by intended timing in the policy of labour induction arms of each trial (37-39 weeks; 39-40 weeks, < 41 weeks, 41 weeks, > 41 weeks).
Primary outcome
Perinatal death
Significantly fewer perinatal deaths occurred in the labour induction groups than the expectant management groups: risk ratio (RR) 0.31, 95% confidence interval (CI) 0.12 to 0.81; one perinatal death occurred in the induction group compared with 13 in the expectant group (17 trials with 7407 women) - Analysis 1.1. Interaction tests failed to demonstrate significant differences between the timing of induction subgroups (39-40 weeks; 41 weeks; and > 41 weeks) - Analysis 1.1.
Omitting the trials where women were induced at less than 41 completed weeks (< 287 days) made little difference to the result (RR 0.31, 95% CI 0.11 to 0.88).
Some trials (e.g. Hannah 1992) excluded perinatal deaths due to congenital abnormalities while other trials included these. If the three deaths reported to be due to congenital anomalies are excluded, there were no deaths in the labour induction group and 11 in the expectant management group, across all the gestational age groups. Again, this made little difference to the overall result (RR 0.29, 95% CI 0.10 to 0.83).
Table 1 details the respective causes of death for the 14 babies. The number needed to treat to benefit (NNTB) with a policy of induction of labour in order to prevent one perinatal death was 410 (95% CI 322 to 1492).
Five trials (Breart 1982; Chakravarti 2000; Ocon 1997; Roach 1997; Witter 1987) did not report perinatal mortality.
Secondary outcomes
Stillbirths
Seven of the 14 perinatal deaths were stillbirths. All seven stillbirths occurred in the expectant management groups (RR 0.30, 95% CI 0.08 to 1.08; 17 trials with 7407 women) - Analysis 1.2. Interaction tests failed to demonstrate significant differences between the timing of induction subgroups (39-40 weeks; 41 weeks; and > 41 weeks) - Analysis 1.2.
Neonatal deaths
There were also seven live birth deaths (all occurring before seven days of life). One of these was in the induction group and six were in the expectant group (RR 0.37, 95% CI 0.10 to 1.38; 17 trials with 7407 women - Analysis 1.3). None of the interaction tests showed significant differences between subgroups (39-40 weeks, 41 weeks, > 41 weeks) - Analysis 1.3.
Birth asphyxia
In two trials, birth asphyxia was not significantly different between the induction (both trials > 41 weeks) and expectant groups (Chanrachkul 2003; Heimstad 2007a; a total of 757 women): RR 1.86, 95% CI 0.51 to 6.76 (Analysis 1.4).
Meconium aspiration syndrome
The risk of meconium aspiration syndrome was significantly reduced in the induction groups compared with the expectant management groups (RR 0.50, 95% CI 0.34 to 0.73; eight trials of 2371 women) - Analysis 1.5. Interaction tests failed to show significant differences between the 41 weeks and > 41 weeks subgroups - Analysis 1.5.
Newborn intensive care unit (NICU) admission
There was no statistically significant difference in NICU admissions when labour induction was compared with expectant management (RR 0.90, 95% CI 0.78 to 1.04; 10 trials of 6161 women) - Analysis 1.6. No significant differences were seen in subgroup interaction tests (39-40 weeks; 41 weeks; > 41 weeks) - Analysis 1.6.
Apgar score less than seven at five minutes
There was no significant difference between the rates of Apgar scores less than seven at five minutes (RR 0.72, 95% CI 0.44 to 1.18 (10 trials; 5379 women - Analysis 1.7). No significant differences were seen in subgroup interaction tests (39-40 weeks; 41 weeks; > 41 weeks) - Analysis 1.7.
Birthweight greater than 4000 g
There was a statistically significant reduction in the rate of macrosomia (greater than 4000 g) in the labour induction groups (RR 0.73, 95% CI 0.64 to 0.84; six trials (41 weeks; > 41 weeks induction) of 5217 women; fixed-effect). With an I2 of 75%; T2 = 0.12 and Chi2 P value = 0.001, this analysis demonstrated very substantial statistical heterogeneity. Under a random-effects analysis, there was no longer a significant difference (RR 0.74, 95% CI 0.51 to 1.05 - Analysis 1.8). The heterogeneity is likely to be due to the highly positive results from Gelisen 2005 (a subgroup interaction test was highly significant; P < 0.0001), though differences in timing of induction (41 weeks versus > 41 weeks) do not seem a likely explanation here. A sensitivity analysis excluding Gelisen 2005 reduced the I2 to 0% and the summary estimate was still statistically significantly in favour of induction, though attenuated (RR 0.85, 95% CI 0.73 to 0.99; fixed-effect).
Birthweight (g)
A statistically significant but small decrease in birthweight was seen in the induction group compared with the expectant management groups (mean difference (MD) −57.79 g, 95% CI −99.84 to −15.73; nine trials; 2579 women) - Analysis 1.9; I2 36%; random-effects). No significant differences were seen in subgroup interaction tests (39 - 40 weeks; 41 weeks; > 41 weeks) - Analysis 1.9.
Caesarean section
There were significantly fewer caesarean sections in the induction groups compared with the expectant management groups in 21 trials of 8749 women (RR 0.89, 95% CI 0.81 to 0.97 - Analysis 1.10). No significant differences were seen in subgroup interaction tests (37-39 weeks; 39-40 weeks; < 41 weeks; 41 weeks; > 41 weeks) - Analysis 1.10.
Operative vaginal birth (forceps or ventouse)
In the 12 trials of 6227 women that reported this outcome, the rate of operative vaginal birth was higher (of borderline significance) in the policy of labour induction groups compared with expectant management (RR 1.10, 95% CI 1.00 to 1.21) - Analysis 1.11. There was significant interaction between subgroups (P = 0.04) driven by a single trial (Breart 1982) which induced women at 37-39 weeks in the induction arm - Analysis 1.11.
Postpartum haemorrhage
Only two trials (757 women) reported rates of postpartum haemorrhage; both were induced women at > 41 weeks in the induction arms. There was no significant difference between labour induction and control groups for this outcome (RR 0.91, 95% CI 0.58 to 1.44) - Analysis 1.12.
Unreported outcomes
No trials reported maternal mental health outcomes, maternal satisfaction, breastfeeding or longer term outcomes such as infant or child neurodevelopment.
State of cervix subgroup analysis
With no statistically significant subgroup interaction tests, there were no clear differences between the favourable and unfavourable cervix subgroups for any outcomes (Analysis 2.1 to Analysis 2.12).
Funnel plots
Visual asymmetry was seen in funnel plots for perinatal death (Figure 3); meconium aspiration syndrome (Figure 4) and caesarean section (Figure 5). The asymmetry in the funnel plots for perinatal death and meconium aspiration is compatible with missing small negative trials but it is not clear if that is the reason for the asymmetry. For caesarean section, the funnel plot has a ‘flattened’ appearance, which does not lend itself to clear interpretation.
Figure 3. Funnel plot of comparison: 1 Labour induction versus expectant management by gestational age (all trials), outcome: 1.1 Perinatal death.

Figure 4. Funnel plot of comparison: 1 Labour induction versus expectant management by gestational age (all trials), outcome: 1.5 Meconium aspiration syndrome.

Figure 5. Funnel plot of comparison: 1 Labour induction versus expectant management by gestational age (all trials), outcome: 1.10 Caesarean section.

DISCUSSION
Since women with post-term pregnancies may go into spontaneous labour or may need to be induced at some point in the future, it is important to recognise that management choices are between inducing or not inducing at a particular time, as opposed to having or not having a spontaneous labour (Caughey 2009a; Keirse 2010). Thus this review evaluates trials where a policy of induction has been compared with a policy of waiting. In other words, women scheduled to be induced may not be; and women choosing to wait may end up being induced. For example, about one-third of the women randomised to the induction policy group in the Hannah trial were not induced; and about one-third of the women randomised to waiting or expectant management were induced (Hannah 1992; Keirse 2010).
We have presented the results by intended timing in the policy of labour induction arms of each trial (37- 39 weeks; 39 - 40 weeks; < 41 weeks; 41 weeks; and > 41 weeks) although a policy of induction at less than 41 weeks will no longer be clinically relevant in most settings.
In this 2011 update, we have added three new trials (Heimstad 2007a; Nielsen 2005; Sahraoui 2005). Compared with a policy of expectant management, a policy of labour induction was associated with fewer perinatal deaths (with one perinatal death in the labour induction policy group compared with 13 perinatal deaths in the expectant management group). The corresponding figures for a policy of induction at 41 weeks or more were one and 11 deaths. Although some trials excluded deaths from congenital anomalies, other trials did not exclude these deaths. If the three deaths reported to be due to congenital anomalies are excluded, the overall findings remain very similar.
Fewer babies in the labour induction at 41 to 42 weeks group had meconium aspiration syndrome compared with a policy of expectant management; and no significant difference between the rates of neonatal intensive care unit admission were seen.
There is concern about the high and increasing induction rate in many countries, and increasing caesarean rates despite an increase in induction rates (Keirse 2010). Reassuringly, in this review we found that there were significantly fewer caesarean sections in the induction groups compared with the expectant management groups.
In a recent report from Australia, the overall induction rate increased from 25% in 1998 to 29% in 2007 in New South Wales; the 2007 rate for induction of labour at 41 weeks was 51% (a 10% increase from 1998) and 56% at 42 weeks (a 1% increase from 1998) (Mealing 2009). This is similar to the overall induction rate seen in the Hannah 1992 trial.
However, the favourable results for caesarean births in the large Hannah 1992 trial have been questioned by some authors. They have pointed out that the women who were induced in the policy of induction group (66% of this group) may have had a more effective cervical ripening regimen than the women who were induced in the expectant management group (33% of this group) and that more women in the expectant management group had a caesarean section for fetal distress (8.3% versus 5.7% in the induction group) (Keirse 2010; Mandruzzato 2010).
In a recent retrospective cohort study, prolonged pregnancy was significantly more common in obese women than in normal weight women (30% versus 22%); leading to an increased rate of induction of labour ending in caesarean section for these obese women (28% versus 19% for normal weight women) (Arrowsmith 2011). Despite these higher caesarean rates, an obese woman with prolonged pregnancy would have a 60% chance of vaginal birth if primiparous and a 90% chance if multiparous based on these analyses (Arrowsmith 2011).
Compared with expectant management, induction of labour at 41 weeks in nulliparous women has been shown to be cost-effective; ranging from US$2932 to $21,612 per quality-adjusted life years (QALY) gained (Kaimal 2011). Using probabilistic sensitivity analyses, induction of labour in nulliparous women at 41 weeks would be a cost-effective intervention 96% of the time, if society was willing to bear the cost of $50,000 per QALY (Kaimal 2011).
Current obstetric guidelines from Canada (SOGC 2008) and the UK (NICE 2008) recommend offering induction of labour to women after 41 completed weeks, with fetal assessment and monitoring if expectant management is chosen, a policy which has been construed by some as a recommendation to routinely induce women at 41 weeks (Menticoglou 2002). Analyses of data from Norway indicate that a policy of routine induction at 41 weeks (287 days) would result in 240 inductions per 1000 compared with 90 per 1000 at induction at 42 weeks (293 days) or four per 1000 at 43 weeks (301 days) (Heimstad 2008) and the view has been expressed that the number of inductions needed to prevent one stillbirth is “very high” (Mandruzzato 2010) and indeed the number needed to ‘intend inducing’ of 416 to avoid one perinatal death is indeed large. However, a woman experiencing a prolonged pregnancy is the appropriate person to judge this threshold. There is evidence from a postpartum survey of women who participated in the Heimstad 2007a trial that most women would choose induction at 41 to 42 weeks in a subsequent pregnancy (Heimstad 2007b).
Potential biases in the review process
Included trials were generally at moderate risk of bias. Different trial protocols and methods often made comparisons difficult. Some examples of these differences are inclusion or exclusion of deaths attributed to congenital anomalies, different handling of post-randomisation exclusions and of course variations between - and sometimes within - trials in the methods used for cervical ripening and induction.
There is some indication of visual asymmetry in the funnel plots for perinatal death, meconium aspiration syndrome and caesarean section although publication bias may not be, and is probably unlikely to be, the reason for these asymmetric plots.
Agreements and disagreements with other studies or reviews
The most comparable systematic review is one done by Wennerholm and colleagues (Wennerholm 2009). We have included four more trials (all in the 41 weeks or more induction policy category) than Wennerholm 2009 in this update of our review. Inclusion of these trials (Henry 1969; Ocon 1997; Sahraoui 2005; Suikkari 1983) in our review indicates that a policy of induction of labour can prevent perinatal deaths whereas Wennerholm 2009 concludes that there were no significant differences between a policy of induction and expectant management for the outcome of perinatal death.
AUTHORS’ CONCLUSIONS
Implications for practice
The message from this review is that a policy of post-term induction is associated with fewer perinatal deaths (although the absolute risk is small) without an increased risk of caesarean section. Women should be offered the option of labour induction, probably at 41 to 42 completed weeks, with information about the absolute and relative risks of perinatal death at different gestational age time points and for different groups such as nulliparous or obese women, recognising that their assessments, values and preferences may differ. If a woman chooses to wait for spontaneous labour onset, it would be prudent to have regular fetal monitoring as longitudinal epidemiological studies suggest increased risk of perinatal death by increasing gestational age.
Implications for research
The optimal timing of offering induction of labour to women at or beyond term warrants further investigation, as does further exploration of risk profiles of women and their values and preferences.
PLAIN LANGUAGE SUMMARY.
Induction of labour in women with normal pregnancies at or beyond term
A normal pregnancy lasts about 40 weeks from the start of the woman’s last menstrual period, but anything from 37 to 42 weeks is considered as being within the normal range. Births before 37 weeks are considered preterm because these babies often have breathing difficulties and other problems as some of their organs are not yet fully matured. Births after 42 weeks seem to carry a slightly increased risk for the baby and are associated with a greater number of deaths. No tests can tell if a baby would be better to be left in the womb or labour induced and the baby be born, so arbitrary time limits have been suggested. This review set out to determine if induction of labour at a prespecified time could reduce the risks for the baby. The review found 22 trials involving over 9000 women given induction of labour at various times from 37 weeks to over 42 weeks’ gestation; some were quite old trials and the quality was variable. The review grouped the trials by a policy of induction at (1) 37 to 39 weeks, (2) 39 to 40 weeks, (3) < 41 weeks, (4) 41 weeks, and (5) > 41 weeks, compared with a policy of waiting to a later date. There were fewer baby deaths when a labour induction policy was implemented. Such deaths were rare with either policy. Signficantly fewer babies developed meconium aspiration syndrome and fewer caesarean sections were required in the induction group compared with the expectant management group. Women’s experiences and opinions about these choices have not been adequately evaluated.
ACKNOWLEDGEMENTS
NIHR, UK, provided funding to support the editorial processing of this update.
As part of the pre-publication editorial process, this review has been commented on by five peers (an editor and four referees who are external to the editorial team) and the Group’s Statistical Adviser.
SOURCES OF SUPPORT
Internal sources
HRP-UNDP/UNFPA/WHO/World Bank Special Programme in Human Reproduction, Geneva, Switzerland.
ARCH, Robinson Institute, Discipline of Obstetrics and Gynaecology, The University of Adelaide, Adelaide, Australia.
External sources
National Institute for Health Research, UK.
NIHR Programme of centrally-managed pregnancy and childbirth systematic reviews of priority to the NHS and users of the NHS: 10/4001/02
CHARACTERISTICS OF STUDIES
Characteristics of included studies [ordered by study ID]
| Methods | RCT. | |
|
| ||
| Participants | Number of women randomised: 409. | |
| Setting: Bergen, Norway. | ||
| Inclusion criteria | ||
|
||
| Exclusion criteria | ||
|
||
|
| ||
| Interventions | Induction group (n = 214): immediate induction with oxytocin (5 IU increased in a stepwise manner). GA at intervention 41+ weeks (290-297 days) versus | |
| expectant management group (n = 195): non-stress test (NST) every 3-4 days, IOL after 7 days | ||
|
| ||
| Outcomes | Baby: (1) Perinatal mortality, (2) Neonatal jaundice, (3) Meconium-stained amniotic fluid. | |
| Mother: (1) Caesarean section, (2) Assisted vaginal birth. | ||
|
| ||
| Notes | ||
|
| ||
| Risk of bias | ||
|
| ||
| Bias | Authors’ judgement | Support for judgement |
|
| ||
| Random sequence generation (selection bias) | Low risk | List of random numbers. |
|
| ||
| Allocation concealment (selection bias) | Unclear risk | Allocation concealment was unclear given that it was not undertaken by a staff member or team clearly uninvolved in the trial. It was reported that the midwife undertook allocation using a random number list, and this list was inaccessible to the participating physicians |
|
| ||
| Blinding of participants and personnel (performance bias) All outcomes | High risk | Appears that blinding was not feasible. |
|
| ||
| Blinding of outcome assessment (detection bias) | Unclear risk | Blind outcome assessment was not mentioned. |
| All outcomes | ||
|
| ||
| Incomplete outcome data (attrition bias) | Low risk | 4/214 in the IOL group went into labour before IOL but data for these women have been included in the IOL group for analyses |
| All outcomes | ||
|
| ||
| Selective reporting (reporting bias) | Low risk | No outcomes were pre-specified in the methods, but all expected outcomes were reported |
|
| ||
| Other bias | Low risk | Appears to be free of other bias. |
| Methods | RCT. | |
|
| ||
| Participants | Number of women randomised: 188. | |
| Setting: Wuhan, Hubei province, China. | ||
| Inclusion criteria | ||
|
||
| Exclusion criteria | ||
| • No additional criteria. | ||
| Cervix ripeness: not mentioned. | ||
|
| ||
| Interventions | Induction group (n = 94): stripping of membranes followed by oxytocin infusion and AROM if cervix sufficiently dilated. GA for intervention: 42 completed weeks (294 days) | |
| versus | ||
| expectant management group (n = 94): no intervention for 1 week, IOL at 43 weeks. | ||
|
| ||
| Outcomes | Mother: (1) Operative birth, (2) Duration of labour, (3) Breastfeeding (timing of recording of this outcome in relation to birth or discharge time was not specified) | |
|
| ||
| Notes | ||
|
| ||
| Risk of bias | ||
|
| ||
| Bias | Authors’ judgement | Support for judgement |
|
| ||
| Random sequence generation (selection bias) | Low risk | The randomisation method used was a list of random numbers. |
|
| ||
| Allocation concealment (selection bias) | Unclear risk | Allocation concealment was not reported. |
|
| ||
| Blinding of participants and personnel (performance bias) | High risk | Appears that blinding was not feasible. |
| All outcomes | ||
|
| ||
| Blinding of outcome assessment (detection bias) | Unclear risk | Blind outcome assessment was not mentioned. |
| All outcomes | ||
|
| ||
| Incomplete outcome data (attrition bias) | Low risk | 8/94 in IOL group went into labour before IOL but were kept in the allocated group |
| All outcomes | ||
|
| ||
| Selective reporting (reporting bias) | Unclear risk | Most pre-specified outcomes were reported; however, limited information was provided for some outcomes (e.g. combined maternal complications) |
|
| ||
| Other bias | Low risk | Appears to be free of other bias. |
| Methods | RCT (1:2 randomisation). | |
|
| ||
| Participants | Number of women randomised: 716. | |
| Setting: Paris, France. | ||
| Inclusion criteria: gestational age: 37-39 weeks. | ||
| Exclusion criteria: high risk, contraindication for IOL. | ||
| Cervix ripeness: not mentioned. | ||
|
| ||
| Interventions | Induction group (n = 235): oxytocin and AROM at GA 37-39 weeks | |
| versus | ||
| expectant management group (n = 481): fetal heart rate checking and amnioscopy every 2-3 days | ||
|
| ||
| Outcomes | Mother: duration of labour, mode of birth. | |
| Baby: morbidity (Apgar scores, resuscitation). | ||
|
| ||
| Notes | ||
|
| ||
| Risk of bias | ||
|
| ||
| Bias | Authors’ judgement | Support for judgement |
|
| ||
| Random sequence generation (selection bias) | Unclear risk | The sequence generation method was not reported. |
|
| ||
| Allocation concealment (selection bias) | Unclear risk | It was reported that a closed envelope system was used for allocation concealment, although no further detail was available |
|
| ||
| Blinding of participants and personnel (performance bias) | High risk | Blinding of participants was not done. |
| All outcomes | ||
|
| ||
| Blinding of outcome assessment (detection bias) | Unclear risk | Blind outcome assessment was not mentioned. |
| All outcomes | ||
|
| ||
| Incomplete outcome data (attrition bias) | Unclear risk | 202/235 in the induction group and 173/481 in the expectant group followed the trial protocol; trial results were reported for all 716 women and their babies |
| All outcomes | ||
|
| ||
| Selective reporting (reporting bias) | High risk | Perinatal mortality was not reported; Apgar score was reported as 7 or less at 5 min (instead of the more standard < 7 at 5 min) |
|
| ||
| Other bias | Low risk | Appears to be free of other bias. |
| Methods | RCT. | |
|
| ||
| Participants | Number of women randomised: 231. | |
| Setting: Calcutta, India. | ||
| Inclusion criteria | ||
|
||
|
| ||
| Interventions | Induction group (n = 117): IOL, no details of the method are available | |
| versus | ||
| expectant management group (n = 114 randomised): daily fetal movement counts, biophysical profile and ultrasound; IOL after 1 week | ||
|
| ||
| Outcomes | Only caesarean section rates were adequately reported in the abstract | |
|
| ||
| Notes | Reported as conference abstract in 2000. No journal manuscript was identified | |
|
| ||
| Risk of bias | ||
|
| ||
| Bias | Authors’ judgement | Support for judgement |
|
| ||
| Random sequence generation (selection bias) | Unclear risk | The method of sequence generation was not reported. |
|
| ||
| Allocation concealment (selection bias) | Unclear risk | The method of allocation concealment was not reported. |
|
| ||
| Blinding of participants and personnel (performance bias) | High risk | Appears that blinding was not feasible. |
| All outcomes | ||
|
| ||
| Blinding of outcome assessment (detection bias) | Unclear risk | Blind outcome assessment was not mentioned. |
| All outcomes | ||
|
| ||
| Incomplete outcome data (attrition bias) | Low risk | Appears to be no missing data. 54/117 (46%) in the expectant management group had spontaneous labour within 1 week |
| All outcomes | ||
|
| ||
| Selective reporting (reporting bias) | Unclear risk | No outcomes were pre-specified in the methods (conference abstract) |
| It was reported in the abstract that: “Neonatal mortality and morbidity were unaltered in this group of 231 patients”. This implies that there were no neonatal deaths, although the statement is ambiguous | ||
|
| ||
| Other bias | Unclear risk | Unable to identify other bias based on the abstract. |
| Methods | RCT. | |
|
| ||
| Participants | Number of women randomised: 249. | |
| Setting: Bangkok, Thailand. | ||
| Inclusion criteria | ||
|
||
| Exclusion criteria | ||
| • No additional criteria. | ||
| Cervix ripeness: favourable (Bishop score 6 or more). | ||
|
| ||
| Interventions | Induction group (n = 124): AROM + oxytocin (if uterine contractions inadequate after 2 hours); | |
| versus | ||
| expectant management group (n = 125): spontaneous labour awaited unless 1) nonre-active NST or 2) amniotic fluid index < 5 cm or 3) medical or obstetric indication for birth or 4) reaching 44 completed weeks | ||
|
| ||
| Outcomes | Mother: mode of birth and their indications, death. | |
| Baby: perinatal deaths. | ||
|
| ||
| Notes | ||
|
| ||
| Risk of bias | ||
|
| ||
| Bias | Authors’ judgement | Support for judgement |
|
| ||
| Random sequence generation (selection bias) | Low risk | Randomisation was carried out using computer-generated numbers |
|
| ||
| Allocation concealment (selection bias) | Unclear risk | The method of allocation concealment was not reported. |
|
| ||
| Blinding of participants and personnel (performance bias) | High risk | Appears that blinding was not feasible. |
| All outcomes | ||
|
| ||
| Blinding of outcome assessment (detection bias) | Unclear risk | Blind outcome assessment was not mentioned. |
| All outcomes | ||
|
| ||
| Incomplete outcome data (attrition bias) | Low risk | 1 women (in IOL group) excluded after randomisation because of misclassification (breech presentation). No loss to follow-up |
| All outcomes | ||
|
| ||
| Selective reporting (reporting bias) | Low risk | All pre-specified outcomes were reported, no apparent evidence of selective reporting |
|
| ||
| Other bias | Low risk | Appears to be free of other bias. |
| Methods | Randomly allocated, no further details available. | |
|
| ||
| Participants | Number of women randomised: 228. | |
| Setting: Glasgow, Scotland. | ||
| Inclusion criteria | ||
|
||
| Cervical ripeness: not a criterion. | ||
|
| ||
| Interventions | Induction group (n = 111): IOL with AROM + oxytocin | |
| versus | ||
| expectant management group (n = 117): no intervention until 41 weeks, thereafter IOL. | ||
|
| ||
| Outcomes | Baby: (1) Perinatal deaths (2) Meconium staining (3) Apgar scores (4) Birthweight (5) Neonatal jaundice | |
| Mother: (1) Mode of birth (including operative versus non operative), (2) Length of labour, (3) Analgesia requirements, (4) Postpartum blood loss | ||
|
| ||
| Notes | ||
|
| ||
| Risk of bias | ||
|
| ||
| Bias | Authors’ judgement | Support for judgement |
|
| ||
| Random sequence generation (selection bias) | Unclear risk | The method of sequence generation was not reported. |
|
| ||
| Allocation concealment (selection bias) | Unclear risk | The method ofallocation concealment was not reported. |
|
| ||
| Blinding of participants and personnel (performance bias) | High risk | It appears that blinding was not feasible. |
| All outcomes | ||
|
| ||
| Blinding ofoutcome assessment (detection bias) | Unclear risk | Blind outcome assessment was not mentioned. |
| All outcomes | ||
|
| ||
| Incomplete outcome data (attrition bias) | Unclear risk | 7/118 and 2/119 in the intervention and control groups excluded after randomisation because of misclassification as low risk |
| All outcomes | ||
|
| ||
| Selective reporting (reporting bias) | Low risk | No outcomes were pre-specified in the methods, but all expected outcomes were reported |
|
| ||
| Other bias | Low risk | Appears to be free of other bias. |
| Methods | RCT. | |
|
| ||
| Participants | Number of women randomised: 302. | |
| Setting: Kaiser Permanente Medical Care Hospital in California, USA | ||
| Inclusion criteria | ||
|
||
| Exclusion criteria | ||
|
||
|
| ||
| Interventions | Induction group (n = 152): prostaglandin E2 gel (initially 3 mg but later reduced to 0. 5 mg). If no labour in 24 hours, repeat prostaglandin E2 and oxytocin if needed | |
| versus | ||
| expectant management group (n = 150): NST twice weekly, pelvic examination and amniotic fluid determination weekly between 41-42 weeks and twice weekly afterwards | ||
| Number of participants randomised to intervention group: 152 | ||
| Number of participants randomised to control group: 150. | ||
|
| ||
| Outcomes | Baby: (1) perinatal death (2) 1 min Apgar score < 7 (3) 5 min Apgar score < 7 (3) Meconium-stained amniotic fluid (4) Meconium aspiration syndrome (4) Post-maturity syndrome (5) Fetal distress (6) Infant hospital stay length | |
| Mother: (1) Length of hospital stay (2) Caesarean section (3) Length of labour | ||
|
| ||
| Notes | ||
|
| ||
| Risk of bias | ||
|
| ||
| Bias | Authors’ judgement | Support for judgement |
|
| ||
| Random sequence generation (selection bias) | Low risk | A table of random numbers was used. |
|
| ||
| Allocation concealment (selection bias) | Unclear risk | The authors reported “using a series of consecutively numbered, sealed envelopes...” for allocation concealment, but no mention was made of envelope opaqueness |
|
| ||
| Blinding of participants and personnel (performance bias) | High risk | Appears that blinding was not feasible. |
| All outcomes | ||
|
| ||
| Blinding of outcome assessment (detection bias) | Unclear risk | Blind outcome assessment was not mentioned. |
| All outcomes | ||
|
| ||
| Incomplete outcome data (attrition bias) | Low risk | No loss to follow-up or post-randomisation exclusions reported |
| All outcomes | ||
|
| ||
| Selective reporting (reporting bias) | Low risk | No outcomes were pre-specified in the methods, but all expected outcomes were reported |
|
| ||
| Other bias | Low risk | Appears to be free of other bias. |
| Methods | RCT. | |
|
| ||
| Participants | 345 women randomised. | |
| Setting: Vienna, Austria. | ||
| Inclusion criteria | ||
|
||
| Exclusion criteria | ||
| • Any fetal or maternal risk factors based on history, gynaecological/obstetrical investigation, CTG and routine lab results. | ||
| Cervix ripeness: favourable (Modified Bishop score > 4). | ||
|
| ||
| Interventions | Induction group (n = 180): vaginal prostaglandin E2 (PGE2) (3 mg) tablets repeated 6 and 24 hours later if no active labour | |
| versus | ||
| expectant management group (n = 165): spontaneous labour awaited until 42 weeks. NST monitoring every 2-3 days | ||
|
| ||
| Outcomes | Mother: (1) Delivery interval (onset of contractions to delivery in hours) (2) Rate and indication for operative delivery | |
| Baby: (1) Birthweight (2) Length of baby at birth (3) Incidence of meconium-stained amniotic fluid (4) Apgar scores (5) Results of umbilical cord pH determination (6) Perinatal death | ||
|
| ||
| Notes | ||
|
| ||
| Risk of bias | ||
|
| ||
| Bias | Authors’ judgement | Support for judgement |
|
| ||
| Random sequence generation (selection bias) | Unclear risk | The method of sequence generation was not reported. |
|
| ||
| Allocation concealment (selection bias) | Unclear risk | The method of allocation concealment was not reported. |
|
| ||
| Blinding of participants and personnel (performance bias) | High risk | Appears that blinding was not feasible. |
|
| ||
| All outcomes | ||
|
| ||
| Blinding of outcome assessment (detection bias) | Unclear risk | Blind outcome assessment was not mentioned. |
| All outcomes | ||
|
| ||
| Incomplete outcome data (attrition bias) | Unclear risk | 8/180 women in the induction group refused to be induced; and 3/165 women in the expectant group requested induction; and these 11 women were excluded from analysis post-randomisation |
| All outcomes | ||
|
| ||
| Selective reporting (reporting bias) | Unclear risk | No outcomes were pre-specified in the methods, limited information was provided for some outcomes (birthweight, Apgar scores, etc.) |
|
| ||
| Other bias | Unclear risk | Appears to be free of other bias, although some imbalance in the numbers randomised to each group (180 versus 165) |
| Methods | RCT. | |
|
| ||
| Participants | Number of women randomised: 600. | |
| Setting: Teaching hospital in Ankara, Turkey. | ||
| Inclusion criteria | ||
|
||
| Exclusion criteria | ||
|
||
| Cervix ripeness: unfavourable - Bishop score < 5. | ||
| Just under half the women nulliparous. | ||
|
| ||
| Interventions | Induction group: labour induction (3 methods) | |
| (1) vaginal administration of 50 mg misoprostol (n = 100), | ||
| (2) oxytocin induction (n = 100), and | ||
| (3) transcervical insertion of a Foley balloon (n = 100) | ||
| versus | ||
| expectant management group: spontaneous follow-up with twice-weekly nonstress testing and amniotic fluid measurement and once-weekly biophysical scoring (n = 300) ; 24% of women were induced after 42 completed weeks | ||
|
| ||
| Outcomes | Mother: (1) Oligohydramnios (2) Pre-eclampsia (3) Meconium stained amniotic fluid (4) Tachysystole (5) Hyperstimulation (6) Vaginal delivery (7) Emergent abdominal delivery for worrying FHR (8) Failed IOL. | |
| Baby: (1) Shoulder dystocia (2) Meconium aspiration syndrome (3) Fetal anomaly (4) Low Apgar scores (<7) (5) umbilical artery pH <7.16 (6) NICU admission (7) Fetal macrosomia (8) Birthweight (9) Length of hospital stay | ||
|
| ||
| Notes | ||
|
| ||
| Risk of bias | ||
|
| ||
| Bias | Authors’ judgement | Support for judgement |
|
| ||
| Random sequence generation (selection bias) | Unclear risk | The method of sequence generation was not reported. |
|
| ||
| Allocation concealment (selection bias) | Unclear risk | Allocation concealment was by sealed, opaque envelopes but there is no mention of numbering and sequential opening of the envelopes |
|
| ||
| Blinding of participants and personnel (performance bias) | High risk | No blinding: “Staff members in charge of labor were not blinded to the type of medication used for induction” |
| All outcomes | ||
|
| ||
| Blinding ofoutcome assessment (detection bias) | Unclear risk | Blind outcome assessment not mentioned. |
| All outcomes | ||
|
| ||
| Incomplete outcome data (attrition bias) | Low risk | No missing data were reported. |
| All outcomes | ||
|
| ||
| Selective reporting (reporting bias) | Low risk | All pre-specified outcomes were reported, no apparent evidence of selective reporting |
|
| ||
| Other bias | Low risk | Appears to be free of other bias. |
| Methods | RCT. | |
|
| ||
| Participants | Number of women randomised: 3418 enrolled (data available only for 3407 women). | |
| Setting: 22 hospitals across Canada. | ||
| Inclusion criteria | ||
|
||
| Exclusion criteria | ||
|
||
| Cervix ripeness: unfavourable at trial entry (first ripening and then IOL in the intervention group) | ||
|
| ||
| Interventions | Induction group (n = 1701): up to 3 x 0.5 mg doses of prostaglandin E2 gel administered intracervically (if NST was normal and cervix unfavourable at time of induction = 77% of women), followed by either AROM or IV oxytocin infusion, or both | |
| Expectant management group (n = 1706): daily fetal movement counting, NST and amniotic fluid measurement 2-3 times per week. If either the NST or amniotic fluid volume assessment was abnormal, or other complications developed, labour was induced (28% of women induced in the expectant group received some form of prostaglandin E2 (not gel)). | ||
|
| ||
| Outcomes | Mother: (1) Delivery by caesarean section. | |
| Baby: (1) Perinatal mortality (stillbirth or neonatal death before discharge excluding deaths caused by lethal congenital abnormalities) | ||
| (2) Neonatal morbidity (Apgar score < 7 at 5 min, asphyxial encephalopathy [seizures, alterations in levels of consciousness or tone, or a need for tube feeding during the first 48 hours of life], or respiratory distress [oxygen requirement > 40% and respiratory rate > 60 breaths/minute, both within 12 hours after birth and persisting for more than 24 hours, or assisted ventilation for more than 24 hours]) | ||
|
| ||
| Notes | Most women (89%) were enrolled at 41 0/7 to 41 6/7 weeks’ gestation (3% before 41 weeks and 8% at or beyond 42 weeks), of whom 86.2% in the induced group and 63. 6% in the expectant group gave birth before 42 weeks’ gestation | |
| In the induction group, 31% of women were not induced and in the expectant management group, 34% of women were induced | ||
|
| ||
| Risk of bias | ||
|
| ||
| Bias | Authors’ judgement | Support for judgement |
|
| ||
| Random sequence generation (selection bias) | Unclear risk | The method of randomisation sequence generation was not reported |
|
| ||
| Allocation concealment (selection bias) | Low risk | Randomisation was carried out at a site separate from the trial (“centrally controlled at McMaster University”) |
|
| ||
| Blinding of participants and personnel (performance bias) | High risk | Not feasible. |
| All outcomes | ||
|
| ||
| Blinding of outcome assessment (detection bias) | Unclear risk | The study was partially blinded; an adjudication of abnormal neonatal outcomes was undertaken by a neonatologist who was unaware of the mothers’ group assignments |
| All outcomes | ||
|
| ||
| Incomplete outcome data (attrition bias) | Low risk | 7 women whose babies had lethal congenital anomalies were excluded after randomisation from the analysis of perinatal and neonatal outcomes - induction group (1 woman) and monitoring group (6 women). These post-randomisation exclusions could have impacted on the perinatal death outcome |
| All outcomes | ||
|
| ||
| Selective reporting (reporting bias) | Low risk | All pre-specified outcomes were reported. There was no apparent evidence of selective reporting |
|
| ||
| Other bias | Low risk | Appears to be free of other bias; although methods of induction differed between the induction group and the women requiring induction in the expectant management group |
| Methods | RCT. | |
|
| ||
| Participants | Number of women randomised: 508. | |
| Setting: St. Olavs University Hospital, Trondheim, Norway. | ||
| Inclusion criteria | ||
|
||
| Cervix ripeness: all stages included. | ||
|
| ||
| Interventions | Induction group (n = 254): if cervix favourable (Bishop score ≥ 6) AROM (amniotomy) + oxytocin, if not (Bishop score < 6) 50 mcg misoprostol vaginally | |
| versus | ||
| expectant management group (n = 254): twice-weekly ultrasound and cardiotocography, labour induction after 300 days of pregnancy | ||
|
| ||
| Outcomes | Mother: mode of birth. | |
| Baby: perinatal and neonatal mortality, neonatal morbidity, for which a score was tallied (by evaluating the degree of deviation from the potential of a perfect outcome for each newborn as defined by the authors) | ||
|
| ||
| Notes | ||
|
| ||
| Risk of bias | ||
|
| ||
| Bias | Authors’ judgement | Support for judgement |
|
| ||
| Random sequence generation (selection bias) | Low risk | Computerised randomisation using blocks of 16 with no stratification |
|
| ||
| Allocation concealment (selection bias) | Low risk | Central allocation - clinical trials office. |
|
| ||
| Blinding of participants and personnel (performance bias) | High risk | Appears that blinding was not feasible. |
| All outcomes | ||
|
| ||
| Blinding of outcome assessment (detection bias) | Unclear risk | Blind outcome assessment was not mentioned. |
| All outcomes | ||
|
| ||
| Incomplete outcome data (attrition bias) | Low risk | Loss to follow-up in phone interview: 12 women (4 in induction group and 8 in monitoring group) |
| All outcomes | ||
| Loss to follow-up in questionnaire: 8 women. | ||
| 2/254 in labour induction group and 1/254 in expectant management group declined participation after randomisation; but these women were included in the analysis | ||
| Otherwise, no loss to follow-up reported. | ||
|
| ||
| Selective reporting (reporting bias) | Low risk | All pre-specified outcomes were reported, no apparent evidence of selective reporting |
|
| ||
| Other bias | Low risk | Appears to be free of other bias. |
| Methods | RCT with inadequately reported randomisation methods. | |
|
| ||
| Participants | Number of women randomised: 112. | |
| Setting: Birmingham, United Kingdom. | ||
| Inclusion criteria | ||
|
||
| Exclusion criteria | ||
| • Not specified. | ||
| Cervix ripeness: not mentioned as a criterion. | ||
|
| ||
| Interventions | Induction group (n = 55): AROM (amniotomy) and oxytocin | |
| versus | ||
| expectant management group (n = 57): weekly amnioscopy. | ||
| Number of participants randomised to intervention (surgical) group: 55 | ||
| Number of participants randomised to control (amnioscopy) group: 57 | ||
|
| ||
| Outcomes | Mother: (1) Number of days past term (2) Mode of birth. | |
| Baby: (1) Perinatal death. | ||
|
| ||
| Notes | 4 women in expectant group and 1 in induction group were randomised before 41 weeks | |
|
| ||
| Risk of bias | ||
|
| ||
| Bias | Authors' judgement | Support for judgement |
|
| ||
| Random sequence generation (selection bias) | Unclear risk | The method of sequence generation was not reported. |
|
| ||
| Allocation concealment (selection bias) | Unclear risk | The method ofallocation concealment was not reported. |
|
| ||
| Blinding of participants and personnel (performance bias) | High risk | Appears that blinding was not feasible. |
| All outcomes | ||
|
| ||
| Blinding of outcome assessment (detection bias) | Unclear risk | Blind outcome assessment was not mentioned. |
| All outcomes | ||
|
| ||
| Incomplete outcome data (attrition bias) | Low risk | No loss to follow-up or exclusions reported. |
| All outcomes | ||
|
| ||
| Selective reporting (reporting bias) | Unclear risk | No outcomes were pre-specified in the methods, but the study reported perinatal death, mode of birth including caesarean rate |
|
| ||
| Other bias | Low risk | Appears to be free of other bias. |
| Methods | RCT. | |
|
| ||
| Participants | Number of women randomised: 108. | |
| Setting: Bangkok, Thailand. | ||
| Inclusion criteria | ||
|
||
| Exclusion criteria | ||
| • Bishop score of > 6 were judged to have a favourable cervix and were excluded from the study. | ||
| Cervix ripeness: unfavourable cervix (Bishop score 6 or less) | ||
|
| ||
| Interventions | Induction group (n = 57): PGE2 intracervical, repeated after 6 hours, AROM and oxytocin on day 2 according to contractions | |
| versus | ||
| expectant management group (n = 51): a) NST between 42 and 43 completed weeks. 2) NST between 43 and 44 completed weeks; women underwent IOL if there were abnormalities in antepartum fetal testing as nonreactive NST, or variable decelerations on NST or if Bishop score > 6 on reaching 44 completed weeks’ gestation | ||
|
| ||
| Outcomes | Mother: (1) Length of first stage of labour (2) Mode of birth (3) Cephalopelvic disproportion (4) Fetal distress (5) Birthweight | |
| Baby: (1) Meconium staining (2) Apgar score < 7 at 1 min (3) Apgar score < 7 at 5 min (4) Intubation required (5) Admission to special care baby unit (6) Perinatal death | ||
|
| ||
| Notes | ||
|
| ||
| Risk of bias | ||
|
| ||
| Bias | Authors’ judgement | Support for judgement |
|
| ||
| Random sequence generation (selection bias) | Unclear risk | Sequence generation method not reported. |
|
| ||
| Allocation concealment (selection bias) | Unclear risk | Allocation concealment method not reported. |
|
| ||
| Blinding of participants and personnel (performance bias) | High risk | Appears that blinding was not feasible. |
| All outcomes | ||
|
| ||
| Blinding of outcome assessment (detection bias) | Unclear risk | Blind outcome assessment was not mentioned. |
| All outcomes | ||
|
| ||
| Incomplete outcome data (attrition bias) | Low risk | No loss to follow-up. No post-randomisation exclusions reported |
| All outcomes | ||
|
| ||
| Selective reporting (reporting bias) | Low risk | No outcomes were pre-specified in the methods, however all expected outcomes were reported |
|
| ||
| Other bias | Low risk | Appears to be free of other bias. |
| Methods | RCT. | |
|
| ||
| Participants | Number of women randomised: 74. | |
| Setting: Vellore, India. | ||
| Inclusion criteria | ||
|
||
| Exclusion criteria | ||
| • Presence of risk factors known to increase perinatal mortality and morbidity such as chronic hypertension, pre-eclampsia, maternal diabetes mellitus, fetal growth retardation, multiple gestation, hydramnios, premature rupture of membranes, antepartum haemorrhage and previous caesarean section. | ||
| Cervix ripeness: not mentioned as a criterion. | ||
|
| ||
| Interventions | Induction group (n = 37): | |
| Bishop < 5: cervical ripening with extra-amniotically placed 16F Foley catheter with 20 mL of saline | ||
| Bishop > 5: stripping of membranes. | ||
| Then, 12 hours later, IOL by AROM and oxytocin infusion | ||
| versus | ||
| expectant management group (n = 37): daily fetal movement counts; biophysical profile every second day | ||
| Number of participants randomised to intervention group: 37. | ||
| Number of participants randomised to control group: 37. | ||
|
| ||
| Outcomes | Baby: (1) Meconium staining of amniotic fluid (2) Meconium aspiration (3) Apgar scores [1 and 5 min] (4) Need for neonatal intubation (5) Birthweight (6) Signs of post maturity (7) Perinatal deaths (8) Abnormal electronic fetal trace monitoring Mother: (1) Mode of delivery and indications (2) Duration of labour (3) Mean hospital stay | |
|
| ||
| Notes | ||
|
| ||
| Risk of bias | ||
|
| ||
| Bias | Authors’ judgement | Support for judgement |
|
| ||
| Random sequence generation (selection bias) | Low risk | A table of random numbers was used for randomisation. |
|
| ||
| Allocation concealment (selection bias) | Unclear risk | Allocation concealment was unclear since “... a series of consecutively numbered, sealed envelopes...” was used but no mention was made of opaqueness of the envelopes |
|
| ||
| Blinding of participants and personnel (performance bias) | High risk | Appears that blinding was not feasible. |
| All outcomes | ||
|
| ||
| Blinding of outcome assessment (detection bias) | Unclear risk | Blind outcome assessment was not mentioned. |
| All outcomes | ||
|
| ||
| Incomplete outcome data (attrition bias) | Low risk | No loss to follow-up or post-randomisation exclusion. |
| All outcomes | ||
|
| ||
| Selective reporting (reporting bias) | Low risk | All of the outcomes mentioned in the methods section were reported on in the results section |
|
| ||
| Other bias | Low risk | Appears to be free of other bias. |
| Methods | RCT. | |
|
| ||
| Participants | Number of women randomised: 22. | |
| Setting: Jackson, USA. | ||
| Inclusion criteria | ||
|
||
| Exclusion criteria | ||
|
||
| Cervix ripeness: unripe cervix (Bishop score 5 or less) included | ||
|
| ||
| Interventions | Induction group (n =12): laminaria tents followed by oxytocin | |
| versus | ||
| expectant management group (n = 10): weekly ultrasound for amniotic fluid assessment and NST | ||
|
| ||
| Outcomes | Mother: (1) Mode of birth (2) Length of labour (3) Type of analgesia (4) Length of hospital stay (5) Labour-associated morbidity | |
| Baby: (1) Birthweight (2) Apgar score perinatal deaths (3) Neonatal course (4) Meconium staining | ||
|
| ||
| Notes | ||
|
| ||
| Risk of bias | ||
|
| ||
| Bias | Authors’ judgement | Support for judgement |
|
| ||
| Random sequence generation (selection bias) | Unclear risk | The method of sequence generation was not reported. |
|
| ||
| Allocation concealment (selection bias) | Unclear risk | Allocation in sealed envelopes but no mention of opaqueness, numbering and sequential opening envelopes |
|
| ||
| Blinding of participants and personnel (performance bias) | High risk | Appears that blinding was not feasible. |
| All outcomes | ||
|
| ||
| Blinding of outcome assessment (detection bias) | Unclear risk | Blind outcome assessment was not mentioned. |
| All outcomes | ||
|
| ||
| Incomplete outcome data (attrition bias) | Low risk | No loss to follow-up or post-randomisation exclusion reported |
| All outcomes | ||
|
| ||
| Selective reporting (reporting bias) | Low risk | No outcomes were pre-specified in the methods, however all expected outcomes were reported |
|
| ||
| Other bias | Low risk | Appears to be free of other bias. |
| Methods | RCT. | |
|
| ||
| Participants | Number of women randomised: 440. | |
| Setting: University hospitals in the USA. | ||
| Inclusion criteria | ||
|
||
| Exclusion criteria | ||
| • Any medical or obstetric complications requiring IOL, caesarean section or frequent monitoring of maternal or fetal condition. | ||
| Cervix ripeness: unfavourable (Bishop score 6 or less).. | ||
|
| ||
| Interventions | Induction group (n = 174): 1) cervical priming with PGE2 gel followed 12 hours later with oxytocin | |
| versus | ||
| expectant management group (n = 175): weekly cervix assessments, twice weekly NST and amniotic fluid volume assessment (n = 175) | ||
| A total of 265 women were randomised to the intervention arm; however, 91 of these women were randomised to placebo gel with oxytocin 12 hours later and these women have not been included in this review | ||
|
| ||
| Outcomes | Mother: (1) Time to delivery from randomisation (2) Maternal infection (3) Need for transfusion (4) Uterine hyperactivity (5) Mode of birth (6) Maternal death. | |
| Baby: (1) Mechanical ventilation (2) Nerve injury (3) Seizures (4) Babies with 1 adverse outcome (5) Perinatal death (6) Apgar score < 4 at 5 mins (counted as NICU admission) (7) Late decelerations in labour (8) Meconium in amniotic fluid (9) Meconium in aspiration pneumonia | ||
|
| ||
| Notes | The initial sample size intended was 2800. However, after 18 months and 440 participants, the study was stopped, since the incidence of adverse outcome was only 1.1% and therefore a sample size of 5600 would be required to adequately test the hypothesis proposed | |
|
| ||
| Risk of bias | ||
|
| ||
| Bias | Authors’ judgement | Support for judgement |
|
| ||
| Random sequence generation (selection bias) | Low risk | The randomisation sequence generation was performed using a computer-generated randomisation scheme stratified by site and gestational age |
|
| ||
| Allocation concealment (selection bias) | Low risk | Allocation was concealed by using central allocation by a data co-ordinating centre |
|
| ||
| Blinding of participants and personnel (performance bias) | High risk | Appears that blinding was not feasible. |
| All outcomes | ||
|
| ||
| Blinding of outcome assessment (detection bias) | Unclear risk | Blind outcome assessment was not mentioned. |
| All outcomes | ||
|
| ||
| Incomplete outcome data (attrition bias) | Low risk | No loss to follow-up reported. |
| All outcomes | ||
|
| ||
| Selective reporting (reporting bias) | Low risk | All pre-specified outcomes were reported, no apparent evidence of selective reporting |
|
| ||
| Other bias | Low risk | Appears to be free of other bias. |
| Methods | RCT. | |
|
| ||
| Participants | Number of women randomised: 226. | |
| Setting: Army Medical Center, Tacoma, Washington, USA. | ||
| Inclusion criteria | ||
|
||
| Exclusion criteria | ||
| • No additional criteria. | ||
| Cervix ripeness: favourable (≥ 5 for nulliparous and ≥ 4 for multiparous women) | ||
|
| ||
| Interventions | Induction group (n = 116): AROM (amniotomy), oxytocin or both | |
| versus | ||
| expectant management group (n = 110): weekly follow-up until 42 weeks. Labour induced after 42 weeks. Weekly monitoring with cardiotocography and ultrasound, increased to twice a week after 41 weeks | ||
|
| ||
| Outcomes | Mother: (1) Randomisation to delivery interval (2) Admission to delivery interval (3) Indication for admission (4) Epidural analgesia (5) Mode of birth (6) EBL (6) Length of labour (7) Chorioamnionitis (8) Postpartum days | |
| Baby: (1) Birthweight (2) Admission to NICU (3) Apgar score < 7 | ||
|
| ||
| Notes | The study was discontinued after recruitment of 226 women (target of 600) due to slow recruitment and no observed difference in the 2 groups | |
|
| ||
| Risk of bias | ||
|
| ||
| Bias | Authors’ judgement | Support for judgement |
|
| ||
| Random sequence generation (selection bias) | Low risk | The randomisation sequence was generated using a computer-generated list |
|
| ||
| Allocation concealment (selection bias) | Low risk | Allocation concealment was achieved using sequentially numbered, opaque, sealed envelopes |
|
| ||
| Blinding of participants and personnel (performance bias) | High risk | Appears that blinding was not feasible. |
| All outcomes | ||
|
| ||
| Blinding of outcome assessment (detection bias) | Unclear risk | Blind outcome assessment was not mentioned. |
| All outcomes | ||
|
| ||
| Incomplete outcome data (attrition bias) | Low risk | No loss to follow-ups and post randomisation exclusions. 23/ 116 (19.8%) in induction group went into spontaneous labour, 10/110 (9.1%) in the expectant management group required labour induction and results for these women were analysed according to which group they were randomised to |
| All outcomes | ||
|
| ||
| Selective reporting (reporting bias) | High risk | Perinatal death was not reported and only 3 neonatal outcomes were reported |
|
| ||
| Other bias | Low risk | Appears to be free ofother bias. |
| Methods | RCT (partially translated). | |
|
| ||
| Participants | Number of women randomised: 113. | |
| Setting: Gran Canaria, Spain. | ||
| Inclusion criteria | ||
|
||
| Exclusion criteria | ||
| • Unknown, not in translation. | ||
| Cervix ripeness: unfavourable (Bishop score < 5). | ||
|
| ||
| Interventions | Induction group (n = 57): Intracervical PGE2 gel (0.5 mg); unclear whether further intervention occurred (full translation not available); | |
| versus | ||
| expectant management group (n = 56): monitoring by NST, biophysical profile and amnioscopy | ||
|
| ||
| Outcomes | Mother: (1) Time to birth, (2) Mode of birth. | |
| Baby: (1) Meconium staining (other outcomes may have been present, but were not reported in the translation) | ||
|
| ||
| Notes | ||
|
| ||
| Risk of bias | ||
|
| ||
| Bias | Authors’ judgement | Support for judgement |
|
| ||
| Random sequence generation (selection bias) | Unclear risk | The method of sequence generation was not reported according to the translation |
|
| ||
| Allocation concealment (selection bias) | Unclear risk | The method of allocation concealment was not reported according to the translation |
|
| ||
| Blinding of participants and personnel (performance bias) | High risk | Appears that blinding was not feasible. |
| All outcomes | ||
|
| ||
| Blinding of outcome assessment (detection bias) | Unclear risk | Blind outcome assessment was not mentioned. |
| All outcomes | ||
|
| ||
| Incomplete outcome data (attrition bias) | Low risk | No loss to follow-up or post-randomisation exclusion was reported |
| All outcomes | ||
|
| ||
| Selective reporting (reporting bias) | Unclear risk | Perinatal deaths appear not to have been reported according to the translation, although this has not been verified by a second translation |
|
| ||
| Other bias | Low risk | Appears to be free of other bias. |
| Methods | RCT. | |
|
| ||
| Participants | Number of women randomised: 201. | |
| Setting: Hong Kong, China. | ||
| Inclusion criteria | ||
| • Gestational age at intervention: 42 completed weeks. | ||
| Exclusion criteria | ||
|
||
| Cervix ripeness: not mentioned as a criterion. | ||
|
| ||
| Interventions | Intervention: PGE2 pessaries 6-hourly if necessary | |
| versus | ||
| control: serial monitoring with NST (x2) and amniotic fluid index measurements (x1) weekly | ||
| Number of participants randomised to intervention group: 96. | ||
| Number of participants randomised to control group: 105. | ||
|
| ||
| Outcomes | Mother: (1) Spontaneous labour (2) Caesarean section (3) Fetal distress in labour | |
| Baby: (1) Birthweight (2) Apgar score < 7 (1min/5 min) (3) Cord blood pH (4) Admission to NICU (5) Meconium below the vocal cords | ||
|
| ||
| Notes | ||
|
| ||
| Risk of bias | ||
|
| ||
| Bias | Authors’ judgement | Support for judgement |
|
| ||
| Random sequence generation (selection bias) | Unclear risk | The method of randomisation sequence generation was not reported |
|
| ||
| Allocation concealment (selection bias) | Unclear risk | Allocation in a series of identical envelopes but no mention of sealed envelopes, opaqueness and sequential numbered envelopes |
|
| ||
| Blinding of participants and personnel (performance bias) | High risk | Appears that blinding was not feasible. |
| All outcomes | ||
|
| ||
| Blinding of outcome assessment (detection bias) | Unclear risk | Blind outcome assessment was not mentioned. |
| All outcomes | ||
|
| ||
| Incomplete outcome data (attrition bias) | Low risk | No missing data reported, however. 17/96 (18%) in the induction group went into spontaneous labour and 12/105 (11%) in the expectant management group were induced and the results for these women were included in the analyses |
| All outcomes | ||
|
| ||
| Selective reporting (reporting bias) | High risk | All pre-specified outcomes were reported, however this study did not report perinatal mortality |
| “We did not address perinatal mortality in this study.” | ||
|
| ||
| Other bias | Low risk | Appears to be free of other bias. |
| Methods | RCT. | |
|
| ||
| Participants | Number of women randomised: 150. | |
| Setting: Sousse, Tunisie (Tunisia). | ||
| Inclusion criteria | ||
|
||
| Exclusion criteria | ||
|
||
| 150 women in a university hospital in Sousse, Tunisia between 2002-2003 | ||
| Gestational age 41+ weeks. | ||
| Cervix unripe (Bishop score < 4). | ||
|
| ||
| Interventions | Induction group (n = 75): prostaglandin E2 gel intracervically (daily cervical ripening by prostaglandin gel, maximum 3 gels) | |
| versus | ||
| expectant management group (n = 75): cardiotocography every second day until 42 completed weeks. After that, prostaglandin E2 gel if no spontaneous labour | ||
|
| ||
| Outcomes | Mother: (a) Duration of labour (b) Mode of birth (c) Gestational age at delivery (d) Duration of mother’s hospital stay (hours) (e) Need for augmentation of labour using synthetic oxytocin (Recours aux ocytociques) (f) Effect of Bishop score on admission on duration of labour (Effet du score de Bishop a l’admission sur la duree (duration) du travail (labour) (g) Progress in labour (h) Time between final dose of prostaglandin gel and delivery | |
| Baby: (1) Duration of infant’s hospital stay (hours) (2) Total cost of care (3) Admission to neonatal unit (4) Stained amniotic fluid (5) Apgar score at 1 minute (6) Perinatal mortality (7) Macrosomia (8) Signs of post-maturity (9) Need for resuscitation at birth (10) Number of doses of gel administered | ||
|
| ||
| Notes | This article is in French. | |
|
| ||
| Risk of bias | ||
|
| ||
| Bias | Authors’ judgement | Support for judgement |
|
| ||
| Random sequence generation (selection bias) | Low risk | Randomisation by computer. |
|
| ||
| Allocation concealment (selection bias) | Unclear risk | Article in French. Appears not to have been reported. |
|
| ||
| Blinding of participants and personnel (performance bias) | High risk | Appears that blinding was not feasible. |
| All outcomes | ||
|
| ||
| Blinding of outcome assessment (detection bias) | Unclear risk | Blind outcome assessment was not mentioned. |
| All outcomes | ||
|
| ||
| Incomplete outcome data (attrition bias) | Low risk | No loss to follow-up and post randomisation exclusions reported |
| All outcomes | ||
|
| ||
| Selective reporting (reporting bias) | Low risk | Outcomes were appropriately reported. |
|
| ||
| Other bias | Low risk | Appears to be free of other bias. |
| Methods | Randomised trial, no further details. | |
|
| ||
| Participants | Number of women randomised: 119. | |
| Setting: Lappenranta, Finland. | ||
| Inclusion criteria | ||
|
||
| Exclusion criteria | ||
| • Cases where the fetal biparietal measure different in mid pregnancy ultrasonography by over 10 days from the mean curve were excluded. | ||
| Cervix ripeness: not a criterion. | ||
|
| ||
| Interventions | Induction group (n = 66): oxytocin alone or with AROM (amniotomy) depending on the cervix | |
| versus | ||
| expectant management group (n = 53): obstetric examination, NST, biochemical tests and amniotic fluid determination every 3 days | ||
|
| ||
| Outcomes | Mother: (1) Mode of birth (reported only as operative) (2) Duration of labour (3) Mean blood loss during labour (4) Maternal death. | |
| Baby: (1) Mean birthweight (2) Apgar scores (3) Fetal death. | ||
|
| ||
| Notes | The study is available as an abstract only. | |
|
| ||
| Risk of bias | ||
|
| ||
| Bias | Authors' judgement | Support for judgement |
|
| ||
| Random sequence generation (selection bias) | Unclear risk | The method of sequence generated was not reported. |
|
| ||
| Allocation concealment (selection bias) | Unclear risk | The method of allocation concealment was not reported. |
|
| ||
| Blinding of participants and personnel (performance bias) | High risk | Appears that blinding was not feasible. |
| All outcomes | ||
|
| ||
| Blinding of outcome assessment (detection bias) | Unclear risk | Blind outcome assessment was not mentioned. |
| All outcomes | ||
|
| ||
| Incomplete outcome data (attrition bias) | Low risk | No loss to follow-up or post-randomisation exclusion reported |
| All outcomes | ||
|
| ||
| Selective reporting (reporting bias) | Unclear risk | No outcomes were pre-specified (abstract). |
|
| ||
| Other bias | Unclear risk | Unable to identify other bias based on the abstract; some degree of imbalance in numbers randomised to each group (66 and 53) |
| Methods | RCT. | |
|
| ||
| Participants | Number of women randomised: 200. | |
| Setting: Baltimore, USA. | ||
| Inclusion criteria | ||
|
||
| Exclusion criteria | ||
| No additional criteria. | ||
| Cervix ripeness: not mentioned. | ||
|
| ||
| Interventions | Intervention group (n = 103): Oxytocin infusion with AROM (amniotomy) when possible. | |
| Expectant management group (n = 97): Estriol measurements 2-3/week. In both groups women initiated fetal movement counting. If reduced fetal movements, fetal heart rate and estriol testing were undertaken at 41 completed weeks | ||
|
| ||
| Outcomes | Mother: (1) GAat delivery (2) Length of hospital stay (3) Urinary estriol/creatinine ratio (4) Maternal complications (5) Endometritis (6) Pre-eclampsia (7) PROM (8) Caesarean section + indications. | |
| Baby: (1) Birthweight (2) Biparietal diameter (3) Placental weight (4) Dubowitz score [assesses infant GA] (5) SGA/AGA/LGA (6) Fetal distress (7) Meconium staining (8) Infant complications (9) Apgar scores (10) Fetal anomalies (11) Post-mature infants (12) Meconium aspiration | ||
|
| ||
| Notes | ||
|
| ||
| Risk of bias | ||
|
| ||
| Bias | Authors’ judgement | Support for judgement |
|
| ||
| Random sequence generation (selection bias) | Low risk | The randomisation sequence was generated using a computer-generated random number table |
|
| ||
| Allocation concealment (selection bias) | Unclear risk | Allocation concealment was achieved using sequentially labelled sealed envelopes, but there was no mention of opaqueness |
|
| ||
| Blinding of participants and personnel (performance bias) | High risk | Appears that blinding was not feasible. |
| All outcomes | ||
|
| ||
| Blinding of outcome assessment (detection bias) | Unclear risk | Blind outcome assessment was not mentioned. |
| All outcomes | ||
|
| ||
| Incomplete outcome data (attrition bias) | Low risk | 35/103 in the intervention group and 39/97 in the expectant group delivered prior to 42 completed weeks (and were included) ; 3/103 and 2/97 in the IOL and expectant management groups dropped out of the study, but were included in the group to which they were initially assigned |
| All outcomes | ||
|
| ||
| Selective reporting (reporting bias) | High risk | No detailed outcomes were pre-specified in the methods. Perinatal death was not reported |
|
| ||
| Other bias | Low risk | Appears to be free of other bias. |
AGA: appropriate for gestational age
AROM: artificial rupture of membranes/amniotomy
CTG: cardiotocograph
EBL: estimated blood loss
FHR: fetal heart rate
GA: gestational age
IOL: induction of labour
ITT: intention-to-treat analysis
IU: international units
IUFD: intra uterine fetal death
LGA: large for gestational age
LMP: last menstrual period
mcg: micrograms
NICU: neonatal intensive care unit
NST: nonstress test
PGE2: prostaglandin E2
PROM: premature rupture of membranes
RCT: randomised controlled trial
SGA: small for gestational age
Characteristics of excluded studies [ordered by study ID]
| Study | Reason for exclusion |
| Alcalay 1996 | PROM at term. |
| Amano 1999 | Alternate allocation trial. |
| Ascher-Walsh 2000 | Compares 2 forms of IOL. |
| Bell 1993 | Trial of cervical ripening not IOL. |
| Berghella 1994 | Membrane stripping to decrease the need for formal IOL. |
| Boulvain 1998 | Membrane stripping to decrease the need for formal IOL. |
| Buttino 1990 | Trial of cervical ripening not IOL. |
| Cardozo 1986 | Alternate allocation trial. |
| Cohn 1992 | IOL but no numerical results. |
| Conway 2000 | Trial of active versus expectant management in women with oligohydramnios |
| Damania 1992 | Trial of cervical ripening (2 methods) not IOL. |
| Dare 2002 | Trial of cervical ripening not IOL. |
| de Aquino 2003 | 2 forms of IOL. |
| Doany 1997 | Trial of cervical ripening not IOL. |
| Dunn 1989 | Intervention not a policy to induce labour compared with expectant management |
| El-Torkey 1992 | Trial of cervical ripening not IOL. |
| Elliott 1984 | Trial of nipple stimulation as a method of cervical ripening. No commitment to delivery within a given time or protocol |
| Evans 1983 | 2 forms of IOL. |
| Garry 2000 | Alternate allocation trial. |
| Giacalone 1998 | Trial of cervical ripening not IOL. |
| Hage 1993 | Trial of cervical ripening not IOL. |
| Heden 1991 | Alternate allocation trial. |
| Hernandez-Castro 2008 | Not a randomised controlled trial. |
| Imsuwan 1999 | This is a randomised controlled trial evaluating the effectiveness of weekly membrane sweeping in labour initiation for women at 41 completed weeks. It is not evaluating a policy of stopping the pregnancy at 41 weeks |
| Ingemarsson 1987 | Trial of cervical ripening not IOL. |
| Iqbal 2004 | Alternate allocation trial. |
| Jenssen 1977 | Trial of cervical ripening not IOL. |
| Kadar 1990 | Trial of nipple stimulation as a method of cervical ripening. No commitment to delivery within a given time or protocol |
| Katz 1983 | Alternate allocation trial. |
| Kipikasa 2005 | Comparing alternate methods for induction of labour. |
| Klopper 1969 | Trial of cervical ripening not IOL. |
| Knox 1979 | Quasi-randomised (last digit of hospital number). |
| Lee 1997 | 2 forms of IOL. |
| Lemancewicz 1999 | 2 forms of IOL. |
| Lien 1998 | Trial of cervical ripening not IOL. |
| Lyons 2001 | Trial of cervical ripening not IOL. |
| Magann 1998 | Trial of cervical ripening not IOL. |
| Magann 1999 | 2 forms of IOL. |
| Mancuso 1998 | 2 forms of IOL. |
| Martin 1978 | About 30% of randomly allocated women in both groups were excluded from analysis due to protocol violations |
| Meydanli 2003 | 2 forms of IOL. |
| Misra 1994 | 2 forms of IOL. |
| Müller 1995 | 2 forms of IOL. |
| Newman 1997 | Trial of cervical ripening not IOL. |
| Nicholson 2008 | Trial where all women were judged to be at risk. |
| Ohel 1996 | Alternate allocation. |
| Papageorgiou 1992 | 2 forms of IOL. |
| Paul 1988 | Protocol for RCT only - no results. |
| Rayburn 1988 | Trial of cervical ripening not IOL. |
| Rayburn 1999 | Trial of cervical ripening not IOL. |
| Roberts 1986 | Trial of cervical ripening not IOL. |
| Sande 1983 | RCT but analysis was by treatment received rather than allocated. 23/76 in IOL and 15/90 in expectant |
| management groups received the alternate intervention and were analysed as such. It is not possible to | |
| disaggregate the switched groups | |
| Satin 1991 | 2 forms of IOL. |
| Sawai 1991 | Trial of cervical ripening not IOL. |
| Sawai 1994 | Trial of cervical ripening not IOL. |
| Stenlund 1999 | Mifepristone versus placebo for IOL, but all women given PGE2 if necessary after 48 hours |
| Su 1996 | Both groups induced within 2 days with alternative methods. |
| Surbek 1997 | 2 forms of IOL. |
| Suzuki 1999 | Immediate IOL versus expectant management in twin pregnancies |
| Tylleskar 1979 | RCT but > 20% of women excluded in both groups. |
| Williams 1990 | Trial of cervical ripening not IOL. |
| Wing 2000 | Trial of cervical ripening not IOL. |
| Wong 2002 | Trial of cervical ripening not IOL. |
| Ziaei 2003 | Trial of cervical ripening not IOL. |
IOL: induction of labour
PGE2: prostaglandin E2
PROM: premature rupture of membranes
RCT: randomised controlled trial
Characteristics of ongoing studies [ordered by study ID]
| Trial name or title | Costs and effects of amniotomy at home for induction of post-term pregnancy [ISRCTN47736435] |
| Methods | Multicentre parallel RCT |
| Participants | 500 women with a singleton pregnancy (cephalic position), 292 days or more gestation |
| Interventions | Home amniotomy and expectant management of labour versus referral to obstetrician at 294 days for usual standard care |
| Outcomes | Perinatal death, stillbirth, newborn death, birth asphyxia, meconium aspiration syndrome |
| Starting date | |
| Contact information | Marlies Rijnders, Leiden, Netherlands |
| Notes |
RCT: randomised controlled trial
DATA AND ANALYSES
Comparison 1. Labour induction versus expectant management by gestational age (all trials).
| Outcome or subgroup title | No. of studies |
No. of participants |
Statistical method | Effect size |
|---|---|---|---|---|
| 1 Perinatal death | 17 | 7407 | Risk Ratio (M-H, Fixed, 95% CI) | 0.31 [0.12, 0.81] |
| 1.1 39-40 weeks | 3 | 810 | Risk Ratio (M-H, Fixed, 95% CI) | 0.32 [0.03, 3.09] |
| 1.2 41 weeks | 4 | 998 | Risk Ratio (M-H, Fixed, 95% CI) | 0.33 [0.03, 3.17] |
| 1.3 > 41 weeks | 10 | 5599 | Risk Ratio (M-H, Fixed, 95% CI) | 0.30 [0.09, 0.99] |
| 2 Stillbirth | 17 | 7407 | Risk Ratio (M-H, Fixed, 95% CI) | 0.30 [0.08, 1.08] |
| 2.1 39-40 weeks | 3 | 810 | Risk Ratio (M-H, Fixed, 95% CI) | 0.32 [0.03, 3.09] |
| 2.2 41 weeks | 4 | 998 | Risk Ratio (M-H, Fixed, 95% CI) | 0.33 [0.01, 8.15] |
| 2.3 > 41 weeks | 10 | 5599 | Risk Ratio (M-H, Fixed, 95% CI) | 0.28 [0.05, 1.67] |
| 3 Neonatal deaths | 17 | 7407 | Risk Ratio (M-H, Fixed, 95% CI) | 0.37 [0.10, 1.38] |
| 3.1 39-40 weeks | 3 | 810 | Risk Ratio (M-H, Fixed, 95% CI) | 0.0 [0.0, 0.0] |
| 3.2 41 weeks | 4 | 998 | Risk Ratio (M-H, Fixed, 95% CI) | 0.33 [0.01, 8.01] |
| 3.3 > 41 weeks | 10 | 5599 | Risk Ratio (M-H, Fixed, 95% CI) | 0.38 [0.09, 1.61] |
| 4 Birth asphyxia | 2 | Risk Ratio (M-H, Fixed, 95% CI) | Subtotals only | |
| 4.1 >41 weeks | 2 | 757 | Risk Ratio (M-H, Fixed, 95% CI) | 1.86 [0.51, 6.76] |
| 5 Meconium aspiration syndrome | 8 | 2371 | Risk Ratio (M-H, Fixed, 95% CI) | 0.50 [0.34, 0.73] |
| 5.1 41 weeks | 3 | 976 | Risk Ratio (M-H, Fixed, 95% CI) | 0.27 [0.11, 0.68] |
| 5.2 > 41 weeks | 5 | 1395 | Risk Ratio (M-H, Fixed, 95% CI) | 0.61 [0.40, 0.92] |
| 6 Newborn intensive care unit admission | 10 | 6161 | Risk Ratio (M-H, Fixed, 95% CI) | 0.90 [0.78, 1.04] |
| 6.1 39-40 weeks | 1 | 226 | Risk Ratio (M-H, Fixed, 95% CI) | 0.0 [0.0, 0.0] |
| 6.2 41 weeks | 1 | 600 | Risk Ratio (M-H, Fixed, 95% CI) | 0.87 [0.42, 1.79] |
| 6.3 > 41 weeks | 8 | 5335 | Risk Ratio (M-H, Fixed, 95% CI) | 0.90 [0.78, 1.04] |
| 7 Apgar score less than 7 at 5 minutes | 10 | 5379 | Risk Ratio (M-H, Fixed, 95% CI) | 0.72 [0.44, 1.18] |
| 7.1 39-40 weeks | 1 | 226 | Risk Ratio (M-H, Fixed, 95% CI) | 0.0 [0.0, 0.0] |
| 7.2 41 weeks | 2 | 376 | Risk Ratio (M-H, Fixed, 95% CI) | 0.55 [0.12, 2.55] |
| 7.3 > 41 weeks | 7 | 4777 | Risk Ratio (M-H, Fixed, 95% CI) | 0.75 [0.44, 1.26] |
| 8 Birthweight > 4000 g | 6 | 5217 | Risk Ratio (M-H, Fixed, 95% CI) | 0.73 [0.64, 0.84] |
| 8.1 41 weeks | 1 | 600 | Risk Ratio (M-H, Fixed, 95% CI) | 0.31 [0.20, 0.48] |
| 8.2 > 41 weeks | 5 | 4617 | Risk Ratio (M-H, Fixed, 95% CI) | 0.85 [0.73, 0.99] |
| 9 Birthweight (g) | 9 | 2579 | Mean Difference (IV, Random, 95% CI) | −57.79 [−99.84, −15. 73] |
| 9.1 39-40 weeks | 1 | 226 | Mean Difference (IV, Random, 95% CI) | −145.0 [−248.38, −41.62] |
| 9.2 41 weeks | 1 | 302 | Mean Difference (IV, Random, 95% CI) | −70.00 [−160.28, 20. 28] |
| 9.3 > 41 weeks | 7 | 2051 | Mean Difference (IV, Random, 95% CI) | −42.92 [−89.94, 4. 09] |
| 10 Caesarean section | 21 | 8749 | Risk Ratio (M-H, Fixed, 95% CI) | 0.89 [0.81, 0.97] |
| 10.1 37-39 weeks | 1 | 716 | Risk Ratio (M-H, Fixed, 95% CI) | 0.58 [0.30, 1.11] |
| 10.2 39-40 weeks | 3 | 810 | Risk Ratio (M-H, Fixed, 95% CI) | 0.74 [0.38, 1.41] |
| 10.3 < 41 weeks | 1 | 231 | Risk Ratio (M-H, Fixed, 95% CI) | 1.49 [0.90, 2.47] |
| 10.4 41 weeks | 4 | 998 | Risk Ratio (M-H, Fixed, 95% CI) | 0.74 [0.58, 0.96] |
| 10.5 > 41 weeks | 12 | 5994 | Risk Ratio (M-H, Fixed, 95% CI) | 0.91 [0.82, 1.00] |
| 11 Operative vaginal birth (forceps or ventouse) | 12 | 6227 | Risk Ratio (M-H, Fixed, 95% CI) | 1.10 [1.00, 1.21] |
| 11.1 37-39 weeks | 1 | 716 | Risk Ratio (M-H, Fixed, 95% CI) | 1.74 [1.24, 2.45] |
| 11.2 39-40 weeks | 2 | 571 | Risk Ratio (M-H, Fixed, 95% CI) | 0.94 [0.43, 2.04] |
| 11.3 41 weeks | 2 | 96 | Risk Ratio (M-H, Fixed, 95% CI) | 1.09 [0.40, 2.98] |
| 11.4 >41 weeks | 7 | 4844 | Risk Ratio (M-H, Fixed, 95% CI) | 1.05 [0.95, 1.16] |
| 12 Postpartum haemorrhage | 2 | Risk Ratio (M-H, Fixed, 95% CI) | Subtotals only | |
| 12.1 > 41 weeks | 2 | 757 | Risk Ratio (M-H, Fixed, 95% CI) | 0.91 [0.58, 1.44] |
Comparison 2. Labour induction versus expectant management by cervical status.
| Outcome or subgroup title | No. of studies |
No. of participants |
Statistical method | Effect size |
|---|---|---|---|---|
| 1 Perinatal death | 17 | 7407 | Risk Ratio (M-H, Fixed, 95% CI) | 0.31 [0.12, 0.81] |
| 1.1 Cervix favourable | 3 | 831 | Risk Ratio (M-H, Fixed, 95% CI) | 0.30 [0.01, 7.27] |
| 1.2 Cervix unfavourable | 7 | 4938 | Risk Ratio (M-H, Fixed, 95% CI) | 0.29 [0.07, 1.17] |
| 1.3 Not mentioned/not separated | 7 | 1638 | Risk Ratio (M-H, Fixed, 95% CI) | 0.34 [0.08, 1.41] |
| 2 Stillbirth | 17 | 7407 | Risk Ratio (M-H, Fixed, 95% CI) | 0.30 [0.08, 1.08] |
| 2.1 Cervix favourable | 3 | 831 | Risk Ratio (M-H, Fixed, 95% CI) | 0.30 [0.01, 7.27] |
| 2.2 Cervix unfavourable | 7 | 4938 | Risk Ratio (M-H, Fixed, 95% CI) | 0.27 [0.05, 1.66] |
| 2.3 Not mentioned/not separated | 7 | 1638 | Risk Ratio (M-H, Fixed, 95% CI) | 0.35 [0.04, 3.31] |
| 3 Neonatal death | 17 | 7406 | Risk Ratio (M-H, Fixed, 95% CI) | 0.37 [0.10, 1.38] |
| 3.1 Cervix favourable | 3 | 830 | Risk Ratio (M-H, Fixed, 95% CI) | 0.0 [0.0, 0.0] |
| 3.2 Cervix unfavourable | 7 | 4938 | Risk Ratio (M-H, Fixed, 95% CI) | 0.31 [0.03, 2.98] |
| 3.3 Not mentioned/not separated | 7 | 1638 | Risk Ratio (M-H, Fixed, 95% CI) | 0.40 [0.08, 2.06] |
| 4 Birth asphyxia | 2 | 757 | Risk Ratio (M-H, Fixed, 95% CI) | 1.86 [0.51, 6.76] |
| 4.1 Cervix favourable | 1 | 249 | Risk Ratio (M-H, Fixed, 95% CI) | 3.02 [0.12, 73.52] |
| 4.2 Cervix unfavourable | 0 | 0 | Risk Ratio (M-H, Fixed, 95% CI) | 0.0 [0.0, 0.0] |
| 4.3 Not mentioned/not separated | 1 | 508 | Risk Ratio (M-H, Fixed, 95% CI) | 1.67 [0.40, 6.90] |
| 5 Meconium aspiration syndrome | 8 | 2371 | Risk Ratio (M-H, Fixed, 95% CI) | 0.50 [0.34, 0.73] |
| 5.1 Cervix favourable | 0 | 0 | Risk Ratio (M-H, Fixed, 95% CI) | 0.0 [0.0, 0.0] |
| 5.2 Cervix unfavourable | 4 | 1401 | Risk Ratio (M-H, Fixed, 95% CI) | 0.46 [0.30, 0.70] |
| 5.3 Not mentioned/not separated | 4 | 970 | Risk Ratio (M-H, Fixed, 95% CI) | 0.69 [0.30, 1.58] |
| 6 Newborn intensive care unit admission | 10 | 6161 | Risk Ratio (M-H, Fixed, 95% CI) | 0.90 [0.78, 1.04] |
| 6.1 Cervix favourable | 2 | 475 | Risk Ratio (M-H, Fixed, 95% CI) | 3.02 [0.12, 73.52] |
| 6.2 Cervix unfavourable | 5 | 4568 | Risk Ratio (M-H, Fixed, 95% CI) | 0.89 [0.76, 1.04] |
| 6.3 Not mentioned/not separated | 3 | 1118 | Risk Ratio (M-H, Fixed, 95% CI) | 0.92 [0.64, 1.32] |
| 7 Apgar score less than 7 at 5 minutes | 10 | 5379 | Risk Ratio (M-H, Fixed, 95% CI) | 0.72 [0.44, 1.18] |
| 7.1 Cervix favourable | 2 | 475 | Risk Ratio (M-H, Fixed, 95% CI) | 3.02 [0.12, 73.52] |
| 7.2 Cervix unfavourable | 4 | 3921 | Risk Ratio (M-H, Fixed, 95% CI) | 0.77 [0.44, 1.35] |
| 7.3 Not mentioned/not separated | 4 | 983 | Risk Ratio (M-H, Fixed, 95% CI) | 0.47 [0.16, 1.44] |
| 8 Birthweight > 4000 g | 6 | 5217 | Risk Ratio (M-H, Random, 95% CI) | 0.74 [0.51, 1.05] |
| 8.1 Cervix favourable | 1 | 249 | Risk Ratio (M-H, Random, 95% CI) | 2.02 [0.62, 6.52] |
| 8.2 Cervix unfavourable | 4 | 4460 | Risk Ratio (M-H, Random, 95% CI) | 0.64 [0.37, 1.10] |
| 8.3 Not mentioned/not separated | 1 | 508 | Risk Ratio (M-H, Random, 95% CI) | 0.83 [0.69, 0.99] |
| 9 Birthweight (g) | 9 | 2579 | Mean Difference (IV, Random, 95% CI) | −57.79 [−99.84, −15. 73] |
| 9.1 Cervix favourable | 2 | 475 | Mean Difference (IV, Random, 95% CI) | −43.20 [−240.35, 153.96] |
| 9.2 Cervix unfavourable | 3 | 759 | Mean Difference (IV, Random, 95% CI) | -56.66 [-134.56, 21. 23] |
| 9.3 Not mentioned/not separated | 4 | 1345 | Mean Difference (IV, Random, 95% CI) | −68.39 [−117.47, −19.31] |
| 10 Caesarean section | 21 | 8749 | Risk Ratio (M-H, Fixed, 95% CI) | 0.89 [0.81, 0.97] |
| 10.1 Cervix favourable | 3 | 831 | Risk Ratio (M-H, Fixed, 95% CI) | 1.12 [0.76, 1.65] |
| 10.2 Cervix unfavourable | 8 | 5051 | Risk Ratio (M-H, Fixed, 95% CI) | 0.88 [0.80, 0.98] |
| 10.3 Not mentioned/not separated | 10 | 2867 | Risk Ratio (M-H, Fixed, 95% CI) | 0.85 [0.70, 1.02] |
| 11 Operative vaginal birth (forceps or ventouse) | 12 | 6227 | Risk Ratio (M-H, Fixed, 95% CI) | 1.10 [1.00, 1.21] |
| 11.1 Cervix favourable | 2 | 571 | Risk Ratio (M-H, Fixed, 95% CI) | 0.94 [0.43, 2.04] |
| 11.2 Cervix unfavourable | 4 | 3650 | Risk Ratio (M-H, Fixed, 95% CI) | 1.06 [0.95, 1.18] |
| 11.3 Not mentioned/not separated | 6 | 2006 | Risk Ratio (M-H, Fixed, 95% CI) | 1.26 [1.01, 1.56] |
| 12 Postpartum haemorrhage | 2 | 757 | Risk Ratio (M-H, Fixed, 95% CI) | 0.91 [0.58, 1.44] |
| 12.1 Cervix favourable | 1 | 249 | Risk Ratio (M-H, Fixed, 95% CI) | 1.01 [0.21, 4.90] |
| 12.2 Cervix unfavourable | 0 | 0 | Risk Ratio (M-H, Fixed, 95% CI) | 0.0 [0.0, 0.0] |
| 12.3 Not mentioned/not separated | 1 | 508 | Risk Ratio (M-H, Fixed, 95% CI) | 0.91 [0.57, 1.45] |
Analysis 1.1. Comparison 1 Labour induction versus expectant management by gestational age (all trials), Outcome 1 Perinatal death.
Review: Induction of labour for improving birth outcomes for women at or beyond term
Comparison: 1 Labour induction versus expectant management by gestational age (all trials)
Outcome: 1 Perinatal death
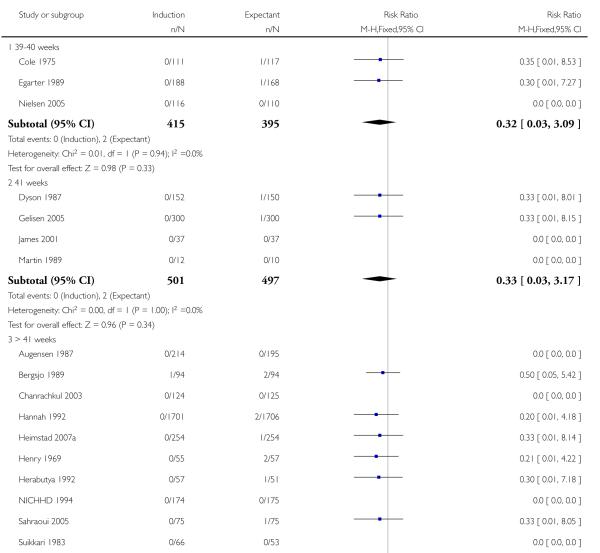
|
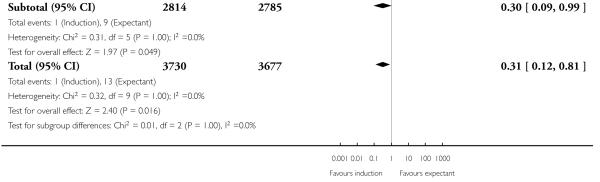
|
Analysis 1.2. Comparison 1 Labour induction versus expectant management by gestational age (all trials), Outcome 2 Stillbirth.
Review: Induction of labour for improving birth outcomes for women at or beyond term
Comparison: 1 Labour induction versus expectant management by gestational age (all trials)
Outcome: 2 Stillbirth
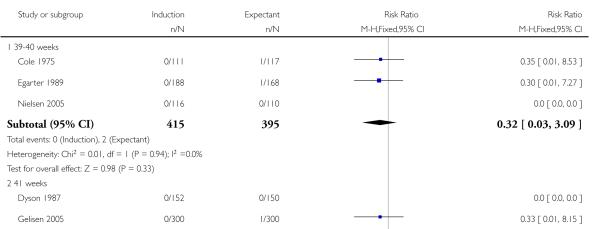
|
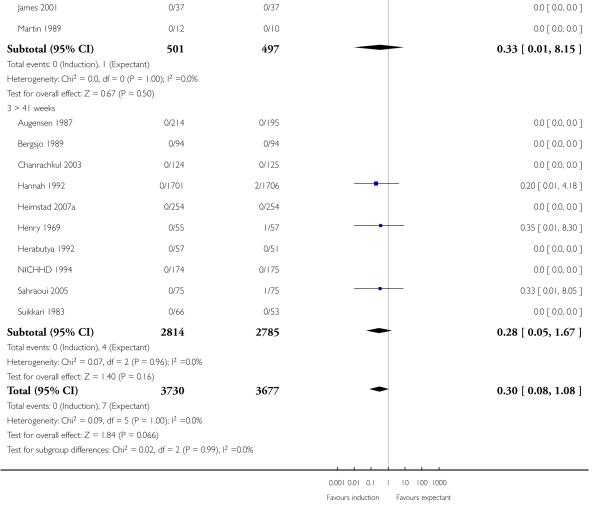
|
Analysis 1.3. Comparison 1 Labour induction versus expectant management by gestational age (all trials), Outcome 3 Neonatal deaths.
Review: Induction of labour for improving birth outcomes for women at or beyond term
Comparison: 1 Labour induction versus expectant management by gestational age (all trials)
Outcome: 3 Neonatal deaths
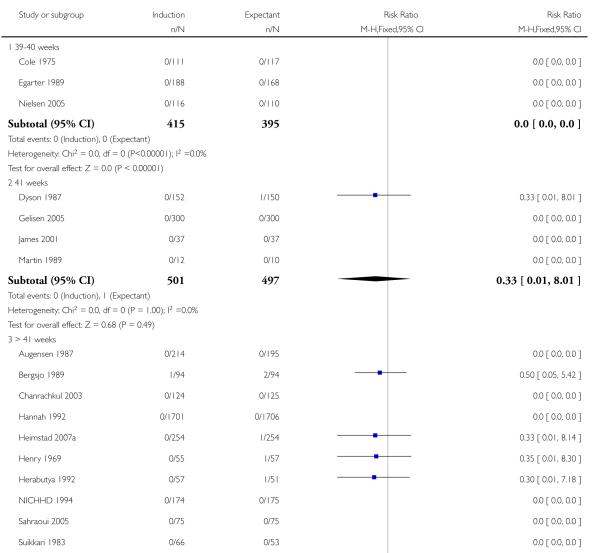
|
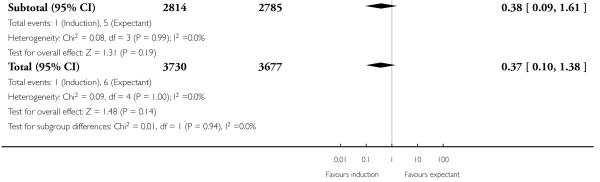
|
Analysis 1.4. Comparison 1 Labour induction versus expectant management by gestational age (all trials), Outcome 4 Birth asphyxia.
Review: Induction of labour for improving birth outcomes for women at or beyond term
Comparison: 1 Labour induction versus expectant management by gestational age (all trials)
Outcome: 4 Birth asphyxia
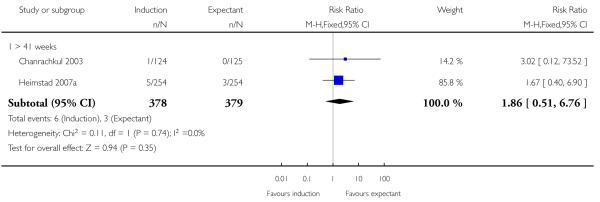
|
Analysis 1.5. Comparison 1 Labour induction versus expectant management by gestational age (all trials), Outcome 5 Meconium aspiration syndrome.
Review: Induction of labour for improving birth outcomes for women at or beyond term
Comparison: 1 Labour induction versus expectant management by gestational age (all trials)
Outcome: 5 Meconium aspiration syndrome
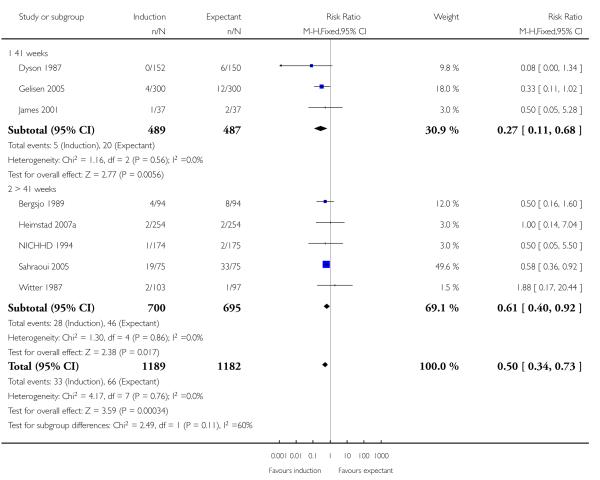
|
Analysis 1.6. Comparison 1 Labour induction versus expectant management by gestational age (all trials), Outcome 6 Newborn intensive care unit admission.
Review: Induction of labour for improving birth outcomes for women at or beyond term
Comparison: 1 Labour induction versus expectant management by gestational age (all trials)
Outcome: 6 Newborn intensive care unit admission
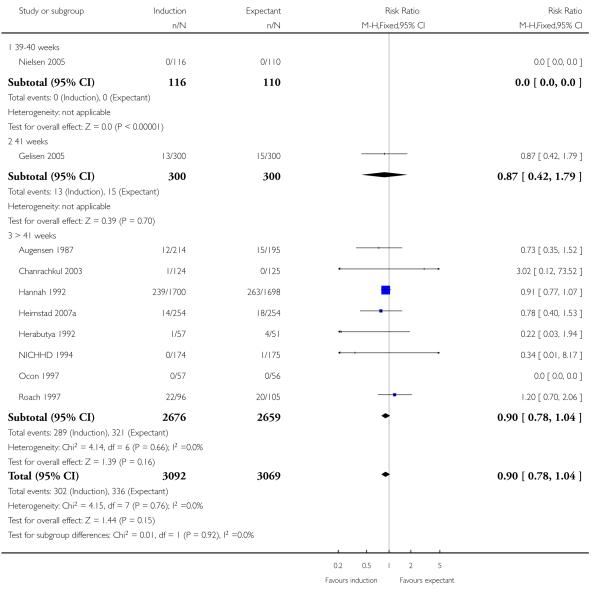
|
Analysis 1.7. Comparison 1 Labour induction versus expectant management by gestational age (all trials), Outcome 7 Apgar score less than 7 at 5 minutes.
Review: Induction of labour for improving birth outcomes for women at or beyond term
Comparison: 1 Labour induction versus expectant management by gestational age (all trials)
Outcome: 7 Apgar score less than 7 at 5 minutes
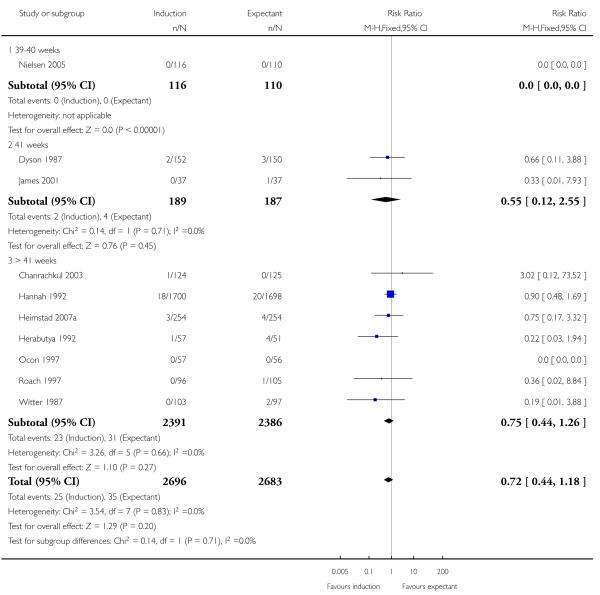
|
Analysis 1.8. Comparison 1 Labour induction versus expectant management by gestational age (all trials), Outcome 8 Birthweight > 4000 g.
Review: Induction of labour for improving birth outcomes for women at or beyond term
Comparison: 1 Labour induction versus expectant management by gestational age (all trials)
Outcome: 8 Birthweight > 4000 g
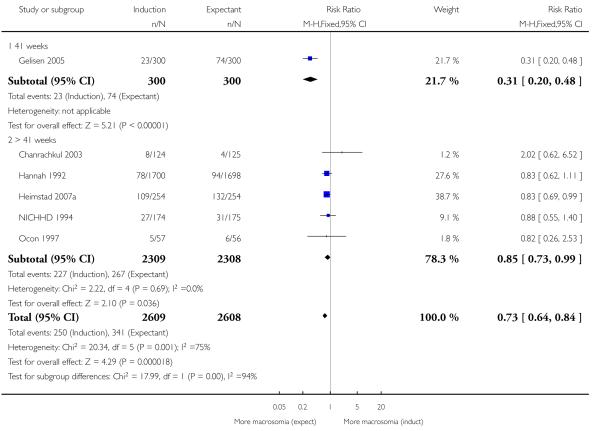
|
Analysis 1.9. Comparison 1 Labour induction versus expectant management by gestational age (all trials), Outcome 9 Birthweight (g).
Review: Induction of labour for improving birth outcomes for women at or beyond term
Comparison: 1 Labour induction versus expectant management by gestational age (all trials)
Outcome: 9 Birthweight (g)
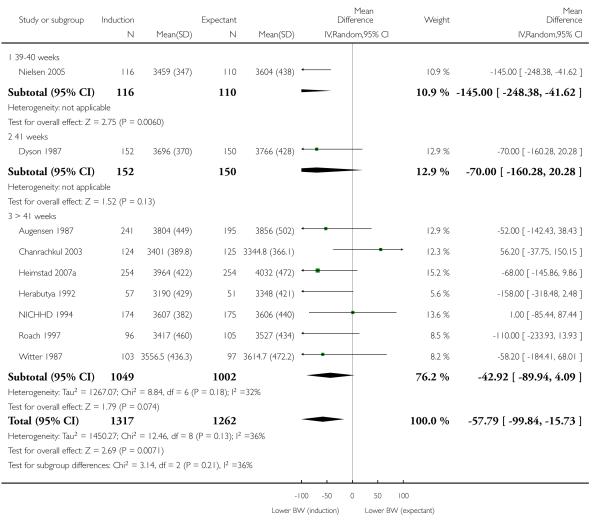
|
Analysis 1.10. Comparison 1 Labour induction versus expectant management by gestational age (all trials), Outcome 10 Caesarean section.
Review: Induction of labour for improving birth outcomes for women at or beyond term
Comparison: 1 Labour induction versus expectant management by gestational age (all trials)
Outcome: 10 Caesarean section
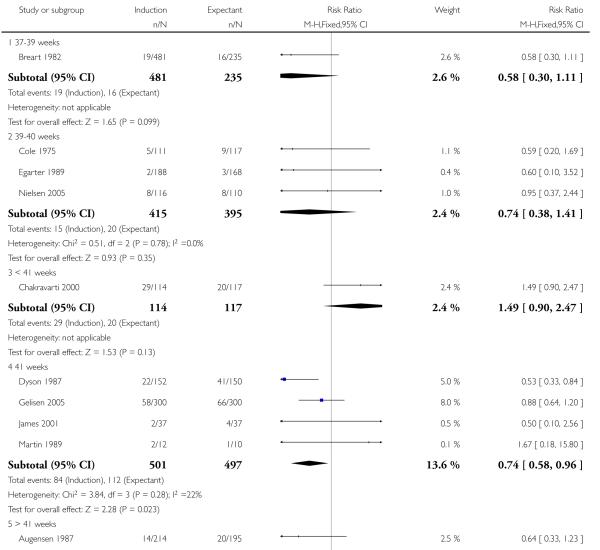
|
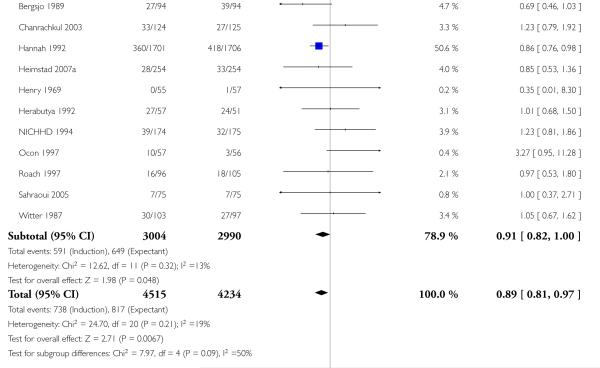
|
Analysis 1.11. Comparison 1 Labour induction versus expectant management by gestational age (all trials), Outcome 11 Operative vaginal birth (forceps or ventouse).
Review: Induction of labour for improving birth outcomes for women at or beyond term
Comparison: 1 Labour induction versus expectant management by gestational age (all trials)
Outcome: 11 Operative vaginal birth (forceps or ventouse)
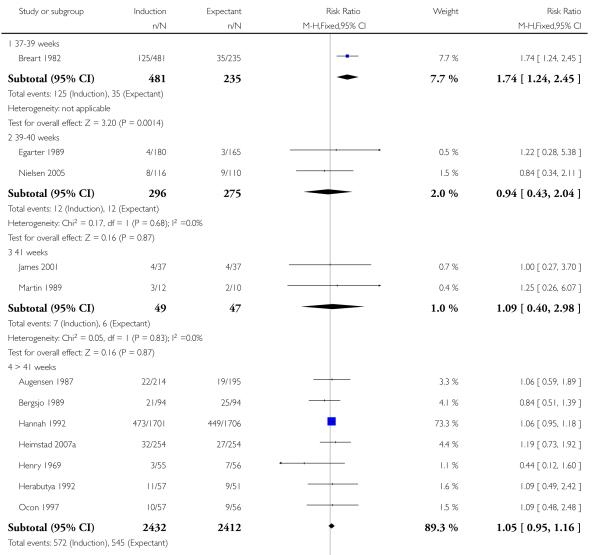
|
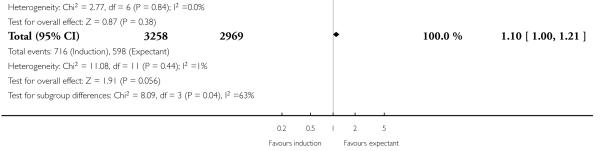
|
Analysis 1.12. Comparison 1 Labour induction versus expectant management by gestational age (all trials), Outcome 12 Postpartum haemorrhage.
Review: Induction of labour for improving birth outcomes for women at or beyond term
Comparison: 1 Labour induction versus expectant management by gestational age (all trials)
Outcome: 12 Postpartum haemorrhage
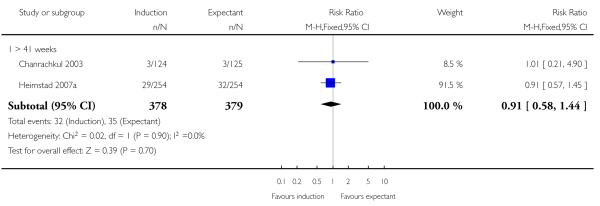
|
Analysis 2.1. Comparison 2 Labour induction versus expectant management by cervical status, Outcome 1 Perinatal death.
Review: Induction of labour for improving birth outcomes for women at or beyond term
Comparison: 2 Labour induction versus expectant management by cervical status
Outcome: 1 Perinatal death
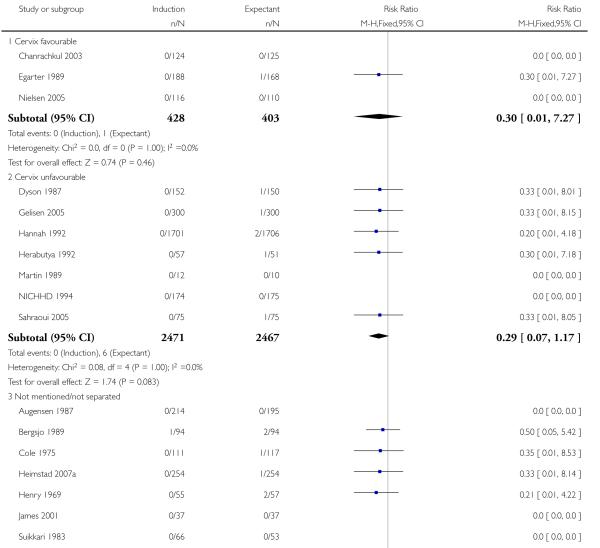
|
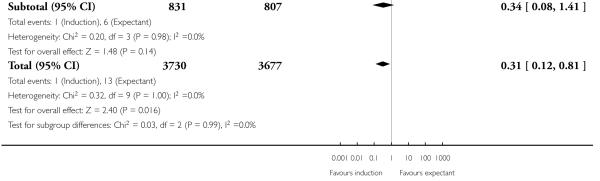
|
Analysis 2.2. Comparison 2 Labour induction versus expectant management by cervical status, Outcome 2 Stillbirth.
Review: Induction of labour for improving birth outcomes for women at or beyond term
Comparison: 2 Labour induction versus expectant management by cervical status
Outcome: 2 Stillbirth
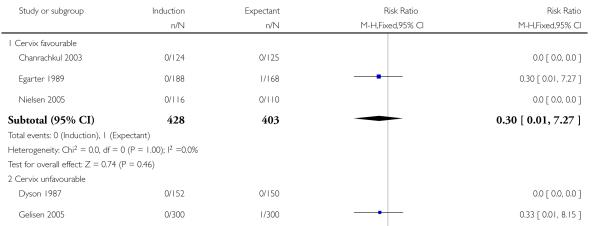
|
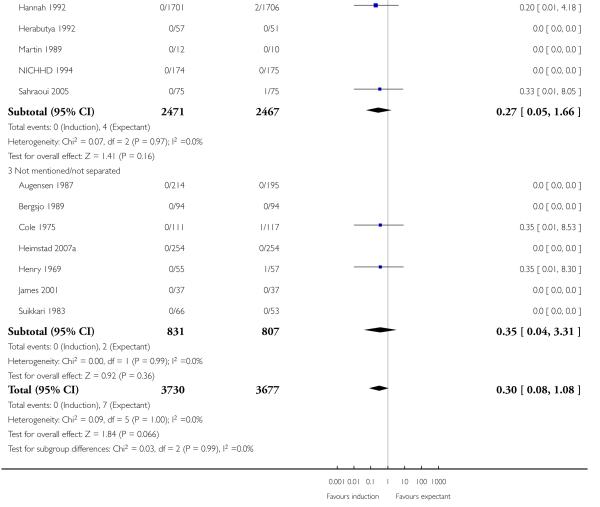
|
Analysis 2.3. Comparison 2 Labour induction versus expectant management by cervical status, Outcome 3 Neonatal death.
Review: Induction of labour for improving birth outcomes for women at or beyond term
Comparison: 2 Labour induction versus expectant management by cervical status
Outcome: 3 Neonatal death
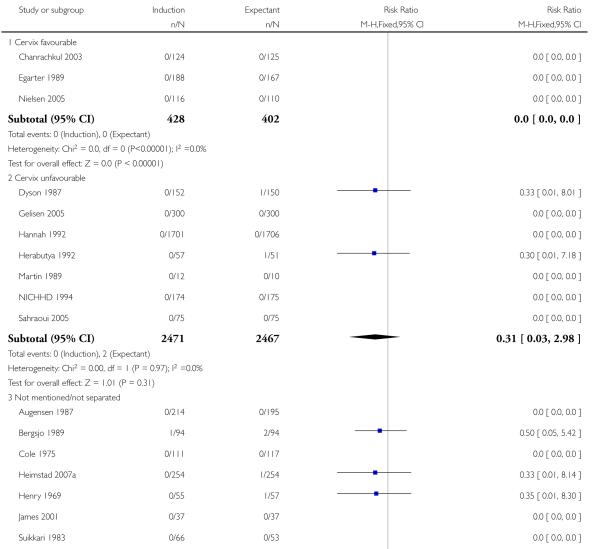
|
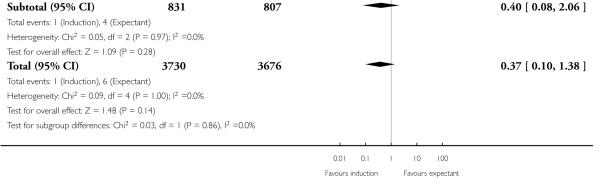
|
Analysis 2.4. Comparison 2 Labour induction versus expectant management by cervical status, Outcome 4 Birth asphyxia.
Review: Induction of labour for improving birth outcomes for women at or beyond term
Comparison: 2 Labour induction versus expectant management by cervical status
Outcome: 4 Birth asphyxia
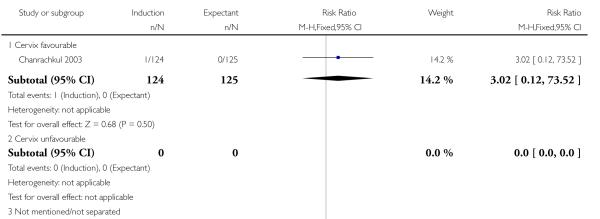
|
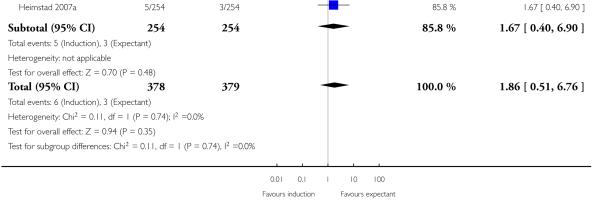
|
Analysis 2.5. Comparison 2 Labour induction versus expectant management by cervical status, Outcome 5 Meconium aspiration syndrome.
Review: Induction of labour for improving birth outcomes for women at or beyond term
Comparison: 2 Labour induction versus expectant management by cervical status
Outcome: 5 Meconium aspiration syndrome
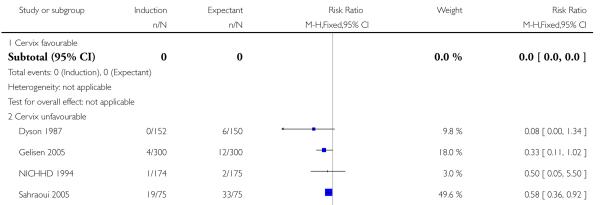
|
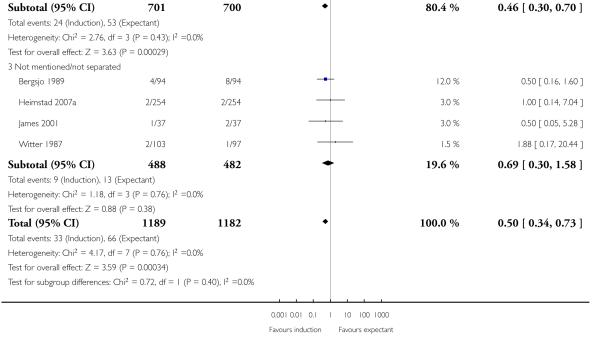
|
Analysis 2.6. Comparison 2 Labour induction versus expectant management by cervical status, Outcome 6 Newborn intensive care unit admission.
Review: Induction of labour for improving birth outcomes for women at or beyond term
Comparison: 2 Labour induction versus expectant management by cervical status
Outcome: 6 Newborn intensive care unit admission
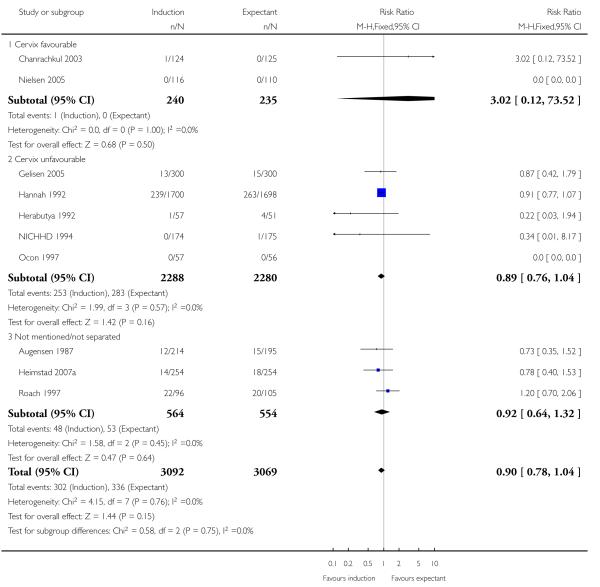
|
Analysis 2.7. Comparison 2 Labour induction versus expectant management by cervical status, Outcome 7 Apgar score less than 7 at 5 minutes.
Review: Induction of labour for improving birth outcomes for women at or beyond term
Comparison: 2 Labour induction versus expectant management by cervical status
Outcome: 7 Apgar score less than 7 at 5 minutes
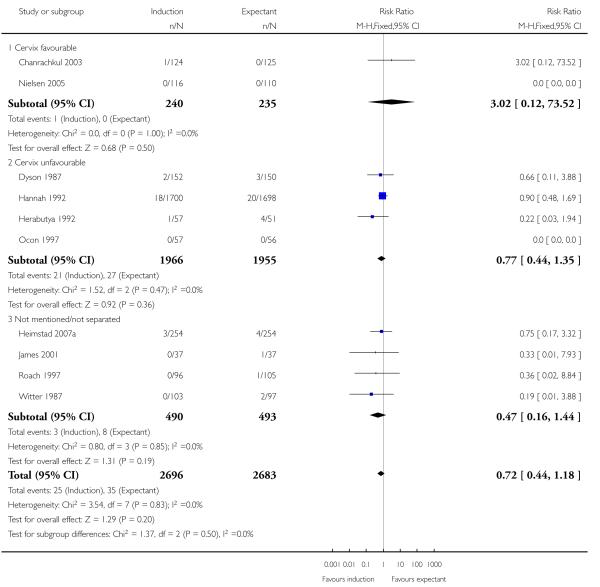
|
Analysis 2.8. Comparison 2 Labour induction versus expectant management by cervical status, Outcome 8 Birthweight > 4000 g.
Review: Induction of labour for improving birth outcomes for women at or beyond term
Comparison: 2 Labour induction versus expectant management by cervical status
Outcome: 8 Birthweight > 4000 g
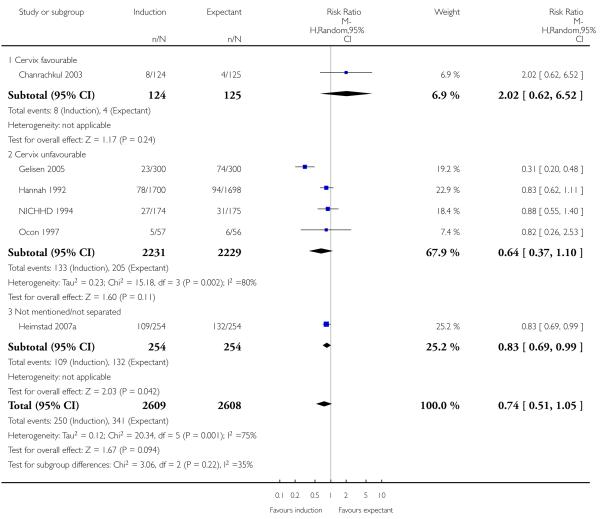
|
Analysis 2.9. Comparison 2 Labour induction versus expectant management by cervical status, Outcome 9 Birthweight (g).
Review: Induction of labour for improving birth outcomes for women at or beyond term
Comparison: 2 Labour induction versus expectant management by cervical status
Outcome: 9 Birthweight (g)
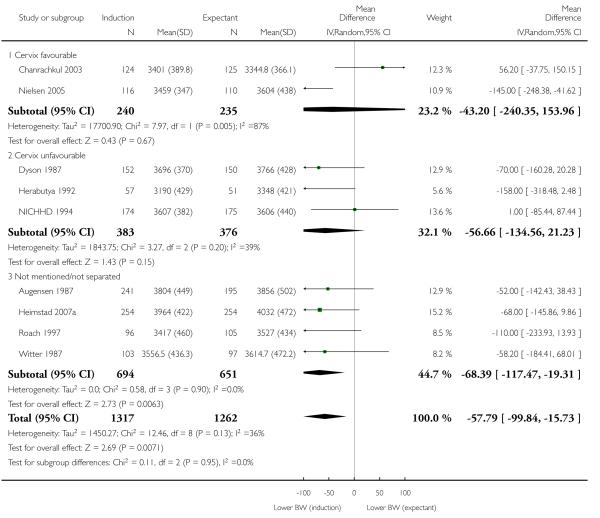
|
Analysis 2.10. Comparison 2 Labour induction versus expectant management by cervical status, Outcome 10 Caesarean section.
Review: Induction of labour for improving birth outcomes for women at or beyond term
Comparison: 2 Labour induction versus expectant management by cervical status
Outcome: 10 Caesarean section
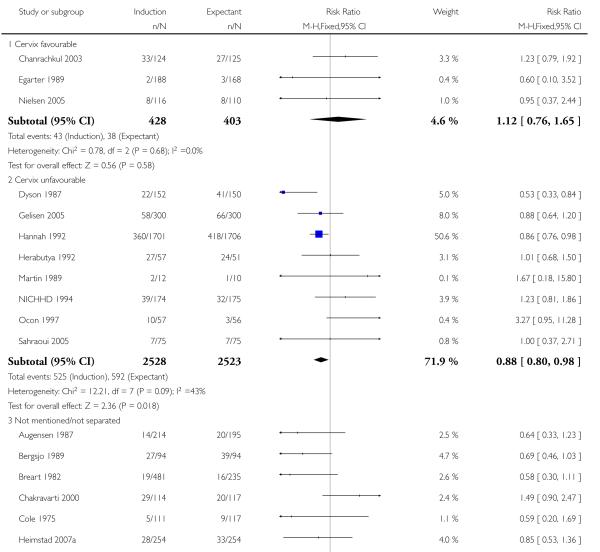
|
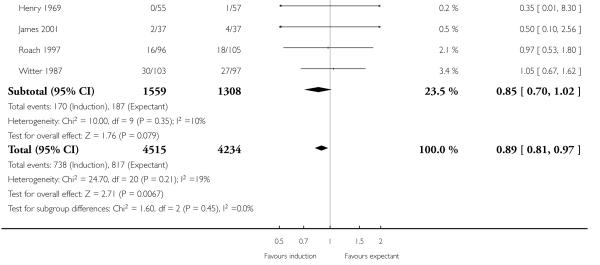
|
Analysis 2.11. Comparison 2 Labour induction versus expectant management by cervical status, Outcome 11 Operative vaginal birth (forceps or ventouse).
Review: Induction of labour for improving birth outcomes for women at or beyond term
Comparison: 2 Labour induction versus expectant management by cervical status
Outcome: 11 Operative vaginal birth (forceps or ventouse)
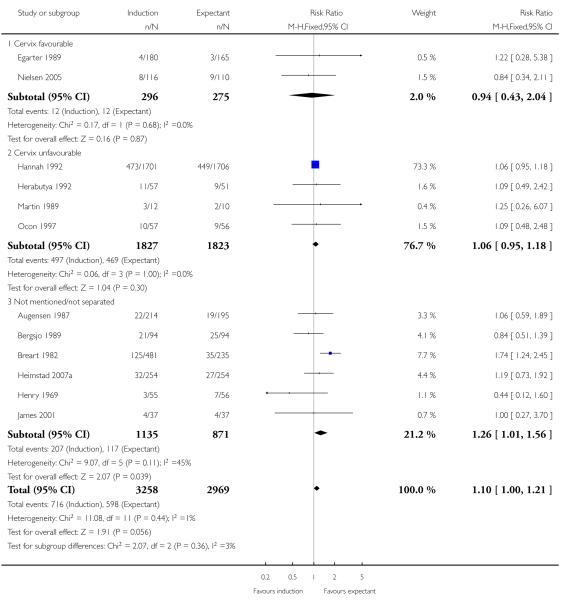
|
Analysis 2.12. Comparison 2 Labour induction versus expectant management by cervical status, Outcome 12 Postpartum haemorrhage.
Review: Induction of labour for improving birth outcomes for women at or beyond term
Comparison: 2 Labour induction versus expectant management by cervical status
Outcome: 12 Postpartum haemorrhage
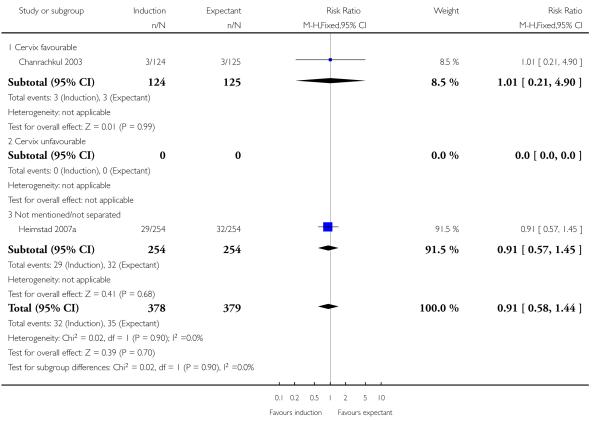
|
ADDITIONAL TABLES
Table 1.
Causes of death (stillbirths and livebirth deaths)
| Study | Cause of death | |
|---|---|---|
| Intervention Group | Control Group | |
| Cole 1975 | None | 1. Congenital heart condition (Stillbirth) GA at detection of death not reported. |
| Egarter 1989 | None | 1. Cord complication (Stillbirth) GA at detection offetaldeath was 40 + 3 weeks. |
| Dyson 1987 | None | 1. Meconium aspiration and persistent fetal circulation (Livebirth) GA at birth was 43 + 4 andthe timing of death after birth was not reported. |
| Gelisen 2005 | None | 1. Intrauterine fetal death (Stillbirth) GA at death 41 + 5 weeks. |
| Hannah 1992 | None | 1. Hypoxic ischaemic encephalopathy (Stillbirth) GA at detection of death not reported. 2. Massive aspiration of meconium (Stillbirth) GA at detection of death not reported. |
| Heimstad 2007a | None | 1. Birth asphyxia secondary to a true knot in the umbilical cord (Livebirth) Birth at 294 days GA; death at 2 days of age. |
| Henry 1969 | None | 1. Stillbirth in a patient with an abnormal glucose tolerance test (Stillbirth) GA at detection of death not reported. 2. Neonatal death from meconium inhalation in a patient with a positive amnioscopy who refused surgical induction of labour (Livebirth) GA at detection of death not reported. |
| Sahraoui 2005 | None | 1. Intrauterine fetal death (Stillbirth) Death detected at 42 weeks GA. |
| Bergsjo 1989 | 1.Severe malformations (Livebirth) GA at birth and timing of death after birth not reported |
1.Malformation (Livebirth) GA at birth and timing of death after birth not reported. 2. Pneumonia (Livebirth) GA at birth and timing of death after birth not reported. |
| Herabutya 1992 | None | 1. Congenital abnormality (Livebirth) Birth at 43 weeks. Death at 3 days of age. |
GA: gestational age
Appendix 1. Methods used to assess trials included in previous versions of this review
The following methods were used to assess Augensen 1987; Bergsjo 1989; Breart 1982; Chakravarti 2000; Chanrachkul 2003; Cole 1975; Dyson 1987; Egarter 1989; Gelisen 2005; Hannah 1992; Henry 1969; Herabutya 1992; James 2001; Martin 1989; NICHHD 1994; Ocon 1997; Roach 1997; Suikkari 1983; Witter 1987.
Methodological quality assessment
We evaluated trials under consideration for methodological quality and appropriateness for inclusion, without consideration of their results. Any differences of opinion were resolved by discussion. There was no blinding of authorship (Higgins 2005). Methodological quality assessment included:
allocation concealment: A = adequate, B = unclear, C = inadequate (will be excluded);
performance bias: blinding of carers and women is difficult to achieve in these trials as the interventions relate to a particular timing of birth;
detection bias: blind outcome assessments (A = done, B = unclear/not reported, C = not done);
attrition bias: losses to follow up were systematically recorded. If there were unexplained imbalances or if the outcome was available in less than 80% of the participants, the study was not used for that outcome. If this occurred for all outcomes, the study was excluded.
Data extraction
We extracted data for all relevant outcomes to predesigned forms for ease of extraction. AM Gulmezoglu and P Middleton extracted the data for all trials whether they were included in the previously published version or not. We resolved discrepancies by discussion.
Analysis strategy
The statistical analyses were conducted using the Review Manager software (RevMan 2003). We analysed categorical data using relative risks and 95% confidence intervals. We assessed statistical heterogeneity between trials using both the Chi2 test and the I2 statistic. Where there was no significant heterogeneity (P > 0.1, I2 < 25%), we pooled data using a fixed-effect model. If we encountered moderate heterogeneity (I2 between 25% and 50%), we used the random-effects model and for significant heterogeneity (I2 > 50 %) we did not analyse the totals. We tried to identify the sources of heterogeneity by looking at trial characteristics.
The earlier version of this review (Crowley 2006) used the Peto odds ratio (Peto OR) statistic. We used relative risk (RR) as this is widely recommended within The Cochrane Collaboration and by the Cochrane Pregnancy and Childbirth Group. The Peto OR is an appropriate statistic for meta-analysis when there are cells with ‘zero’ counts such as the case with the perinatal death data in this review (PCG 2005). We reported the main analysis with both RR and Peto OR and discussed the interpretation in the discussion section.
Intention-to-treat analysis
The analysis was based on ‘available cases’ as recommended in the Cochrane Handbook for Systematic Reviews of Interventions (Higgins 2005a). There were no imputations for missing outcome data. There were protocol violations such as postrandomisation exclusions and women not receiving the allocated treatment. These occurred in both directions. Some women allocated to induction of labour had spontaneous labour and some due for expectant management had induction of labour for various reasons. We included these data in the allocated groups (either using information published or seeking clarification from authors) as much as possible (see below in methodological quality).
Sensitivity analysis
We planned to conduct sensitivity analysis according to the allocation concealment score, should the available data allow it. We did not conduct formal sensitivity analysis because of the limited number of studies for each comparison and outcome but discussed the impact of quality in the discussion narratively.
Subgroup analysis
We planned to conduct a priori subgroup analyses by:
gestational age by week of gestation. The main groups here are gestational ages 37 to 40 + 6 and 41 + 0 and beyond. However, we will look at each week of gestation if data permit in future updates;
condition of cervix (favourable: Bishop score six or more; unfavourable less than six);
by method of induction (including dosage, timing, frequency and mode of administration).
We conducted the first two analyses. We did not have sufficient data to look at the results per week of gestation and by method of induction (most were similar, see Characteristics of included studies).
FEEDBACK
Marowitz, 14 April 2011
Summary
Both my students and myself are unable to understand the following sentence in text for ‘Effects of the intervention’: “Women induced at 37 to 40 completed weeks were more likely to have a caesarean section with expectant management than those in the labour induction group (RR 0.58; 95% CI 0.34 to 0.99).”
Are there errors in the wording of this sentence? [Comment submitted by Amy Marowitz, April 2011]
Reply
Thank you for your feedback. We have corrected the error.
Contributors
AM Gülmezoglu
WHAT’S NEW
Last assessed as up-to-date: 24 April 2012.
| Date | Event | Description |
|---|---|---|
| 31 March 2012 | New citation required and conclusions have changed | Whilst the overall conclusions have not changed, there is now evidence to show that induction of labour at or beyond term is associated with a lower rate of caesarean section |
| 31 March 2012 | New search has been performed | Search updated - no new trials identified. Trial reports that were previously awaiting classification have now been incorporated into the review. We have added three new included trials (Heimstad 2007a; Nielsen 2005; Sahraoui 2005), three new excluded trials (Hernandez-Castro 2008; Imsuwan 1999; Nicholson 2008) and one ongoing trial (Rijnders 2007). This updated review is now comprised of 22 included studies (reporting on 9383 women); 64 excluded studies and one ongoing study Results are now presented as 37-39 weeks; 39-40 weeks; < 41 weeks, 41 weeks and >41 weeks A new author joined the team to help prepare this update. |
HISTORY
Protocol first published: Issue 4, 2004
Review first published: Issue 4, 2006
| Date | Event | Description |
|---|---|---|
| 6 July 2011 | Amended | Error corrected in response to feedback from Amy Marowitz (Feedback). |
| 6 July 2011 | Feedback has been incorporated | Feedback from Amy Marowitz added. |
| 14 July 2009 | Amended | Search updated. Eight reports of five trials added to Studies awaiting classification (Heimstad 2007a; Hernandez-Castro 2008a; Imsuwan 1999a; Nicholson 2008a; Rijnders 2007a) |
| 3 September 2008 | Amended | Converted to new review format. |
| 28 February 2007 | Amended | The Implications for research section has been amended to include the uncertainty about timing of labour induction beyond term, which was unintentionally left out during the revision process |
| 21 August 2006 | New citation required but conclusions have not changed | This version has been re-written, including a new protocol which now limits the scope to labour induction |
| 30 June 2006 | New search has been performed | The previous version of this review included studies up to 1997 and included 21 labour induction trials (Crowley 2006). This version has been re-written, including a new protocol which now limits the scope to labour induction, and includes 19 trials. Thirteen ofthe 21 trials included in the previous version are included in this version. The remaining eight trials were excluded because of alternate allocation (Cardozo 1986; Heden 1991; Katz 1983), a high proportion of postrandomiza-tion exclusion (greater than 30% in Martin 1978 and greater than 24% in Tylleskar 1979), cervical ripening with breast stimulation (Elliott 1984; Kadar 1990), and analysis by intervention received (i.e. groups switched, Sande 1983). Six trials published since the publication of the previous version have been included in this update (Chakravarti 2000; Chanrachkul 2003; Gelisen 2005; James 2001; Ocon 1997; Roach 1997). |
Footnotes
DECLARATIONS OF INTEREST: None known.
DIFFERENCES BETWEEN PROTOCOL AND REVIEW:
Results are now presented as 37-39 weeks; 39-40 weeks; < 41 weeks, 41 weeks and > 41 weeks.
The methods have been updated to reflect the latest Cochrane Handbook for Systematic Reviews of Interventions Version (Higgins 2011).
References to studies included in this review
- Augensen 1987* [published data only] .Augensen K, Bergsjo P, Eikeland T, Ashvik K, Carlsen J. Randomized comparison of early versus late induction of labour in post-term pregnancy. BMJ. 1987;294:1192–5. doi: 10.1136/bmj.294.6581.1192. [DOI] [PMC free article] [PubMed] [Google Scholar]
- Augensen K, Bergsjo P, Eikeland T, Askvik K, Carlsen J. Induction of labour in prolonged pregnancy. A prospective randomized study; Proceedings of 10th European Congress of Perinatal Medicine; Leipzig, Germany. 12-16 Aug 1986. [Google Scholar]
- Bergsjo 1989 [published data only] .Bergsjo P, Huang GD, Yu SQ, Gao Z, Bakketeig LS. Comparison of induced vs non-induced labor in post-term pregnancy. Acta Obstetricia et Gynecologica Scandinavica. 1989;68:683–7. doi: 10.3109/00016348909006139. [DOI] [PubMed] [Google Scholar]
- Breart 1982 [published data only] .Breart G, Goujard J, Maillard F, Chavigny C, Rumeau-Rouquette C, Sureau C. Comparison of two obstetrical policies with regard to artificial induction of labour at term. A randomised trial. Journal de Gynecologie, Obstetrique et Biologie de la Reproduction. 1982;11:107–12. [PubMed] [Google Scholar]
- Chakravarti 2000 [published data only] .Chakravarti S, Goenka B. Conservative policy of induction of labor in uncomplicated postdated pregnancies; XVI FIGO World Congress of Obstetrics & Gynecology; Washington DC, USA. 3-8 Sept 2000; p. 62. Book 3. [Google Scholar]
- Chanrachkul 2003 [published data only] .Chanrachkul B, Herabutya Y. Postterm with favorable cervix: is induction necessary? European Journal of Obstetrics & Gynecology and Reproductive Biology. 2003;106:154–7. doi: 10.1016/s0301-2115(02)00243-9. [DOI] [PubMed] [Google Scholar]
- Cole 1975* [published data only] .Cole RA, Howie PW, MacNaughton MC. Elective induction of labour. A randomised prospective trial. Lancet. 1975;1:767–70. doi: 10.1016/s0140-6736(75)92435-6. [DOI] [PubMed] [Google Scholar]
- Engleman SR, Hilland MA, Howie PW, McIlwaine GM, McNay MB. An analysis of the economic implications of elective induction of labour at term. Community Medicine. 1979;1:191–8. doi: 10.1007/BF02548754. [DOI] [PubMed] [Google Scholar]
- Dyson 1987* [published data only] .Dyson D, Miller PD, Armstrong MA. Management of prolonged pregnancy: induction of labour versus antepartum testing. American Journal of Obstetrics and Gynecology. 1987;156:928–34. doi: 10.1016/0002-9378(87)90359-0. [DOI] [PubMed] [Google Scholar]
- Dyson DC, Miller P, Miller M. Management of prolonged pregnancy - induction versus antepartum fetal testing; Proceedings of 6th Annual Meeting of the Society of Perinatal Obstetricians; San Antonio, Texas, USA. Jan 30-Feb 1 1986.p. 205. [Google Scholar]
- Egarter 1989* [published data only] .Egarter CH, Kofler E, Fitz R, Husslein P. Is induction of labour indicated in prolonged pregnancy? Results of a prospective randomised trial. Gynecologic and Obstetric Investigation. 1989;27:6–9. doi: 10.1159/000293605. [DOI] [PubMed] [Google Scholar]
- Husslein P, Egarter C, Sevelda P, Genger H, Salzer H, Kofler E. Induction of labour with Prostaglandin E2 vaginal tablets - a revival of elective induction? Results of a prospective randomised trial [Geburtseinleitung mit 3mg Prostaglandin E2-vaginaltabletten: eine renaissance der programmierten geburt?] Geburtshilfe und Frauenheilkunde. 1986;46:83–7. doi: 10.1055/s-2008-1036167. [DOI] [PubMed] [Google Scholar]
- Gelisen 2005 [published data only] .Gelisen O, Caliskan E, Dilbaz S, Ozdas E, Dilbaz B, Ozdas E, et al. Induction of labor with three different techniques at 41 weeks of gestation or spontaneous follow-up until 42 weeks in women with definitely unfavorable cervical scores. European Journal of Obstetrics & Gynecology and Reproductive Biology. 2005;120(2):164–9. doi: 10.1016/j.ejogrb.2004.08.013. [DOI] [PubMed] [Google Scholar]
- Hannah 1992 [published data only] .Farquharson D, Hannah ME, Hannah WJ, Hewson SA, Willan A, Young D, et al. The Canadian multicentre postterm pregnancy trial (CMPPT): outcome in the induction group based on method of induction; Proceedings of 49th Annual Clinical Meeting of the Society of Obstetricians and Gynaecologists of Canada; Ottawa, Ontario, Canada. 22-26 June 1993.p. 15. [Google Scholar]
- Goeree R, Hannah M, Hewson S, for the Canadian Postterm Pregnancy Trial Group Cost-effectiveness of induction of labour versus serial antenatal monitoring in the Canadian multicentre postterm pregnancy trial. Canadian Medical Association Journal. 1995;152:1445–50. [PMC free article] [PubMed] [Google Scholar]
- Hannah M, Canadian MG. The Canadian Multicentre Postterm Pregnancy Trial. International Journal of Gynecology & Obstetrics. 1994;46:31. [Google Scholar]
- Hannah ME, Hannah WJ, Hellman J, Hewson S, Milner R, Willan A. Induction of labour as compared with serial antenatal monitoring in post-term pregnancy. A randomized controlled trial. New England Journal of Medicine. 1992;326:1587–92. doi: 10.1056/NEJM199206113262402. [DOI] [PubMed] [Google Scholar]
- Hannah ME, Huh C, Hewson SA, Hannah WJ. Postterm pregnancy: putting the merits of a policy of induction into perspective. Birth. 1996;23(1):13–9. doi: 10.1111/j.1523-536x.1996.tb00455.x. [DOI] [PubMed] [Google Scholar]
- Heimstad 2007a [published data only] .Heimstad R, Romundstad PR, Hyett J, Mattsson LA, Salvesen KA. Women’s experiences and attitudes towards expectant management and induction of labor for post-term pregnancy. Acta Obstetricia et Gynecologica Scandinavica. 2007;86(8):950–6. doi: 10.1080/00016340701416929. [DOI] [PubMed] [Google Scholar]
- Heimstad R, Skogvoli E, Mattsson L, Johansen OJ, Eik- Nes SH, Romundstad PR, et al. Induction of labour or serial antenatal fetal monitoring in post-term pregnancy. A randomised controlled trial; 36th Nordic Congress of Obstetrics and Gynecology; Reykjavik, Iceland. 14-17 June 2008.p. 84. [Google Scholar]
- *.Heimstad R, Skogvoll E, Mattsson LA, Johansen OJ, Eik-Nes SH, Salvesen KA. Induction of labor or serial antenatal fetal monitoring in postterm pregnancy: a randomized controlled trial. Obstetrics & Gynecology. 2007;109(3):609–17. doi: 10.1097/01.AOG.0000255665.77009.94. [DOI] [PubMed] [Google Scholar]
- Henry 1969 [published data only] .Henry GR. A controlled trial of surgical induction of labour and amnioscopy in the management of prolonged pregnancy. Journal of Obstetrics and Gynaecology of the British Commonwealth. 1969;76:795–8. doi: 10.1111/j.1471-0528.1969.tb06180.x. [DOI] [PubMed] [Google Scholar]
- Herabutya 1992 [published data only] .Herabutya Y, Prasertsawat PO, Tongyai T, Isarangura N, Ayudthya N. Prolonged pregnancy: the management dilemma. International Journal of Gynecology & Obstetrics. 1992;37:253–8. doi: 10.1016/0020-7292(92)90325-d. [DOI] [PubMed] [Google Scholar]
- James 2001 [published data only] .James C, George SS, Gaunekar N, Seshadri L. Management of prolonged pregnancy: a randomized trial of induction of labour and antepartum foetal monitoring. National Medical Journal of India. 2001;14:270–3. [PubMed] [Google Scholar]
- Martin 1989 [published data only] .Martin JN, Sessums JK, Howard P, Martin RW, Morrison JC. Alternative approaches to the management of gravidas with prolonged post-term postdate pregnancies. Journal of the Mississippi State Association. 1989;30:105–11. [PubMed] [Google Scholar]
- NICHHD 1994 [published data only] .Medearis AL. Postterm pregnancy: active labor induction (PGE2 gel) not associated with improved outcomes compared to expectant management. A preliminary report; Proceedings of 10th Annual Meeting of Society of Perinatal Obstetricians; Houston, Texas, USA. 23-27 Jan 1990.p. 17. [Google Scholar]
- *.National Institute of Child Health and Human Development Network of Maternal-Fetal Medicine Units A clinical trial of induction of labor versus expectant management in postterm pregnancy. American Journal of Obstetrics and Gynecology. 1994;170:716–23. [PubMed] [Google Scholar]
- Nielsen 2005 [published data only] .Nielsen PE, Howard BC, Hill CC, Larson PL, Holland RH, Smith PN. Comparison of elective induction of labor with favorable Bishop scores versus expectant management: a randomized clinical trial. Journal of Maternal-Fetal & Neonatal Medicine. 2005;18(1):59–64. doi: 10.1080/14767050500139604. [DOI] [PubMed] [Google Scholar]
- Ocon 1997 [published data only] .Ocon L, Hurtado R, Coteron JJ, Zubiria A, Ramirez O, Garcia JA. Prolonged pregnancy: procedure guidelines [Gestacion prolongada: pautas de actuacion] Progresos de Obstetricia y Ginecologia. 1997;40:101–6. [Google Scholar]
- Roach 1997 [published data only] .Roach VJ, Rogers MS. Pregnancy outcome beyond 41 weeks gestation. International Journal of Gynecology & Obstetrics. 1997;59:19–24. doi: 10.1016/s0020-7292(97)00179-3. [DOI] [PubMed] [Google Scholar]
- Sahraoui 2005 [published data only] .Sahraoui W, Hajji S, Bibi M, Nouira M, Essaidi H, Khair H. Management of pregnancies beyond forty-one week’s gestation with an unfavorable cervix [Prise en charge obstetricale des grossesses prolongees au-dela de 41 semaines d’amenorrhee avec un score de Bishop defavorable] Journal de Gynecologie, Obstetrique et Biologie de la Reproduction. 2005;34(5):454–62. doi: 10.1016/s0368-2315(05)82853-4. [DOI] [PubMed] [Google Scholar]
- Suikkari 1983 [published data only] .Suikkari AM, Jalkanen M, Heiskala H, Koskela O. Prolonged pregnancy: induction or observation. Acta Obstetricia et Gynecologica Scandinavica Supplement. 1983;116:58. [Google Scholar]
- Witter 1987 [published data only] .Witter FR, Weitz CM. A randomised trial of induction at 42 weeks of gestation vs expectant management for postdates pregnancies. American Journal of Perinatology. 1987;4:206–11. doi: 10.1055/s-2007-999774. [DOI] [PubMed] [Google Scholar]
References to studies excluded from this review
- Alcalay 1996 [published data only] .Alcalay M, Hourvitz A, Reichman B, Luski A, Quint J, Barkai G, et al. Prelabour rupture of membranes at term: early induction of labour vs expectant management. European Journal of Obstetrics & Gynecology and Reproductive Biology. 1996;70:129–33. doi: 10.1016/s0301-2115(95)02586-3. [DOI] [PubMed] [Google Scholar]
- Amano 1999 [published data only] .Amano K, Saito K, Shoda T, Tani A, Yoshihara H, Nishijima M. Elective induction of labour at 39 weeks of gestation: a prospective randomized trial. Journal of Obstetrics and Gynaecology Research. 1999;25:33–7. doi: 10.1111/j.1447-0756.1999.tb01119.x. [DOI] [PubMed] [Google Scholar]
- Ascher-Walsh 2000 [published data only] .Ascher-Walsh C, Burke B, Baxi L. Outpatient management of prolonged pregnancy with misoprostol (MP): a randomized, double-blind placebo controlled study, prelim. data. American Journal of Obstetrics and Gynecology. 2000;182(1 Pt 2):S20. [Google Scholar]
- Bell 1993 [published data only] .Bell RJ, Permezel M, MacLennan, Hughes C, Healy D, Brennecke S. A randomized, double-blind controlled trial of the safety of vaginal recombinant human relaxin for cervical ripening. Obstetrics & Gynecology. 1993;82:328–33. [PubMed] [Google Scholar]
- Berghella 1994 [published data only] .Berghella V, Mickens R. Stripping of membranes as a safe method to reduce prolonged pregnancies; XIV World Congress of Gynecology and Obstetrics (FIGO); Montreal, Canada.. 26-30 Sept 1994; [DOI] [PubMed] [Google Scholar]
- *.Berghella V, Rogers RA, Lescale K. Stripping of membranes as a safe method to reduce prolonged pregnancies. Obstetrics & Gynecology. 1996;87:927–31. doi: 10.1016/0029-7844(96)00046-4. [DOI] [PubMed] [Google Scholar]
- Boulvain 1998 [published data only] .Boulvain M, Fraser WD, Marcoux S, Fontaine J-Y, Bazin S, Pinault J-J, et al. Does sweeping of the membranes reduce the need for formal induction of labour? A randomised controlled trial. British Journal of Obstetrics and Gynaecology. 1998;105:34–40. doi: 10.1111/j.1471-0528.1998.tb09347.x. [DOI] [PubMed] [Google Scholar]
- Buttino 1990 [published data only] .Buttino L, Garite T. Intracervical prostaglandin in postdate pregnancy. Journal of Reproductive Medicine. 1990;35(2):155–8. [PubMed] [Google Scholar]
- Cardozo 1986* [published data only] .Cardozo L, Fysh J, Pearce JM. Prolonged pregnancy: the management debate. BMJ. 1986;293:1059–63. doi: 10.1136/bmj.293.6554.1059. [DOI] [PMC free article] [PubMed] [Google Scholar]
- Cardozo L, Pearce JM, Fysh J. Conservative management of post-maturity. Journal of Obstetrics and Gynaecology of the British Commonwealth. 1983;4:69–72. [Google Scholar]
- Pearce JM, Cardozo L. Prolonged pregnancy: results of supplemental analysis. BMJ. 1988;297:715–7. [Google Scholar]
- Cohn 1992 [published data only] .Cohn M, Rogers M. Post maturity; a randomised study in a Hong Kong population; Proceedings of the 26th British Congress of Obstetrics and Gynaecology; Manchester, UK. 7-10 July 1992.p. 306. [Google Scholar]
- Conway 2000 [published data only] .Conway DL, Groth S, Adkins WB, Langer O. Management of isolated oligohydramnios in the term pregnancy: a randomized clinical trial. American Journal of Obstetrics and Gynecology. 2000;182:S21. [Google Scholar]
- Damania 1992 [published data only] .Damania KK, Natu U, Mhatre PN, Mataliya M, Mehta AC, Daftary SN. Evaluation of two methods employed for cervical ripening. Journal of Postgraduate Medicine. 1992;38(2):58–9. [PubMed] [Google Scholar]
- Dare 2002 [published data only] .Dare FO, Oboro VO. The role of membrane stripping in prevention of post-term pregnancy: a randomised clinical trial in Ile-Ife, Nigeria. Journal of Obstetrics and Gynaecology. 2002;22(3):283–6. doi: 10.1080/01443610220130571. [DOI] [PubMed] [Google Scholar]
- de Aquino 2003 [published data only] .de Aquino MMA, Cecatti JG. Misoprostol versus oxytocin for labour induction in term and post-term pregnancy: randomized controlled trial. Sao Paulo Medical Journal. 2003;121:102–6. doi: 10.1590/S1516-31802003000300003. [DOI] [PMC free article] [PubMed] [Google Scholar]
- Doany 1997 [published data only] .Doany W. Outpatient management of postdate pregnancy with intravaginal prostaglandin E2 and membrane stripping. American Journal of Obstetrics and Gynecology. 1997;174(1 Pt 2):351. doi: 10.1002/(SICI)1520-6661(199703/04)6:2<71::AID-MFM2>3.0.CO;2-M. [DOI] [PubMed] [Google Scholar]
- *.Doany W, McCarty J. Outpatient management of the uncomplicated postdate pregnancy with intravaginal prostaglandin E2 gel and membrane stripping. Journal of Maternal-Fetal Medicine. 1997;6:71–8. doi: 10.1002/(SICI)1520-6661(199703/04)6:2<71::AID-MFM2>3.0.CO;2-M. [DOI] [PubMed] [Google Scholar]
- Dunn 1989 [published data only] .Dunn PA, Rogers D, Halford K. Transcutaneous electrical nerve stimulation at acupuncture points in the induction of uterine contractions. Obstetrics & Gynecology. 1989;73:286–90. [PubMed] [Google Scholar]
- Elliott 1984 [published data only] .Elliott JP, Flaherty JF. The use of breast stimulation to prevent postdate pregnancy. American Journal of Obstetrics and Gynecology. 1984;149:628–32. doi: 10.1016/0002-9378(84)90247-3. [DOI] [PubMed] [Google Scholar]
- El-Torkey 1992 [published data only] .El-Torkey M, Grant JM. Sweeping of the membranes is an effective method of induction of labour in prolonged pregnancy: a report of a randomized trial. British Journal of Obstetrics and Gynaecology. 1992;99:455–8. doi: 10.1111/j.1471-0528.1992.tb13780.x. [DOI] [PubMed] [Google Scholar]
- Evans 1983 [published data only] .Evans MI, Dougan MB, Moawad AH, Evans WJ, Bryant-Greenwood GD, Greenwood FC. Ripening of the human cervix with porcine ovarian relaxin. American Journal of Obstetrics and Gynecology. 1983;147:410–4. doi: 10.1016/s0002-9378(16)32236-0. [DOI] [PubMed] [Google Scholar]
- Garry 2000 [published data only] .Garry D, Figueroa R, Guillaume J, Cucco V. Use of castor oil in pregnancies at term. Alternative Therapies. 2000;6(1):77–9. [PubMed] [Google Scholar]
- Giacalone 1998 [published data only] .Giacalone PL, Targosz V, Laffargue F, Boog G, Faure JM. Cervical ripening with mifepristone before labor induction. Obstetrics & Gynecology. 1998;92(4 Pt 1):487–92. doi: 10.1016/s0029-7844(98)00225-7. [DOI] [PubMed] [Google Scholar]
- Hage 1993 [published data only] .Hage P, Shawi J, Zarou D, Fleisher J. Double blind randomized trial to evaluate the role of outpatient use of PGE2 in cervical ripening. American Journal of Obstetrics and Gynecology. 1993;168:430. [Google Scholar]
- Heden 1991 [published data only] .Heden L, Ingemarsson I, Ahlstrom H, Solum T. Induction of labor versus conservative management in prolonged pregnancy: controlled study. International Journal of Feto-Maternal Medicine. 1991;4(4):148–52. [Google Scholar]
- Hernandez-Castro 2008 [published data only] .Hernandez-Castro F, Alvarez-Chavez LD, Martinez-Gaytan V, Cortes-Flores R. Ambulatory treatment of prolonged pregnancy with prostaglandin E2 gel [Embarazo de 41 semanas o mayor. Manejo ambulatorio con gel de prostaglandina E2] Revista Medica del Instituto Mexicano del Seguro Social. 2008;46(2):191–4. [PubMed] [Google Scholar]
- Imsuwan 1999 [published data only] .Imsuwan Y, Tanapat Y. Reduction of pregnancy with gestational age more than 41 weeks by membrane stripping to induce labor: a randomized controlled clinical trial. Thai Journal of Obstetrics and Gynaecology. 1999;11(4):267. [Google Scholar]
- Ingemarsson 1987 [published data only] .Ingemarsson I, Heden L, Montan S, Sjoberg NO. Effect of intracervical prostaglandin gel in postterm women. Personal communication. 1987 [Google Scholar]
- Iqbal 2004 [published data only] .Iqbal S. Management of prolonged pregnancy. JCPSP, Journal of the College of Physicians & Surgeons, Pakistan. 2004;14(5):274–7. [PubMed] [Google Scholar]
- Jenssen 1977 [published data only] .Jenssen H, Wright PB. The effect of dexamethasone therapy in prolonged pregnancy. Acta Obstetricia et Gynecologica Scandinavica. 1977;56:467–73. doi: 10.3109/00016347709155013. [DOI] [PubMed] [Google Scholar]
- Kadar 1990 [published data only] .Kadar N, Tapp A, Wong A. The influence of nipple stimulation at term on the duration of pregnancy. Journal of Perinatology. 1990;10(2):164–6. [PubMed] [Google Scholar]
- Katz 1983 [published data only] .Katz Z, Yemini M, Lancet M, Mogilner BM, Ben-Hur H, Caspi B. Non-aggressive management of post-date pregnancies. European Journal of Obstetrics & Gynecology and Reproductive Biology. 1983;15:71–9. doi: 10.1016/0028-2243(83)90175-2. [DOI] [PubMed] [Google Scholar]
- Kipikasa 2005 [published data only] .Kipikasa JH, Adair CD, Williamson J, Breen JM, Medford LK, Sanchez-Ramos L. Use of misoprostol on an outpatient basis for postdate pregnancy. International Journal of Gynecology & Obstetrics. 2005;88:108–11. doi: 10.1016/j.ijgo.2004.10.006. [DOI] [PubMed] [Google Scholar]
- Klopper 1969 [published data only] .Klopper AI, Dennis KJ, Farr V. Effect of intra-amniotic oestriol sulphate on uterine contractions. BMJ. 1969;786(2):786–9. doi: 10.1136/bmj.2.5660.786. [DOI] [PMC free article] [PubMed] [Google Scholar]
- Knox 1979 [published data only] .Knox GE, Huddleston JF, Flowers CE. Management of prolonged pregnancy: results of a prospective randomized trial. American Journal of Obstetrics and Gynecology. 1979;134:376–84. doi: 10.1016/s0002-9378(16)33078-2. [DOI] [PubMed] [Google Scholar]
- Lee 1997 [published data only] .Lee HY. A randomised double-blind study of vaginal misoprostol vs dinoprostone for cervical ripening and labour induction in prolonged pregnancy. Singapore Medical Journal. 1997;38(7):292–4. [PubMed] [Google Scholar]
- Lemancewicz 1999 [published data only] .Lemancewicz A, Urban R, Skotnicki MZ, Karpiuk A, Urban J. Uterine and fetal Doppler flow changes after misoprostol and oxytocin therapy for induction of labor in post-term pregnancies. International Journal of Gynecology & Obstetrics. 1999;67:139–45. doi: 10.1016/s0020-7292(99)00160-5. [DOI] [PubMed] [Google Scholar]
- Lien 1998 [published data only] .Lien JM, Morgan MA, Garite TJ, Kennedy KA, Sassoon DA, Freeman RK. Antepartum cervical ripening: applying prostaglandin E2 gel in conjunction with scheduled nonstress tests in postdate pregnancies. American Journal of Obstetrics and Gynecology. 1998;179:453–8. doi: 10.1016/s0002-9378(98)70378-3. [DOI] [PubMed] [Google Scholar]
- Lyons 2001 [published data only] .Lyons C, Rumney P, Huang W, Morrison E, Thomas S, Nageotte M, et al. Outpatient cervical ripening with oral misoprostol post-term: induction rates decreased. American Journal of Obstetrics and Gynecology. 2001;184(1):S116. [Google Scholar]
- Magann 1998 [published data only] .Magann EF, Chauhan SP, Nevils BG, McNamara MF, Kinsella MJ, Morrison JC. Management of pregnancies beyond forty-one weeks’ gestation with an unfavorable cervix. American Journal of Obstetrics and Gynecology. 1998;178:1279–87. doi: 10.1016/s0002-9378(98)70334-5. [DOI] [PubMed] [Google Scholar]
- Magann 1999 [published data only] .Magann EF, Chauhan SP, McNamara MF, Bass JD, Estes CM, Morrison JC. Membrane sweeping versus dinoprostone vaginal insert in the management of pregnancies beyond 41 weeks with an unfavorable cervix. Journal of Perinatology. 1999;19(2):88–91. doi: 10.1038/sj.jp.7200133. [DOI] [PubMed] [Google Scholar]
- Mancuso 1998 [published data only] .Mancuso S, Ferrazzani S, De Carolis S, Carducci B, De Santis L, Caruso A. Term and postterm low-risk pregnancies: management schemes for the reduction of high rates of cesarean section. Minerva Ginecologica. 1998;48:95–8. [PubMed] [Google Scholar]
- Martin 1978 [published data only] .Martin DH, Thompson W, Pinkerton JHM, Watson JD. A randomised controlled trial of selective planned delivery. British Journal of Obstetrics and Gynaecology. 1978;85:109–13. doi: 10.1111/j.1471-0528.1978.tb10462.x. [DOI] [PubMed] [Google Scholar]
- Meydanli 2003 [published data only] .Meydanli MM, Caliskan E, Burak F, Narin MA, Atmaca R. Labor induction post-term with 25 micrograms vs. 50 micrograms of intravaginal misoprostol. International Journal of Gynecology & Obstetrics. 2003;81:249–55. doi: 10.1016/s0020-7292(03)00042-0. [DOI] [PubMed] [Google Scholar]
- Misra 1994 [published data only] .Misra M, Vavre S. Labour induction with intracervical prostaglandin E2 gel and intravenous oxytocin in women with a very unfavourable cervix. Australia and New Zealand Journal of Obstetrics and Gynaecology. 1994;34(5):511–5. [Google Scholar]
- Müller 1995 [published data only] .Müller T, Rempen A. Comparison of 0,5 mg PG-E2-Intracervical-gel versus 3 mg PG-E2-vaginal tablet for the induction of labour [Geburtseinleitung mit Prostaglandinen: 0,5 mg PG-E2-Intrazervikalgel versus 3 mg PG-E2-vaginaltablette] Zeitschrift fur Geburtshilfe und Neonatologie. 1995;199:30–4. [PubMed] [Google Scholar]
- Newman 1997 [published data only] .Newman M, Newman R. Multiple-dose PGE2 cervical ripening on an outpatient basis: safety and efficacy. American Journal of Obstetrics and Gynecology. 1997;176:S112. [Google Scholar]
- Nicholson 2008 [published data only] .Nicholson J, Caughey A, Parry S, Rosen S, Evans A, Macones G. Prospective randomized trial of the active management of risk in pregnancy at term: improved birth outcomes from prostaglandin-assisted preventive labor induction. American Journal of Obstetrics and Gynecology. 2007;197(6 Suppl 1):S37. Abstract no: 84. [Google Scholar]
- *.Nicholson JM, Parry S, Caughey AB, Rosen S, Keen A, Macones GA. The impact of the active management of risk in pregnancy at term on birth outcomes: a randomized clinical trial. American Journal of Obstetrics & Gynecology. 2008;198(5):511.e1–511.e15. doi: 10.1016/j.ajog.2008.03.037. [DOI] [PMC free article] [PubMed] [Google Scholar]
- Pri-Paz SM. [accessed 19 February 2008];Activement management of risk in pregnancy at term to reduce rate of cesarean deliveries (AMOR IPAT) ClinicalTrials.gov. http://clinicaltrials.gov.
- Ohel 1996 [published data only] .Ohel G, Rahav D, Rothbart H, Ruach M. Randomised trial of outpatient induction of labor with vaginal PGE2 at 40-41 weeks of gestation versus expectant management. Archives of Gynecology and Obstetrics. 1996;258:109–12. doi: 10.1007/s004040050110. [DOI] [PubMed] [Google Scholar]
- Papageorgiou 1992 [published data only] .Papageorgiou I, Tsionou C, Minaretzis D, Michalas S, Aravantinos D. Labor characteristics of uncomplicated prolonged pregnancies after induction with intracervical prostaglandin E2 gel versus intravenous oxytocin. Gynecologic and Obstetric Investigation. 1992;34:92–6. doi: 10.1159/000292734. [DOI] [PubMed] [Google Scholar]
- Paul 1988 [published data only] .Paul R, Romero R. Clinical trial of induction versus expectant management in postterm pregnancy. Personal communication. 1988 [Google Scholar]
- Rayburn 1988 [published data only] .Rayburn W, Gosen R, Ramadei C, Woods R, Scott J. Outpatient cervical ripening with prostaglandin E2 gel in uncomplicated postdate pregnancies. American Journal of Obstetrics and Gynecology. 1988;158:1417–23. doi: 10.1016/0002-9378(88)90376-6. [DOI] [PubMed] [Google Scholar]
- Rayburn 1999 [published data only] .Rayburn WF, Gittens LN, Lucas MJ, Gall SA, Martin ME. Weekly administration of prostaglandin E2 gel compared with expectant management in women with previous cesareans. Obstetrics & Gynecology. 1999;94:250–4. doi: 10.1016/s0029-7844(99)00300-2. [DOI] [PubMed] [Google Scholar]
- Roberts 1986 [published data only] .Roberts WE, North DH, Speed JE, Martin JN, Palmer SM, Morrison JC. Comparative study of prostaglandin, laminaria, and minidose oxytocin for ripening of the unfavorable cervix prior to induction of labor. Journal of Perinatology. 1986;6:16–9. [Google Scholar]
- Sande 1983 [published data only] .Sande HA, Tuveng J, Fonstelien T. A prospective randomized study of induction of labor. International Journal of Gynecology & Obstetrics. 1983;21:333–6. doi: 10.1016/0020-7292(83)90025-5. [DOI] [PubMed] [Google Scholar]
- Satin 1991* [published data only] .Satin AJ, Hankins GDV, Yeomans ER. A prospective study of two dosing regimens of oxytocin for the induction of labor in patients with unfavorable cervices. American Journal of Obstetrics and Gynecology. 1991;165:980–4. doi: 10.1016/0002-9378(91)90453-x. [DOI] [PubMed] [Google Scholar]
- Satin AJ, Hankins GDV, Yeomans ER. A randomized study of two dosing regimens of oxytocin for the induction of patients with an unfavorable cervix. American Journal of Obstetrics and Gynecology. 1991;164:307. doi: 10.1016/0002-9378(91)90453-x. [DOI] [PubMed] [Google Scholar]
- Sawai 1991 [published data only] .Sawai SK, Williams MC, O’Brien WF, Angel JL, Mastrogiannis DS, Johnson L. Sequential outpatient application of intravaginal prostaglandin E2 gel in the management of postdates pregnancies. Obstetrics & Gynecology. 1991;78:19–23. [PubMed] [Google Scholar]
- Sawai 1994* [published data only] .Sawai SK, O’Brien WF, Mastrogiannis DS, Krammer J, Mastry MG, Porter GW. Patient-administered outpatient intravaginal prostaglandin E2 suppositories in post-date pregnancies: a double-blind, randomized, placebo-controlled study. Obstetrics & Gynecology. 1994;84(5):807–10. [PubMed] [Google Scholar]
- Sawai SK, O’Brien WF, Mastrogiannis MS, Mastry MG, Porter GW, Johnson L. Outpatient prostaglandin E2 suppositories in postdates pregnancies. American Journal of Obstetrics and Gynecology. 1992;166(1 Pt 2):400. [Google Scholar]
- Stenlund 1999 [published data only] .Stenlund PM, Bygdeman M, Ekman G. Induction of labor with mifepristone (RU 486). A randomized double-blind study in post-term pregnant women with unripe cervices. Acta Obstetricia et Gynecologica Scandinavica Supplement. 1994;73(161):FP50. [PubMed] [Google Scholar]
- *.Stenlund PM, Ekman G, Aedo AR, Bygdeman M. Induction of labor with mifepristone: a randomized, double-blind study versus placebo. Acta Obstetrica et Gynecologica Scandinavica. 1999;78:793–8. [PubMed] [Google Scholar]
- Su 1996 [published data only] .Su H, Li E, Weng L. Clinical observation on mifepristone for induction of term labor. Chinese Journal of Obstetrics & Gynecology. 1996;31:676–80. [PubMed] [Google Scholar]
- Surbek 1997 [published data only] .Surbek DV, Boesiger H, Hoesli L, Pavu N, Holzgreve W. Cervical priming and labor induction with intravaginal misoprostol versus PGE2: a double-blind randomized trial. American Journal of Obstetrics and Gynecology. 1997;176(1 Pt 2):S112. doi: 10.1016/s0002-9378(97)70006-1. [DOI] [PubMed] [Google Scholar]
- Suzuki 1999 [published data only] .Suzuki S, Otsubo Y, Sawa R, Yoneyama Y, Araki T. Clinical trial of induction of labor versus expectant management in twin pregnancy. Gynecologic and Obstetric Investigation. 1999;49:24–7. doi: 10.1159/000010207. [DOI] [PubMed] [Google Scholar]
- Tylleskar 1979 [published data only] .Leijon I, Finnstrom O, Hedenskog S, Ryden G, Tylleskar J. Spontaneous labor and elective induction - a prospective randomized study. II Bilirubin levels in the neonatal period. Acta Obstetricia et Gynecologica Scandinavica. 1980;59:103–6. doi: 10.3109/00016348009154623. [DOI] [PubMed] [Google Scholar]
- Leijon I, Finnstrom O, Hedenskog S, Ryden G, Tylleskar J. Spontaneous labour and elective induction - a prospectiverandomised study. Behavioural assessment and neurological examination in the newborn period. Acta Paediatrica Scandinavica. 1979;68:553–60. doi: 10.1111/j.1651-2227.1979.tb05054.x. [DOI] [PubMed] [Google Scholar]
- Tylleskar J, Finnstrom O, Hedenskog S, Leijon I, Ryden G. Spontaneous delivery-elective induction for convenience, a comparative study; Proceedings of 6th European Congress of Perinatal Medicine; Vienna, Austria. Aug 29-Sept 1 1978.p. 345. [Google Scholar]
- *.Tylleskar J, Finnstrom O, Leijon I, Hedenskog S, Ryden G. Spontaneous labor and elective induction - a prospective randomized study. Effects on mother and fetus. Acta Obstetricia et Gynecologica Scandinavica. 1979;58:513–8. doi: 10.3109/00016347909154610. [DOI] [PubMed] [Google Scholar]
- Williams 1990 [published data only] .Williams MG, O’Brien WF, Sawai SK, Knuppel RA. Outpatient cervical ripening in the postdates pregnancy; Proceedings of 10th Annual Meeting of Society of Perinatal Obstetricians; Houston, Texas, USA. 23-27 Jan 1990.p. 533. [Google Scholar]
- Wing 2000 [published data only] .Wing DA, Fassett MJ, Mishell DR. Mifepristone for preinduction cervical ripening beyond 41 weeks’ gestation: a randomized controlled trial. Obstetrics & Gynecology. 2000;96(4):543–8. doi: 10.1016/s0029-7844(00)00947-9. [DOI] [PubMed] [Google Scholar]
- Wong 2002 [published data only] .Wong SF, Hui SK, Choi H, Ho LC. Does sweeping of membranes beyond 40 weeks reduce the need for formal induction of labour? BJOG: an international journal of obstetrics and gynaecology. 2002;109:632–6. doi: 10.1111/j.1471-0528.2002.01193.x. [DOI] [PubMed] [Google Scholar]
- Ziaei 2003 [published data only] .Ziaei S, Rosebehani N, Kazeminejad A, Zafarghandi S. The effects of intramuscular administration of corticosteroids on the induction of parturition. Journal of Perinatal Medicine. 2003;31:134–9. doi: 10.1515/JPM.2003.018. [DOI] [PubMed] [Google Scholar]
References to ongoing studies
- Rijnders 2007 [published data only] .Rijnders MEB. [accessed 15 February 2007];Costs and effects of amniotomy at home for induction of post term pregnancy (ongoing trial) Current Controlled Trials. www.controlled-trials.com.
Additional references
- Alfirevic 2006 .Alfirevic Z, Weeks A. Oral misoprostol for induction of labour. Cochrane Database of Systematic Reviews. 2006;(2) doi: 10.1002/14651858.CD001338.pub2. DOI: 10.1002/14651858.CD001338.pub2. [DOI] [PubMed] [Google Scholar]
- Arrowsmith 2011 .Arrowsmith S, Wray S, Quenby S. Maternal obesity and labour complications following induction of labour in prolonged pregnancy. BJOG: an international journal of obstetrics and gynaecology. 2011;118(5):578–88. doi: 10.1111/j.1471-0528.2010.02889.x. [DOI] [PMC free article] [PubMed] [Google Scholar]
- Caughey 2009a .Caughey AB, Sundaram V, Kaimal AJ, Cheng YW, Gienger A, Little SE, et al. Maternal and neonatal outcomes of elective induction of labour. Evidence Reports/Technology Assessments. 2009;176:1–257. [PMC free article] [PubMed] [Google Scholar]
- Caughey 2009b .Caughey AB, Sundaram V, Kaimal AJ, Gienger A, Cheng YW, McDonald KM, et al. Systematic review: elective induction of labor versus expectant management of pregnancy. Annals of Internal Medicine. 2009;151:252–63. doi: 10.7326/0003-4819-151-4-200908180-00007. [DOI] [PubMed] [Google Scholar]
- Dare 2006 .Dare MR, Middleton P, Crowther CA. Planned early birth versus expectant management (waiting) for prelabour rupture of membranes at term (37 weeks or more) Cochrane Database of Systematic Reviews. 2006;(1) doi: 10.1002/14651858.CD005302.pub2. DOI: 10.1002/14651858.CD005302.pub2. [DOI] [PubMed] [Google Scholar]
- Heimstad 2007b .Heimstad R, Romundstad PR, Hyett J, Mattsson LA, Salvesen KA. Women’s experiences and attitudes towards expectant management and induction of labor for post-term pregnancy. Acta Obstetricia et Gynecologica. 2007;86:950–6. doi: 10.1080/00016340701416929. [DOI] [PubMed] [Google Scholar]
- Heimstad 2008 .Heimstad R, Romundstad PR, Salvesen KA. Induction of labour for post-term pregnancy and risk estimates for intrauterine and perinatal death. Acta Obstetricia et Gynecologica. 2008;87:247–9. doi: 10.1080/00016340701743165. [DOI] [PubMed] [Google Scholar]
- Higgins 2011 .The Cochrane Collaboration Higgins JPT, Green S, editors. Cochrane Handbook for Systematic Reviews of Interventions Version 5.1.0 [updated March 2011] 2011 Available from www.cochrane-handbook.org.
- Hilder 1998 .Hilder L, Costeloe K, Thilaganathan B. Prolonged pregnancy: evaluating gestation-specific risks of fetal and infant mortality. British Journal of Obstetrics and Gynaecology. 1998;105:169–73. doi: 10.1111/j.1471-0528.1998.tb10047.x. [DOI] [PubMed] [Google Scholar]
- Hofmeyr 2010 .Hofmeyr GJ, Gülmezoglu AM, Pileggi C. Vaginal misoprostol for cervical ripening and induction of labour. Cochrane Database of Systematic Reviews. 2010;(10) doi: 10.1002/14651858.CD000941.pub2. DOI: 10.1002/14651858.CD000941.pub2. [DOI] [PMC free article] [PubMed] [Google Scholar]
- Kaimal 2011 .Kaimal AJ, Little SE, Odibo AO, Stamilio DM, Grobman WA, Long EF, et al. Cost-effectiveness of elective induction of labor at 41 weeks in nulliparous women. American Journal of Obstetrics and Gynecology. 2011;204:137.e1–9. doi: 10.1016/j.ajog.2010.08.012. [DOI] [PubMed] [Google Scholar]
- Keirse 2010 .Keirse MJNC. Elective induction, selective deduction,and cesarean section. Birth. 2010;37(3):252–6. doi: 10.1111/j.1523-536X.2010.00413.x. [DOI] [PubMed] [Google Scholar]
- Mandruzzato 2010 .Mandruzzato G, Alfirevic Z, Chervenak F, Gruenebaum A, Heimstad R, Heinonen S, et al. Guidelines for the management of postterm pregnancy. Journal of Perinatal Medicine. 2010;38:111–9. doi: 10.1515/jpm.2010.057. [DOI] [PubMed] [Google Scholar]
- Mealing 2009 .Mealing NM, Roberts CL, Ford JB, Simpson JM, Morris JM. Trends in induction of labour, 1998-2007: A population-based study. Australian and New Zealand Journal of Obstetrics and Gynaecology. 2009;49:599–605. doi: 10.1111/j.1479-828X.2009.01086.x. [DOI] [PubMed] [Google Scholar]
- Menticoglou 2002 .Menticoglou SM, Hall PF. Routine induction of labour at 41 weeks gestation: nonsensus consensus. BJOG: an international journal of obstetrics and gynaecology. 2002;109:485–91. doi: 10.1111/j.1471-0528.2002.01004.x. [DOI] [PubMed] [Google Scholar]
- NICE 2008 .National Institute for Health and Clinical Excellence [accessed August 2011];Induction of Labour Clinical Guideline. 2008 http://guidance.nice.org.uk/CG70/Guidance/pdf/English.
- Olesen 2003 .Olesen AW, Westergaard JG, Olsen J. Perinatal and maternal complications related to postterm delivery: a national register-based study, 1978-1993. American Journal of Obstetrics and Gynecology. 2003;189:222–7. doi: 10.1067/mob.2003.446. [DOI] [PubMed] [Google Scholar]
- PCG 2005 .The Editorial Team . Pregnancy and Childbirth Group. About The Cochrane Collaboration. 1. Cochrane Review Groups (CRGs); 2005. [Google Scholar]
- RevMan 2011 .The Cochrane Collaboration . Review Manager (RevMan). 5.1. The Nordic Cochrane Centre: The Cochrane Collaboration; Copenhagen: 2011. [Google Scholar]
- Roos 2010 .Roos N, Sahlin L, Ekman-Ordeberg G, Kilere H, Stephansson O. Maternal risk factors for postterm pregnancy and cesarean delivery following labour induction. Acta Obstetricia et Gynecologica. 2010;89:1003–10. doi: 10.3109/00016349.2010.500009. [DOI] [PubMed] [Google Scholar]
- Sanchez-Ramos 2003 .Sanchez-Ramos L, Olivier F, Delke I, Kaunitz AM. Labor induction versus expectant management for postterm pregnancies: a systematic review with meta-analysis. Obstetrics & Gynecology. 2003;101:1312–8. doi: 10.1016/s0029-7844(03)00342-9. [DOI] [PubMed] [Google Scholar]
- SOGC 2008 .The Society of Obstetricians and Gynaecologists of Canada [accessed 3 March 2011];Guidelines for the Management of Pregnancy at 41+0 to 42+0 Weeks. http://www.sogc.org/guidelines/index.e.asp#Obstetrics.
- Wennerholm 2009 .Wennerholm UB, Hagberg H, Brorsson B, Bergh C. Induction of labor versus expectant management for post-date pregnancy: is there sufficient evidence for a change in clinical practice? Acta Obstetricia et Gynecologica. 2009;88:6–17. doi: 10.1080/00016340802555948. [DOI] [PubMed] [Google Scholar]
- Whitworth 2010 .Whitworth M, Bricker L, Neilson JP, Dowswell T. Ultrasound for fetal assessment in early pregnancy. Cochrane Database of Systematic Reviews. 2010;(4) doi: 10.1002/14651858.CD007058.pub2. DOI: 10.1002/14651858.CD007058.pub2. [DOI] [PMC free article] [PubMed] [Google Scholar]
- Zeitlin 2007 .Zeitlin J, Blondel B, Alexander S, Bréart G, the PERISTAT Group Variation in rates of postterm birth in Europe: reality or artefact? BJOG: an international journal of obstetrics and gynaecology. 2007;114:1097–103. doi: 10.1111/j.1471-0528.2007.01328.x. [DOI] [PubMed] [Google Scholar]
References to other published versions of this review
- Crowley 2006 .Crowley P. Interventions for preventing or improving the outcome of delivery at or beyond term. Cochrane Database of Systematic Reviews. 2006;(4) doi: 10.1002/14651858.CD000170.pub2. DOI: 10.1002/14651858.CD000170.pub2. [DOI] [PMC free article] [PubMed] [Google Scholar]
- *.Indicates the major publication for the study