Abstract
Aquaporins are membrane channels that facilitate the flow of water across biological membranes. Two conserved regions are central for selective function: the dual asparagine, proline, alanine (NPA) aquaporin signature motif and the aromatic/arginine selectivity filter (SF). Here we present the crystal structure of a yeast aquaporin at 0.88 Å resolution. We visualize the H-bond donor interactions of the dual NPA motif asparagine residues to passing water molecules; observe a polarized water-water H-bond configuration within the channel; assign the tautomeric states of the SF histidine and arginine residues; and observe four SF water positions too closely spaced to be simultaneously occupied. Strongly correlated movements break the connectivity of SF waters to other water molecules within the channel and prevent proton transport via a Grotthuss mechanism.
Aquaporins are water transport facilitators found in all kingdoms of life (1). They are primarily responsible for water homeostasis within living cells, although a subset of aquaporins also facilitate the flow of other small polar molecules such as glycerol or urea. As with any membrane transport facilitator, aquaporins have evolved to be highly selective for their transported substrate without binding water so strongly that transport is inhibited. In addition to excluding hydroxide (OH−) and hydronium (H3O+) ions, aquaporins must also prevent proton transport via a Grotthuss mechanism (2, 3) in which protons are rapidly exchanged between hydrogen bonded water molecules.
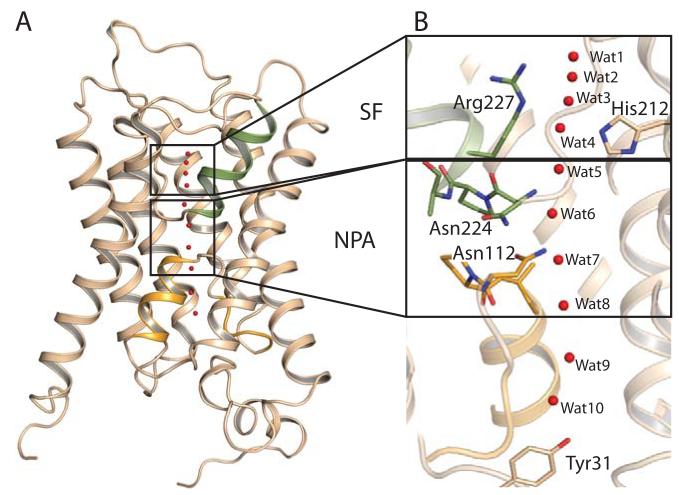
Crystal structures of bacterial (4, 5), archael (6), yeast (7), plasmodium (8), plant (9), mammalian (10-12) and human (13-15) aquaporins have established that these channels contain six transmembrane α-helices and associate as homo-tetramers. A seventh pseudo transmembrane helix is formed by loops B and E, which fold as aligned half-helices that insert from opposite sides of the membrane and place the conserved dual asparagine, proline, alanine (NPA) signature motif near the center of the water pore (Fig. 1). Transport specificity is defined by the aromatic/arginine selectivity filter (SF) (16, 17) which is located near the extracellular pore entrance and forms the narrowest portion of the channel.
Figure 1.
Fold of Aqy1. A, The six transmembrane helices and the pseudo seventh transmembrane helix formed by loops B (orange) and E (green). B, Water molecule positions within the channel (red spheres). The dual NPA aquaporin signature motif (lower box) and the SF (upper box) are highlighted.
Several models accounting for the ability of aquaporins to impede the passage of protons have emerged from structural arguments (13), molecular dynamics (MD) investigation of water structure and dynamics (17, 18), and computational studies characterizing the energetics associated with explicit transfer of protons across the channel (19, 20). These studies assert different microscopic mechanisms for excluding protons including electrostatic repulsion (19, 21-23), configurational barriers (17) and desolvation penalties (24) and consistently report the NPA region, where the macrodipoles of the two half-helices formed by loops B and E focus a positive electrostatic potential, as the main barrier against proton transport (17-24). This creates an electrostatic barrier to proton transport (21) and orients the water molecule’s dipole moment near the NPA motif such that the order of oxygen and hydrogen atoms do not support proton exchange via a Grotthuss mechanism (17, 18). Although intuitively appealing, this picture does not explain why mutations within the NPA motifs that diminish this positive electrostatic barrier facilitate the transport of sodium ions but not protons (25, 26) and nor is it evident why mutations within the SF can allow the channel to conduct protons (27, 28).
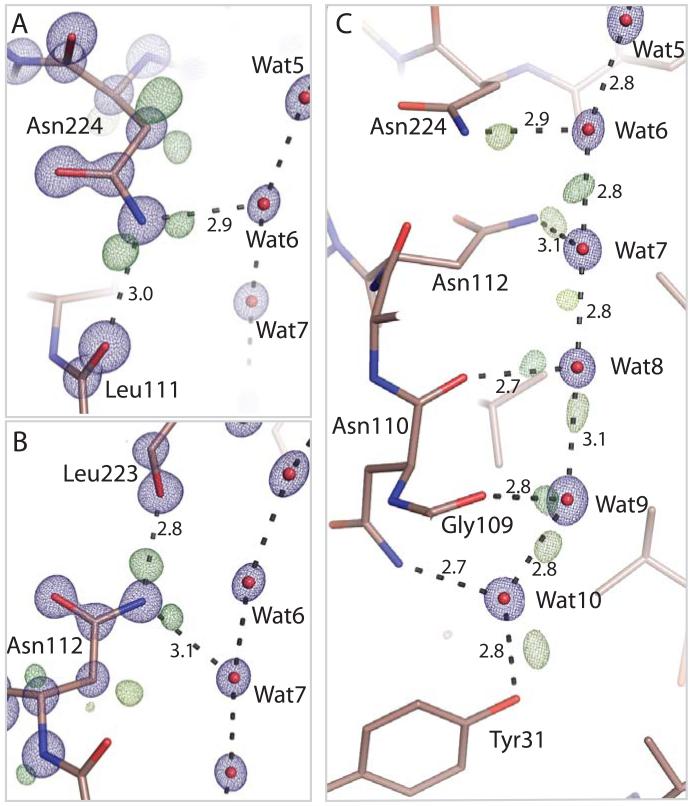
To further examine the underlying mechanism of facilitated, selective water transport we optimized crystals of Aqy1 (7), the sole aquaporin of Pichia pastoris, and determined its crystal structure to 0.88 Å resolution (29) recovering R-factor and Rfree values of 10.3% and 10.7% respectively (Table S1). Figure 2 illustrates the electron density associated with the dual NPA aquaporin signature motif. At sub-Ångstrom resolution the conformations of the two NPA asparagine residues (Asn112 and Asn224) are uniquely assigned since the 2mFobs-DFcalc electron density is delocalized across the carbon-oxygen double bond of these side-chains (Fig. 2A,B, blue mesh) whereas that for the side-chain nitrogen atom is more localized. Electron density associated with Glu51 (fully delocalized) and Gln137 (partially delocalized) highlights how delocalized density can be distinguished at this resolution (fig. S1). Strikingly, residual mFobs-DFcalc difference electron density from a hydrogen omit map (Fig. 2A,B, green mesh) reveals electron clouds associated with all four proton-donor interactions of the Nδ atoms of the dual NPA asparagine residues. H-bond donor interactions of Asn224:Nδ to Wat6 (Fig. 2A, peak maximum 0.42 e/Å3) and to the carbonyl oxygen of Leu111; and H-bond donor interactions of Asn112:Nδ to Wat7 (Fig. 2B peak maximum 0.48 e/Å3) and to the carbonyl oxygen of Leu223, are all resolved. These observations confirm that H-bond donor interaction from the NPA-motifs constrain the orientation of passing water molecules (13, 17, 18). No modeled water has H-bond interactions with both NPA asparagines, as is often depicted (13, 17, 19, 22, 23), and a water molecule at this position cannot be the critical ingredient preventing Grotthuss proton transport.
Figure 2.
Electron density within the NPA and cytoplasmic regions of the Aqy1. A, 2mFobs-DFcalc (blue, contoured at 4.3 e/Å3) and mFobs-DFcalc (green, contoured at 0.33 e/Å3) electron density associated with Asn224. B, 2mFobs-DFcalc (blue, contoured at 4.3 e/Å3) and mFobs-DFcalc (green, contoured at 0.33 e/Å3, yellow-green at 0.26 e/Å3) electron density associated with Asn112. Delocalized 2mFobs-DFcalc density connects the dual NPA asparagine Cγ and Oδ atoms whereas that associated with Nδ is more localized. Residual mFobs-DFcalc electron density indicates H-bond donor interactions to passing water molecules. C, 2mFobs-DFcalc electron density (blue, contoured at 4.3 e/Å3) illustrating the position of water molecules, and mFobs-DFcalc residual electron density (brown-green contoured at 0.59 e/Å3; dark green at 0.39 e/Å3; yellow-green 0.26-0.33 e/Å3; light green contoured at 0.15 e/Å3) indicating water H-bond interactions within the aquaporin channel.
MD simulations have predicted that water molecules adopt a bipolar orientation in the two halves of the channel, such that proton donor interactions systematically point away from the NPA region thereby disfavoring Grotthuss proton exchange (13, 17, 18). In the cytoplasmic half-channel, residual mFobs-DFcalc electron density reveals that Wat8 donates an H-bond to Wat9 (peak maximum 0.73 e/Å3, Fig 2C); Wat9 to Wat10 (peak maximum 0.70 e/Å3); Wat10 to the hydroxyl group of Tyr31 (peak maximum 0.79 e/Å3), and weaker residual density suggests an H-bond from Wat7 to Wat8 (peak maximum 0.30 e/Å3). A positive peak located almost exactly between Wat6 and Wat7 (peak maximum 0.50 e/Å3) suggests that these two waters donate an H-bond to each other with approximately equal probability, illustrating that H-bond directionality is not imposed at the very center of the channel where the positive electrostatic potential is at its maximum. The polarity of water-water H-bonds in the extracellular half-channel is difficult to assign due to larger anisotropic motions of Wat5 and Wat6 (B-factors of 15.0 and 13.9 Å2 respectively) relative to water molecules in the cytoplasmic half-channel (B-factors of 9.7 to 12.1 Å2). Nevertheless, all assigned interactions are consistent with the proposed bipolar distribution of water-water H-bonds (13, 17, 18) and this polarization does not depend upon the presence of a water molecule that simultaneously accepts H-bonds from both NPA asparagines.
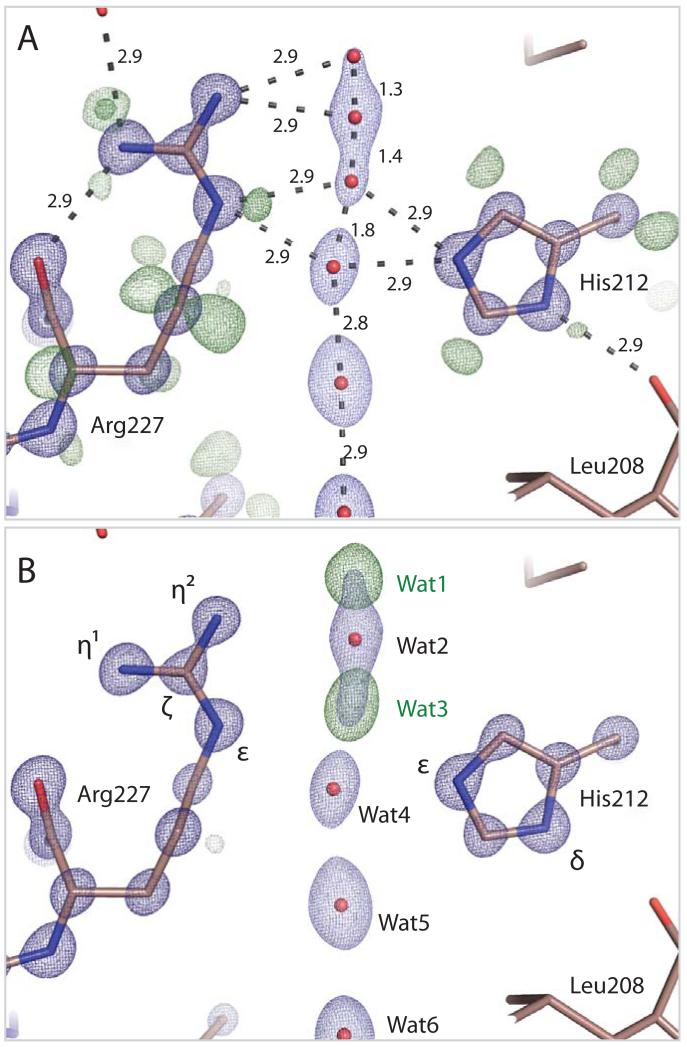
Within the SF, His212 and Arg227 are conserved among water selective aquaporins. The side-chain conformation of His212 is apparent from the stronger electron density visible for its two nitrogen atoms (Fig. 3). Residual mFobs-DFcalc electron density from a hydrogen omit map reveals that Nδ of His212 is protonated and donates an H-bond to the carbonyl oxygen of Leu208 (visible at 0.42 e/Å3) whereas Nδ is not protonated (Fig. 3A), thereby assigning its tautomeric state (fig. S2A). Similarly, the tautomeric state of Arg227 (fig. S2B) can be assigned since the covalent bond from Cζ of Arg227 to Nη2 (the nitrogen atom closest to the water channel) is most conjugated (Fig. 3A). Consistent with this assignment, electron clouds associated with the three protons of Nε and Nη1 are visible (Fig. 3A, 0.48, 0.42 and 0.36 peak maxima e/Å3 respectively) but no residual density is visible for the protons of Nη2, presumably because the associated electrons are more tightly drawn to a net positive charge on Nη2. This concentration of positive charge on the nitrogen atom closest to the pore maximizes Arg227’s electrostatic repulsive effect on hydronium ions and thereby helps inhibit their passage.
Figure 3.
Electron density within the Aqy1 SF. A, 2mFobs-DFcalc (dark blue, contoured at 4.3 e/Å3; light blue at 1.9 e/Å3) and residual mFobs-DFcalc (dark green, contoured at 0.42 e/Å3; light green contoured at 0.33 e/Å3) electron density associated with His212, Arg227 and water molecules within the SF. Atomic separations (Å) are indicated. Residual mFobs-DFcalc electron density reveals that Nδ of His212 is protonated whereas Nε is not. Connected 2mFobs-DFcalc electron density suggests that the Arg227 covalent bond from Cζ to Nη2 is preferentially conjugated. Four closely spaced water molecules are modeled within the SF with complementary occupancy (66% occupancy, positions 2 and 4; 34% occupancy, positions 1 and 3). B, mFobs-DFcalc omit electron density map calculated when Waters 1 and 3 are removed from the structural model (dark green, contoured at 0.65 e/Å3). Positive electron density features associated with these waters are the strongest within the channel.
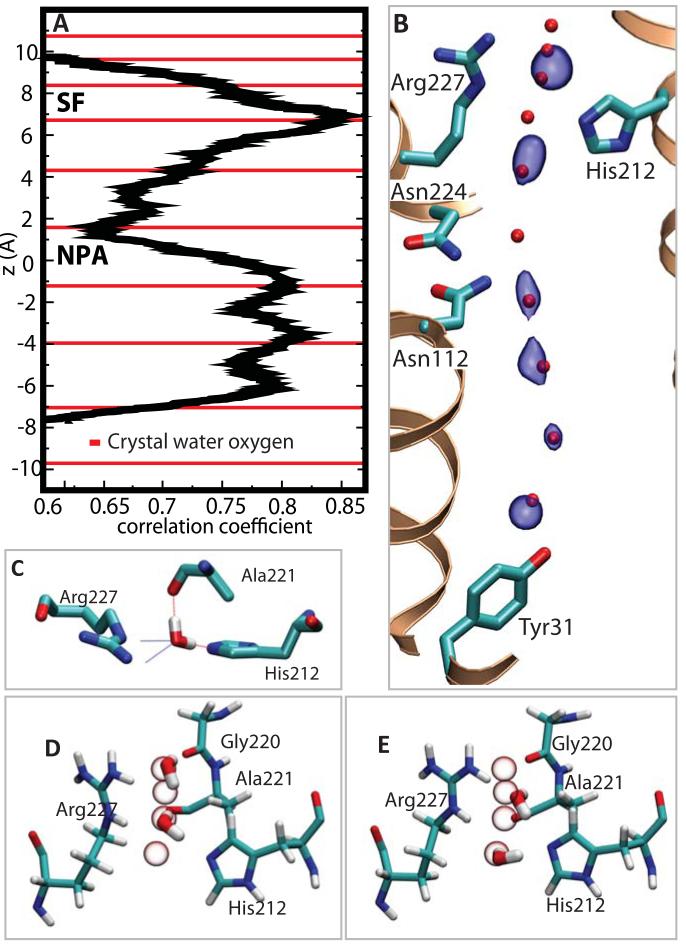
When two water molecules were built into the electron density between His212 and Arg227 (fig. S3) they had significantly lower 2mFobs-DFcalc maxima (5.0 and 5.2 e/Å3) than all other water molecules within the aquaporin pore (~7.0 to 8.0 e/Å3) and strong residual mFobs-DFcalc electron density peaks (maxima of 1.4 and 1.9 e/Å3) arose adjacent to these water molecules (Fig. 3B). Placement of two additional water molecules and unrestrained refinement of their crystallographic occupancies and B-factors revealed four stable water positions within the SF with complementary occupancies of 66% (Wat2 and Wat4, 2mFobs-DFcalc peak maxima of 5.2 and 5.0 e/Å3 respectively, Fig. 3) and 34% (Wat1 and Wat3, 2mFobs-DFcalc peak maxima of 2.4 and 3.2 e/Å3 respectively). Given their small separation (~1.5 Å, Fig. 3A) it is not possible for all four water positions to be occupied simultaneously. Although MD simulations predict only one high probability water position within the SF (between Wat2 and Wat3) when averaged over an entire trajectory (Fig. 4B), specific snapshots capture these crystallographic water configurations (Figs. 4D,E) and illustrate how water molecules move pair-wise through the SF while maintaining H-bond interactions with His212 and Arg227. This picture is analogous to the structural mechanism of ion transport through potassium channels, for which partial crystallographic occupancy of four K+-binding sites within the selectivity filter led to the proposal that potassium ions progress pair-wise through a sequence of four binding sites (30, 31). As argued for potassium channels (31), the similar crystallographic occupancy of the four aquaporin SF water positions implies very little energy difference between binding configurations 1,3 and 2,4, which is optimal for maximizing the water conduction rate.
Figure 4.
Molecular dynamics simulations of water movements in Aqy1. A, Plot illustrating the correlation of movements of adjacent water molecules. Strongly correlated movements arise in the SF and in the cytoplasmic half of the channel. The position of oxygen atoms of crystallographic waters are indicated as red lines. B, Surface representation (blue) of the most probable positions of water molecules (averaged over the final 15 ns of a 20 ns trajectory) superimposed upon the crystallographic water positions (red spheres). C, Snapshot of a water molecule within the SF with all four H-bond interactions occupied. D and E, Snapshots corresponding to 1,3 and 2,4 water occupancy of the SF indicating the pair-wise movement of water molecules in this region. All four closely spaced SF crystallographic water positions are indicated as white spheres.
Both high and low occupancy SF water positions have H-bond interactions with the same atoms: with Nη2 of Arg227 and the carbonyl oxygen of Gly220 for Wat1 and Wat2; and Nδ of Arg227, Nε of His212 and the carbonyl oxygen of Ala221 for Wat3 and Wat4 (Fig. 3A). MD snapshots illustrate how this geometry achieves exceptional water selectivity since all four H-bond donor and acceptor interactions are filled as water moves through the SF (Fig. 4C). The presence of four closely spaced water selective sites optimizes the aquaporin SF’s ability to discriminate water from other small molecules. Hydroxide ions, in particular, suffer a geometric penalty since they cannot simultaneously donate H-bonds to the backbone hydroxyl of Ala221 and to Nε of His212. Conversely, all H-bond interactions are distorted from ideal water geometry (fig. S4) and this avoids binding water too tightly such that efficient transport is compromised.
MD simulations reproduce the crystallographic positions of Waters 5 and 7 to 10 as the most probable channel water positions at any given moment (Fig. 4A) whereas the location of Wat6 is more diffuse, consistent with its higher anisotropic crystallographic B-factor. The H-bond connectivity of water molecules is significantly perturbed at both the NPA and the SF regions of the channel, preventing Grotthuss proton transport (fig. S5). Within the NPA region this disruption is accompanied by a reduction in the correlated motion of water molecules (Fig. 4B) since one water molecule (corresponding to Wat6) rapidly alternates its H-bond interactions between neighboring waters on either half of the channel. This finding is consistent with the crystal structure since residual mFobs-DFcalc electron density between Wat6 and Wat7 is significantly weaker than that observed between Waters 8, 9 and 10, and no residual density is visible between Wat5 and Wat6 to suggest a well defined H-bond (Fig. 2C). In contrast, water molecules move pair-wise through the SF in a highly correlated manner (Fig. 4B) and their connectivity to water molecules outside of the SF is weak. Correlated motions within the cytoplasmic half of the channel emerge from well defined water-water H-bond interactions (Fig. 2C) whereas the correlations observed within the SF appear to be dictated by protein-water H-bond interactions. In addition to electrostatic effects, a disruption of the highly constrained SF water structure (Fig. 3) can explain why the mechanism of proton exclusion is sensitive to mutation of the conserved selectivity filter arginine and histidine residues (27, 28). These findings illustrate how evolution has fine tuned the water channel geometry so as to optimize protein function, suppressing proton transport without compromising water flux.
Supplementary Material
Footnotes
Supporting Online Material
Materials and Methods.
Figs. S1 to S5.
Tables S1 and S2.
References
- 1.King LS, Kozono D, Agre P. From structure to disease: the evolving tale of aquaporin biology. Nat Rev Mol Cell Biol. 2004;5:687. doi: 10.1038/nrm1469. [DOI] [PubMed] [Google Scholar]
- 2.de Grotthuss CJT. Sur la décomposition de l’eau et des corps qu’elle tient en dissolution à l’aide de l’électricité galvanique. Ann. Chim. 1806;58:54. [Google Scholar]
- 3.Marx D. Proton transfer 200 years after von Grotthuss: insights from ab initio simulations. Chemphyschem. 2006;7:1848. doi: 10.1002/cphc.200600128. [DOI] [PubMed] [Google Scholar]
- 4.Fu D, et al. Structure of a glycerol-conducting channel and the basis for its selectivity. Science. 2000;290:481. doi: 10.1126/science.290.5491.481. [DOI] [PubMed] [Google Scholar]
- 5.Savage DF, Egea PF, Robles-Colmenares Y, O’Connell JD, 3rd, Stroud RM. Architecture and selectivity in aquaporins: 2.5 Å X-ray structure of aquaporin Z. PLoS Biol. 2003;1:E72. doi: 10.1371/journal.pbio.0000072. [DOI] [PMC free article] [PubMed] [Google Scholar]
- 6.Lee JK, et al. Structural basis for conductance by the archaeal aquaporin AqpM at 1.68 Å. Proc Natl Acad Sci U S A. 2005;102:18932. doi: 10.1073/pnas.0509469102. [DOI] [PMC free article] [PubMed] [Google Scholar]
- 7.Fischer G, et al. Crystal structure of a yeast aquaporin at 1.15 Ångstrom reveals a novel gating mechanism. PLoS Biol. 2009;7:e1000130. doi: 10.1371/journal.pbio.1000130. [DOI] [PMC free article] [PubMed] [Google Scholar]
- 8.Newby ZE, et al. Crystal structure of the aquaglyceroporin PfAQP from the malarial parasite Plasmodium falciparum. Nat Struct Mol Biol. 2008;15:619. doi: 10.1038/nsmb.1431. [DOI] [PMC free article] [PubMed] [Google Scholar]
- 9.Tornroth-Horsefield S, et al. Structural mechanism of plant aquaporin gating. Nature. 2006;439:688. doi: 10.1038/nature04316. [DOI] [PubMed] [Google Scholar]
- 10.Sui H, Han BG, Lee JK, Walian P, Jap BK. Structural basis of water-specific transport through the AQP1 water channel. Nature. 2001;414:872. doi: 10.1038/414872a. [DOI] [PubMed] [Google Scholar]
- 11.Harries WE, Akhavan D, Miercke LJ, Khademi S, Stroud RM. The channel architecture of aquaporin 0 at a 2.2-Å resolution. Proc Natl Acad Sci U S A. 2004;101:14045. doi: 10.1073/pnas.0405274101. [DOI] [PMC free article] [PubMed] [Google Scholar]
- 12.Gonen T, Sliz P, Kistler J, Cheng Y, Walz T. Aquaporin-0 membrane junctions reveal the structure of a closed water pore. Nature. 2004;429:193. doi: 10.1038/nature02503. [DOI] [PubMed] [Google Scholar]
- 13.Murata K, et al. Structural determinants of water permeation through aquaporin-1. Nature. 2000;407:599. doi: 10.1038/35036519. [DOI] [PubMed] [Google Scholar]
- 14.Horsefield R, et al. High-resolution x-ray structure of human aquaporin 5. Proc Natl Acad Sci U S A. 2008;105:13327. doi: 10.1073/pnas.0801466105. [DOI] [PMC free article] [PubMed] [Google Scholar]
- 15.Ho JD, et al. Crystal structure of human aquaporin 4 at 1.8 A and its mechanism of conductance. Proc Natl Acad Sci U S A. 2009;106:7437. doi: 10.1073/pnas.0902725106. [DOI] [PMC free article] [PubMed] [Google Scholar]
- 16.Wang Y, Schulten K, Tajkhorshid E. What makes an aquaporin a glycerol channel: A comparative study of AqpZ and GlpF. Structure. 2005;13:1107. doi: 10.1016/j.str.2005.05.005. [DOI] [PubMed] [Google Scholar]
- 17.Tajkhorshid E, et al. Control of the selectivity of the aquaporin water channel family by global orientational tuning. Science. 2002;296:525. doi: 10.1126/science.1067778. [DOI] [PubMed] [Google Scholar]
- 18.de Groot BL, Grubmuller H. Water permeation across biological membranes: mechanism and dynamics of aquaporin-1 and GlpF. Science. 2001;294:2353. doi: 10.1126/science.1066115. [DOI] [PubMed] [Google Scholar]
- 19.Ilan B, Tajkhorshid E, Schulten K, Voth GA. The mechanism of proton exclusion in aquaporin channels. Proteins. 2004;55:223. doi: 10.1002/prot.20038. [DOI] [PubMed] [Google Scholar]
- 20.Chakrabarti N, Tajkhorshid E, Roux B, Pomes R. Molecular basis of proton blockage in aquaporins. Structure. 2004;12:65. doi: 10.1016/j.str.2003.11.017. [DOI] [PubMed] [Google Scholar]
- 21.de Groot BL, Frigato T, Helms V, Grubmuller H. The mechanism of proton exclusion in the aquaporin-1 water channel. J Mol Biol. 2003;333:279. doi: 10.1016/j.jmb.2003.08.003. [DOI] [PubMed] [Google Scholar]
- 22.Jensen MO, Tajkhorshid E, Schulten K. Electrostatic tuning of permeation and selectivity in aquaporin water channels. Biophys J. 2003;85:2884. doi: 10.1016/S0006-3495(03)74711-0. [DOI] [PMC free article] [PubMed] [Google Scholar]
- 23.de Groot BL, Grubmüller H. The dynamics and energetics of water permeation and proton exclusion in aquaporins. Curr. Opin. Struct. Biol. 2005;15:176. doi: 10.1016/j.sbi.2005.02.003. [DOI] [PubMed] [Google Scholar]
- 24.Burykin A, Warshel A. What really prevents proton transport through aquaporin? Charge self-energy versus proton wire proposals. Biophys J. 2003;85:3696. doi: 10.1016/S0006-3495(03)74786-9. [DOI] [PMC free article] [PubMed] [Google Scholar]
- 25.Wu B, Steinbronn C, Alsterfjord M, Zeuthen T, Beitz E. Concerted action of two cation filters in the aquaporin water channel. EMBO J. 2009;28:2188. doi: 10.1038/emboj.2009.182. [DOI] [PMC free article] [PubMed] [Google Scholar]
- 26.Wree D, Wu B, Zeuthen T, Beitz E. Requirement for asparagine in the aquaporin NPA sequence signature motifs for cation exclusion. FEBS J. 2011;278:740. doi: 10.1111/j.1742-4658.2010.07993.x. [DOI] [PubMed] [Google Scholar]
- 27.Beitz E, Wu B, Holm LM, Schultz JE, Zeuthen T. Point mutations in the aromatic/arginine region in aquaporin 1 allow passage of urea, glycerol, ammonia, and protons. Proc Natl Acad Sci U S A. 2006;103:269. doi: 10.1073/pnas.0507225103. [DOI] [PMC free article] [PubMed] [Google Scholar]
- 28.Li H, et al. Enhancement of proton conductance by mutations of the selectivity filter of aquaporin-1. J Mol Biol. 2011;407:607. doi: 10.1016/j.jmb.2011.01.036. [DOI] [PubMed] [Google Scholar]
- 29.Materials and methods are available as supporting material on Science Online.
- 30.Zhou Y, Morais-Cabral JH, Kaufman A, MacKinnon R. Chemistry of ion coordination and hydration revealed by a K+ channel-Fab complex at 2.0 Å resolution. Nature. 2001;414:43. doi: 10.1038/35102009. [DOI] [PubMed] [Google Scholar]
- 31.Morais-Cabral JH, Zhou Y, MacKinnon R. Energetic optimization of ion conduction rate by the K+ selectivity flter. Nature. 2001;414:37. doi: 10.1038/35102000. [DOI] [PubMed] [Google Scholar]
- 32.Financial support is acknowledged from the European Union Integrated Project EDICT and the Marie Curie Training Network Aqua(glycero)porins, the Olle Engkvist Foundation, the Swedish Research Council, and National Institutes of Health (grants R01-GM086749, U54-GM087519, and P41-GM104601). All simulations were performed using XSEDE resources at National Science Foundation supercomputing centers (grant MCA06N060). We thank staff of beamline ID29 of the ESRF for assistance during data collection and Karin Rödstrom for setting up crystallization plates at the ESRF in advance of data-collection. The authors have made the following contributions: GF, UKE and RN conceived and designed the experiments; GF and UKE performed the experiments; GF, RF and UKE analyzed the crystallographic data; GE and ET conceived and designed the MD simulations; GE performed and analyzed the simulations. All authors contributed to writing the manuscript. Coordinates and structure factors have been deposited in the Protein Data Bank with accession number 3zoj.
- 33.Kabsch W. Integration, scaling, space-group assignment and post-refinement. Acta Crystallogr D Biol Crystallogr. 2010;66:133. doi: 10.1107/S0907444909047374. [DOI] [PMC free article] [PubMed] [Google Scholar]
- 34.Winn MD, et al. Overview of the CCP4 suite and current developments. Acta Crystallogr D Biol Crystallogr. 2011;67:235. doi: 10.1107/S0907444910045749. [DOI] [PMC free article] [PubMed] [Google Scholar]
- 35.Vonrhein C, et al. Data processing and analysis with the autoPROC toolbox. Acta Crystallogr D Biol Crystallogr. 2011;67:293. doi: 10.1107/S0907444911007773. [DOI] [PMC free article] [PubMed] [Google Scholar]
- 36.Emsley P, Cowtan K. Coot: model-building tools for molecular graphics. Acta Crystallogr D Biol Crystallogr. 2004;60:2126. doi: 10.1107/S0907444904019158. [DOI] [PubMed] [Google Scholar]
- 37.The CCP4 suite: programs for protein crystallography. Acta Crystallogr D Biol Crystallogr. 1994;50:760. doi: 10.1107/S0907444994003112. [DOI] [PubMed] [Google Scholar]
- 38.Sheldrick GM. A short history of SHELX. Acta Crystallogr A. 2008;64:112. doi: 10.1107/S0108767307043930. [DOI] [PubMed] [Google Scholar]
- 39.The PyMOL Molecular Graphics System, Version 1.5.0.4. Schrödinger, LLC; [Google Scholar]
- 40.Lomize MA, Lomize AL, Pogozheva ID, Mosberg HI. OPM: orientations of proteins in membranes database. Bioinformatics. 2006;22:623. doi: 10.1093/bioinformatics/btk023. [DOI] [PubMed] [Google Scholar]
- 41.Chen VB, et al. MolProbity: all-atom structure validation for macromolecular crystallography. Acta Crystallogr D Biol Crystallogr. 2010;66:12. doi: 10.1107/S0907444909042073. [DOI] [PMC free article] [PubMed] [Google Scholar]
- 42.Jo S, Kim T, Iyer VG, Im W. CHARMM-GUI: a web-based graphical user interface for CHARMM. J Comput Chem. 2008;29:1859. doi: 10.1002/jcc.20945. [DOI] [PubMed] [Google Scholar]
- 43.Humphrey W, Dalke A, Schulten K. VMD: visual molecular dynamics. J Mol Graph. 1996;14:33. doi: 10.1016/0263-7855(96)00018-5. [DOI] [PubMed] [Google Scholar]
- 44.Phillips JC, et al. Scalable molecular dynamics with NAMD. J Comput Chem. 2005;26:1781. doi: 10.1002/jcc.20289. [DOI] [PMC free article] [PubMed] [Google Scholar]
- 45.Mackerell AD, Jr., Feig M, Brooks CL., 3rd Extending the treatment of backbone energetics in protein force fields: limitations of gas-phase quantum mechanics in reproducing protein conformational distributions in molecular dynamics simulations. J Comput Chem. 2004;25:1400. doi: 10.1002/jcc.20065. [DOI] [PubMed] [Google Scholar]
- 46.Klauda JB, et al. Update of the CHARMM all-atom additive force field for lipids: validation on six lipid types. J Phys Chem B. 2010;114:7830. doi: 10.1021/jp101759q. [DOI] [PMC free article] [PubMed] [Google Scholar]
- 47.Jorgensen WL, Chandrasekhar J, Madura JD, Impey RW, Klein ML. Comparison of simple potential functions for simulating liquid water. J Chem Phys. 1983;79:926. [Google Scholar]
- 48.Martyna GJ, Tobias DJ, Klein ML. Constant pressure molecular dynamics algorithms. J Chem Phys. 1994;101:4177. [Google Scholar]
- 49.Feller SE, Zhang Y, Pastor RW, Brooks BR. Constant pressure molecular dynamics simulation: The Langevin piston method. J Chem Phys. 1995;103:4613. [Google Scholar]
- 50.Darden T, York D, Pedersen L. Particle mesh Ewald: An N-log(N) method for Ewald sums in large systems. J Chem Phys. 1993;98:10089. [Google Scholar]
Associated Data
This section collects any data citations, data availability statements, or supplementary materials included in this article.


