

Abstract
Response inhibition is the ability to suppress irrelevant impulses to enable goal-directed behavior. The underlying neural mechanisms of inhibition deficits are not clearly understood, but may be related to white matter connectivity, which can be assessed using diffusion tensor imaging (DTI). The goal of this study was to investigate the relationship between response inhibition during the performance of saccadic eye movement tasks and DTI measures of the corpus callosum in children with or without Fetal Alcohol Spectrum Disorder (FASD). Participants included 43 children with an FASD diagnosis (12.3 ± 3.1 years old) and 35 typically developing children (12.5 ± 3.0 years old) both aged 7–18, assessed at three sites across Canada. Response inhibition was measured by direction errors in an antisaccade task and timing errors in a delayed memory-guided saccade task. Manual deterministic tractography was used to delineate six regions of the corpus callosum and calculate fractional anisotropy (FA), mean diffusivity (MD), parallel diffusivity, and perpendicular diffusivity. Group differences in saccade measures were assessed using t-tests, followed by partial correlations between eye movement inhibition scores and corpus callosum FA and MD, controlling for age. Children with FASD made more saccade direction errors and more timing errors, which indicates a deficit in response inhibition. The only group difference in DTI metrics was significantly higher MD of the splenium in FASD compared to controls. Notably, direction errors in the antisaccade task were correlated negatively to FA and positively to MD of the splenium in the control, but not the FASD group, which suggests that alterations in connectivity between the two hemispheres of the brain may contribute to inhibition deficits in children with FASD.
Abbreviations: FASD, Fetal Alcohol Spectrum Disorder; FA, fractional anisotropy; MD, mean diffusivity; DTI, diffusion tensor imaging; FP, fixation point; SRT, saccadic reaction time; ROI, region of interest; ICC, Intraclass correlation coefficient
Keywords: Fetal Alcohol Spectrum Disorder, Diffusion tensor imaging, Response inhibition, Eye movement control
Highlights
-
•
Previous research has found response inhibition deficits in children with FASD.
-
•
The objective was to assess the relationship between inhibition and white matter.
-
•
Each participant completed eye movement tasks and diffusion tensor imaging (DTI).
-
•
FASD had significantly greater MD in splenium and increased eye movement errors.
-
•
Inhibition correlated with FA (negative) and MD (positive) in splenium of controls.
1. Introduction
Response inhibition is the ability to suppress irrelevant stimuli or behavioral impulses to enable goal-directed behavior. Evidence from functional neuroimaging, animal models and human lesion studies indicates that the prefrontal cortex (Aron and Poldrack, 2005; Iversen and Mishkin, 1970), anterior cingulate cortex (Liddle et al., 2001), and corpus callosum (Bearden et al., 2011; Gadea et al., 2009; Stewart et al., 2003) all play a vital role in response inhibition. Eye movement control tasks have been used to measure response inhibition in typically developing children across a wide age range and have found that inhibitory skill increases with age (Hwang et al., 2010). Saccades are rapid eye movements that bring new visual targets onto the fovea of the retina and require multiple brain regions for successful execution. A number of brain regions have been associated with eye movement control, including the dorsolateral prefrontal cortex (DeSouza et al., 2003; Funahashi et al., 1993), lateral intraparietal area (Gottlieb and Goldberg, 1999; Schlag-Rey et al., 1997; Zhang and Barash, 2000), frontal eye fields (Everling and Munoz, 2000), secondary eye fields (Amador et al., 2004; Schlag-Rey et al., 1997) and superior colliculus (Everling et al., 1998, 1999). However, less is known about the role that white matter tracts play in eye movement control. Successful saccades most likely involve the corpus callosum, the largest white matter structure in the brain, which links homologous areas in the right and left hemispheres. This paper investigates the corpus callosum in terms of its relationship with eye movement control (Bruni and Montemurro, 2009). More specifically, the splenium, the most posterior sector of the corpus callosum, has been linked to the striate and extrastriate visual areas which are cortical targets implicated in sensorimotor processing (Putnam et al., 2010).
Eye movement control tasks have emerged as a portable and cost-effective method which can effectively measure cognitive, sensory, and motor functions in different clinical populations (Ramat et al., 2007). For example, eye movement control measures have been used to characterize deficits in executive functions and motor control in children that have prenatal alcohol exposure (Green et al., 2007, 2009; Paolozza et al., 2013, 2014a,b). Prenatal alcohol exposure induces a spectrum of adverse effects that can be categorized into several diagnostic subgroups, collectively referred to as Fetal Alcohol Spectrum Disorder (FASD) (Chudley et al., 2005). Eye movement tasks have revealed that error rates in the antisaccade task, which requires participants to suppress an automatic response towards a target and instead make a voluntary saccade in the opposite direction, are significantly elevated in children with FASD (Green et al., 2009; Paolozza et al., 2013, 2014a). Additionally, in a previous study that utilized a memory-guided saccade task which requires the participant to remember the spatial location and sequence of presentation of two visual targets (Paolozza et al., 2013, 2014b), we showed that children with FASD were unable to inhibit the automatic response and looked to the visual targets before receiving the appropriate go signal. These studies show that the suppression of automatic saccades coupled with the generation of voluntary saccades by a goal-directed plan is adversely affected in FASD.
Previous structural magnetic resonance imaging (MRI) and autopsy studies have reported widespread brain injury in those diagnosed with FASD in many of the aforementioned cortical gray matter regions and white matter including the corpus callosum (Autti-Ramo et al., 2002; Clarren and Smith, 1978; Riley et al., 1995; Swayze et al., 1997). Diffusion tensor imaging (DTI) can examine white matter integrity by measuring water diffusion in the brain. This method allows for the reconstruction of individual white matter pathways and provides quantitative measures, such as fractional anisotropy (FA) and mean diffusivity (MD), presumed to reflect cellular properties such as myelination and coherence/packing of axons (Beaulieu, 2002). DTI studies of the corpus callosum in FASD populations have revealed abnormalities of FA and MD in various tracts (Fryer et al., 2009; Lebel et al., 2008, 2010; Li et al., 2009; Ma et al., 2005; Sowell et al., 2008; Wozniak et al., 2006, 2009). FA measures in the corpus callosum have correlated with saccadic reaction time in two eye movement tasks in children with FASD (Green et al., 2013); however this paper had no control group and a relatively small sample size (n = 14). Additionally, it used a voxel-based analysis of the corpus callosum, which relies heavily on adequate spatial normalization that can be problematic for the corpus callosum (Snook et al., 2007). Tractography of individual white matter tracts overcomes this limitation and yields diffusion parameters averaged over an entire tract rather than individual voxels.
This paper reports the findings from the first DTI tractography study to examine white matter integrity in relation to performance on inhibition measures obtained from two eye movement control tasks, including a memory-guided saccade task, in a cohort of children with FASD recruited in the multi-site NeuroDevNet study (Reynolds et al., 2011). We hypothesized that FA and MD of the corpus callosum, as well as saccadic eye movements will be significantly different in children with FASD (n = 43, age range 7–18 years) when compared to controls (n = 35, age range 7–18 years). We also hypothesized that these measures will be related to one another.
2. Methods
2.1. Participants
Participants aged 7–18 years were recruited at three sites across Canada and had either a confirmed diagnosis of FASD (n = 47) or were typically developing control children (n = 41). Children with FASD were previously assessed and diagnosed according to the Canadian Guidelines for FASD diagnosis (Chudley et al., 2005) and were recruited through diagnostic clinics in Kingston, ON, Ottawa, ON, Edmonton, AB, Cold Lake, AB, and Winnipeg, MB, as part of a larger study funded by NeuroDevNet (Reynolds et al., 2011). The performance on a battery of psychometric tests and the link with eye movement control has been previously reported in a larger cohort from which the current subsample was extracted (Paolozza et al., 2014a,b). All experimental procedures were reviewed and approved by the Human Research Ethics Boards at Queen's University, University of Alberta, Children's Hospital of Eastern Ontario, and the University of Manitoba. Written informed consent was obtained from a parent or legal guardian and assent was obtained from each child before study participation. Due to quality control measures (movement, braces, etc.), 4 participants with FASD were excluded from analysis, leaving 43 FASD participants with adequate DTI data, scanned in either Kingston (n = 18; mean age = 12.6 ± 3.4; 9 males), Edmonton (n = 15; mean age = 11.5 ± 3.3; 8 males), or Winnipeg (n = 10; mean age = 12.9 ± 1.5; 5 males). Typically developing control children (n = 41) were recruited from the same geographical areas and 6 were excluded due to either a pre-existing disorder or failing quality control measures, leaving 35 control participants scanned in Kingston (n = 14; mean age = 13.8 ± 3.1; 8 males), Edmonton (n = 12; mean age = 11.6 ± 2.7; 3 males), and Winnipeg (n = 9; mean age = 11.1 ± 2.7; 2 males). Participant information is summarized in Table 1. Socioeconomic status (SES) was calculated using Hollingshead's Four-factor Index of Social Status for the FASD and control groups and analyzed for group differences (Hollingshead, 1975). Study data were collected and managed using REDCap electronic data capture tools (Harris et al., 2009) and LORIS imaging database hosted at Queen's University (Das et al., 2011).
Table 1.
Demographic characteristics.
| Diagnostic subtype n (%) | Control (n = 35) | FASD (n = 43) |
|---|---|---|
| FAS | – | 3 (7) |
| pFAS | – | 9 (21) |
| ARND | – | 31 (72) |
| Demographics | t-Test p-value | ||
|---|---|---|---|
| Mean age ± SD (range) | 12.5 ± 3.0 (7–18) | 12.3 ± 3.1 (7–18) | 0.90 |
| Males n (%) | 14 (39) | 23 (53) | 0.22 |
| Right handed n (%) | 35 (97) | 39 (91) | 0.24 |
| Socioeconomic status | 47 | 44 | 0.34 |
| Chi-squared p-value | |||
| Caucasian n (%) | 34 (94) | 16 (37) | < 0.0001 |
| First Nations n (%) | 0 (0) | 13 (30) | < 0.0001 |
| Other Ethnicity n (%) | 2 (6) | 14 (33) | < 0.0001 |
| Comorbidities n (%) | Chi-squared p-value | ||
| ADHD | 0 (0) | 25 (58) | < 0.0001 |
| ODD | 0 (0) | 5 (12) | 0.0004 |
| Anxiety | 0 (0) | 7 (16) | < 0.0001 |
| Depression | 0 (0) | 4 (9) | 0.002 |
| Other | 0 (0) | 16 (37) | < 0.0001 |
| Medications n (%) | Chi-squared p-value | ||
| Stimulants | 0 (0) | 22 (51) | < 0.0001 |
| Antipsychotics | 0 (0) | 11 (26) | < 0.0001 |
| Antidepressant | 0 (0) | 5 (12) | 0.0004 |
| Other | 0 (0) | 2 (5) | 0.024 |
FASD = Fetal Alcohol Spectrum Disorder; FAS = Fetal Alcohol Syndrome; pFAS = Partial Fetal Alcohol Syndrome; SD = standard deviation; ARND = Alcohol Related Neurodevelopment Disorder; n = number; ADHD = Attention Deficit Hyperactivity Disorder; ODD = Oppositional Defiant Disorder.
2.2. Saccadic eye movement recordings
Participants were seated comfortably in a dark, quiet room on a stable chair and instructions for each trial were given verbally, and repeated before each task started. Eye position was recorded using the Eyelink 1000 (SR Research, Kanata, ON), using previously described methods (Paolozza et al., 2014a). In the antisaccade task, each trial started with illumination of a central fixation point (FP), which then disappeared and, after a delay of 200 ms (gap period), a peripheral target appeared randomly at 10° to the left or right of the central FP. Participants were instructed to complete a saccade in the opposite direction of the target. No error feedback was given. One block of 60 trials was obtained from each participant. In the memory-guided saccade task, participants were instructed to maintain fixation at the central FP, after which two peripheral targets appeared in immediate succession and participants were required to fixate for an additional 0, 600, 1200, or 1800 ms (randomly allocated) between the disappearance of the second peripheral target and the disappearance of the FP. After the FP and peripheral targets disappeared, participants were required to make two saccades as accurately as possible to these locations in the same sequence. A single block of 72 trials was collected for this task.
2.3. Quality control of eye tracking measures
Data were analyzed using custom software developed in MATLAB (R2009b, The Mathworks, Inc, Natick, Massachusetts). Saccades were defined as having a speed of greater than 2.5 times the standard deviation of the background noise (measured during fixation) for at least 5 continuous sample points in time. The only trials used were those for which the participant was fixating on the FP at the appropriate time. If the participant broke fixation inappropriately (i.e. not to a target location or away from the screen) the trial was discarded from analysis. Any trials where eye tracking was lost were removed in the analysis, and to be included each participant had to achieve greater than 50% viable trials in each of the tasks.
2.4. Saccade outcome measures
Saccade performance for all viable trials for the two tasks was assessed by examining several outcome measures. Saccadic reaction time (SRT) in the antisaccade task was defined as the time from the appearance of the peripheral target to the initiation of the first saccade during a correct trial. Direction errors were defined as any initial saccade in the wrong direction with respect to the instruction (i.e., towards the target). Anticipatory errors were defined as any saccade to one of the two target locations before the appearance of the target itself can be perceived (i.e. within 90 ms after peripheral target appearance).
In the memory-guided task, SRTs of both the first and second saccades were calculated from the disappearance of the central FP during a correct trial. Individual trials were assigned as either correct, timing errors (saccades initiated before 90 ms after the go signal), and/or sequence errors (initial saccade made closer to the second peripheral target location than to the first target, therefore in the wrong sequence).
Eye movement measures were age-corrected using the entire NeuroDevNet control cohort (n = 102, mean age = 10.4 ± 3.1) to calculate a standardized t-score equation for each age. Standard scores for the control and FASD groups in the current study were then calculated using the age-dependent t-score equation obtained from the larger control group. Differences between groups were analyzed using a t-test.
2.5. Image acquisition
Brain MRI was collected at 3 sites (Edmonton, AB, 1.5T Siemens Sonata; Kingston, ON, and Winnipeg, MB, both 3T Siemens Trio), including DTI, T1-weighted (not used here), T2-weighted (not used here), fluid-attenuated inversion recovery (FLAIR; not used here), and resting state functional MRI (not used here) scans for a total scan time of ~ 20 min. All DTI was acquired using a dual spin-echo echo planar imaging sequence with: 2.2 mm isotropic voxels, 50 axial-oblique slices with no interslice gap; 30 non-collinear diffusion sensitizing gradient directions with b = 1000 s/mm2; 5 (Edmonton) or 1 (Kingston and Winnipeg) b = 0 s/mm2; 1 average; FOV = 220 × 220 mm2; matrix of 96 × 96; TE = 94 ms; TR = 6600 ms (Kingston and Winnipeg) or TR = 7700 ms (Edmonton); acquisition time 3:46 min.
2.6. Tractography
Manual deterministic tractography of the corpus callosum was performed in ExploreDTI (Leemans et al., 2009) by a single operator (AEP), blinded to participant group, age, sex, and handedness. The corpus callosum was divided into 6 segments (genu, rostral body, anterior midbody, posterior midbody, isthmus, and splenium) according to a previously defined method (Witelson, 1989). Seed regions of interest (ROI) were manually placed on the same mid-sagittal slice and “Not” ROIs were used to exclude any spurious tracts (Fig. 1). FA, MD, parallel diffusivity (λII), and perpendicular diffusivity (λ⊥) were calculated (averaging across all voxels in a given tract) and compared between the two groups using a one-way ANCOVA, with age as a covariate. Test–retest reliability was determined by measuring FA of each tract twice each on a random subset of Kingston participants (n = 15). Intraclass correlation coefficients (ICC) of test–retest FA values within individuals yielded a high reliability (0.922 to 0.957). To inspect subject motion we evaluated group differences using a t-test for rotation, translation, scale and skew corrections in ExploreDTI. We found no significant differences between the groups, which suggests that the FASD group did not move more than the control group.
Fig. 1.
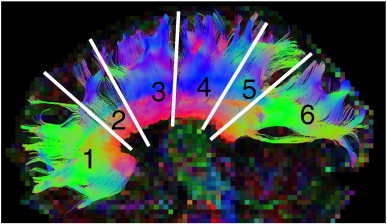
Tractography of the corpus callosum.
The corpus callosum was manually segmented into six inter-hemispheric tracts (anterior to posterior). Tract 1 is the genu, tract 2 is the rostral body, tract 3 is the anterior midbody, tract 4 is the posterior midbody, tract 5 is the isthmus, and tract 6 is the splenium.
2.7. Reliability study
Since all 3 sites had slightly different protocols and scanners, a separate reliability study was performed to determine if data could be combined across sites. Eight healthy adult controls (mean age 28 ± 6 years, 2 males) were scanned twice at each site (getting out of scanner between the two scans), each within a 2 week period (6 scans per person, 48 scans total). The data were then analyzed by the same operator (AEP) in the exact same manner as the study data by dividing the corpus callosum into the same 6 sub-regions. To examine the operator reliability and scanner consistency, ICCs of FA between the two scans at each site were calculated and found to range from 0.957 to 0.995, indicating high reliability of the operator and scanner. To analyze the difference between sites, within each participant, the coefficient of variation and ICC was calculated for each participant across all sites for all 6 tracts. The average COV was 2.02% and ICCs ranged from 0.49 (splenium) to 0.93 (genu) (Fig. 2). To analyze the difference between participants within sites, the coefficient of variation (COV) and the ICC were calculated for each site using all 6 scans per subject for all 6 tracts. The mean COV was found to be 3.48% and the ICC ranged from 0.23 (posterior midbody) to 0.73 (genu). We ran the same analysis for MD and found similar results to FA where the mean COV between sites was 3.8% with an ICC ranging from 0.99 (genu) to 0.71 (isthmus), and the mean COV between participants was 3.2% with an ICC ranging from 0.38 (splenium) to 0.96 (genu), indicating that the site introduced less variation in FA and MD than the participants themselves. Given the low variability between scanners, the data for all three sites were combined for the analysis. Additionally, there were no systematic effects where FA was higher at one site than other sites for the 8 individuals.
Fig. 2.
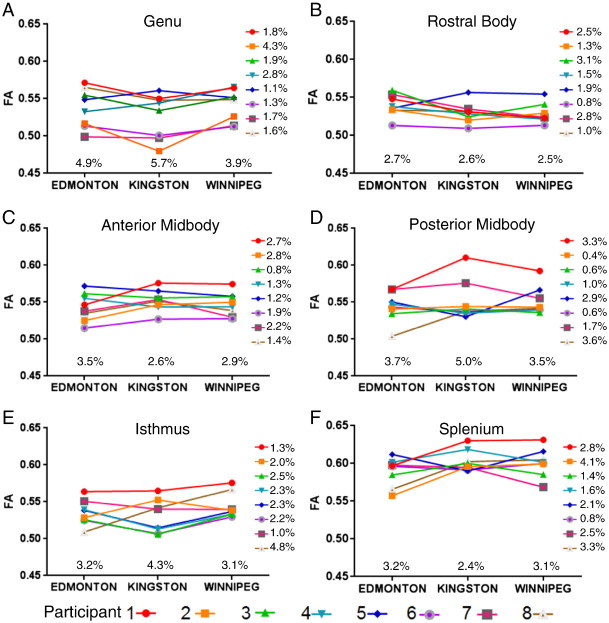
Intra- and inter-subject variability between sites.
The mean FA value of the two scans at each site is shown for 8 participants scanned in Edmonton (Siemens Sonata 1.5T), Kingston and Winnipeg (both with Siemens Trio 3T). In general, the ranking of the participants with the highest/lowest FA was maintained across all three scanner sites. Thus, the FA for each participant was quite consistent across the three sites with coefficient of variations ranging from 0.4 to 4.8% (mean 2.0%) for the six tracts (shown at the right of each plot). FA variation between sites within-individuals (shown to the right of each plot) was less than the FA variability between the 8 participants within each site which ranged from 2.4 to 5.7% (mean 3.5%).
2.8. Correlation analysis
Hypothesis-driven partial correlations (correcting for age) were used to identify whether the inhibition measures from the eye tracking tasks were associated with FA or MD of each of the 6 corpus callosum sub-regions, with the Holm–Sidak correction for multiple comparisons. Specifically, correlations of direction errors from the antisaccade task and timing errors from the memory-guided task were assessed versus FA and MD of all 6 corpus callosum tracts. Hypothesis-driven correlations were chosen based on the group differences observed on both the eye movement and DTI scores.
3. Results
3.1. Eye movement control
The FASD group displayed multiple deficits in eye movement control on both the antisaccade and memory-guided tasks (Table 2). On the antisaccade task, children with FASD had significantly slower SRT, more anticipatory errors, and more direction errors compared to controls. On the memory-guided saccade task, the FASD group was not different from controls on SRT, but had significantly more sequence errors and timing errors than controls.
Table 2.
Eye tracking measures.
| Measure | Control |
FASD |
p-Value | t-Value | ||
|---|---|---|---|---|---|---|
| Mean ± SEM | Range | Mean ± SEM | Range | |||
| Antisaccade task | ||||||
| SRT (t-score) | 50.0 ± 1.8 | 34.1–73.3 | 56.4 ± 2.0 | 30.3–92.7 | 0.021⁎ | 2.4 |
| Anticipatory (t-score) | 50.0 ± 1.7 | 38.1–76.6 | 58.5 ± 2.9 | 23.2–118.2 | 0.019⁎ | 2.4 |
| Direction errors (t-score) | 48.4 ± 1.4 | 34.5–64.4 | 55.7 ± 2.1 | 33.0–102.9 | 0.0074⁎ | 2.8 |
| Memory-guided task | ||||||
| SRT 1st saccade (t-score) | 49.9 ± 1.5 | 38.1–72.2 | 54.8 ± 3.5 | 26.3–95.0 | 0.23 | 1.2 |
| SRT 2nd saccade (t-score) | 49.3 ± 1.5 | 31.4–66.8 | 48.2 ± 1.9 | 17.1–73.9 | 0.64 | 0.5 |
| Sequence errors (t-score) | 48.8 ± 1.4 | 36.8–62.7 | 56.3 ± 3.0 | 19.6–121.7 | 0.039⁎ | 2.1 |
| Timing errors (t-score) | 49.2 ± 1.7 | 35.9–71.9 | 61.4 ± 3.6 | 37.4–133.0 | 0.0049⁎ | 2.9 |
FASD = Fetal Alcohol Spectrum Disorder; SRT = saccadic reaction time; SEM = standard error of the mean.
Indicates significance at p < 0.05.
3.2. DTI measures
Group differences of either MD or FA between control and FASD were only found for MD of the splenium which was significantly higher in the FASD group compared to the healthy controls, after correcting for age (F(1,79) = 11.3, p = 0.018; Table 3). In the splenium, FA was found to increase with increasing age for both the control (p = 0.019) and FASD (p < 0.0001) groups (Fig. 3A & B). Additionally, MD in the splenium was found to decrease with increasing age in both the FASD (p = 0.008) and control (p = 0.016) groups (Fig. 3C & D). In the splenium, parallel diffusivity was significantly higher in the FASD group when compared to controls (control mean = 1.47 ± 0.06 × 10− 3 mm2/s, FASD mean = 1.52 ± 0.07 × 10− 3 mm2/s, F(1,79) = 3.3, p = 0.004), whereas perpendicular diffusivity was not different (control mean = 0.49 ± 0.03 × 10− 3 mm2/s, FASD mean = 0.51 ± 0.05 × 10− 3 mm2/s, p = 0.15).
Table 3.
DTI group differences.
| Site | Measure | Control (mean ± SD) | FASD (mean ± SD) | p-Value |
|---|---|---|---|---|
| Genu | FA | 0.56 ± 0.02 | 0.55 ± 0.03 | 0.31 |
| MD (mm2/s × 10− 3) | 0.80 ± 0.03 | 0.81 ± 0.04 | 0.22 | |
| Rostral body | FA | 0.54 ± 0.02 | 0.54 ± 0.03 | 0.96 |
| MD (mm2/s × 10− 3) | 0.81 ± 0.03 | 0.82 ± 0.05 | 0.33 | |
| Anterior midbody | FA | 0.55 ± 0.02 | 0.55 ± 0.03 | 0.34 |
| MD (mm2/s × 10− 3) | 0.81 ± 0.04 | 0.83 ± 0.04 | 0.075 | |
| Posterior midbody | FA | 0.55 ± 0.02 | 0.54 ± 0.04 | 0.17 |
| MD (mm2/s × 10− 3) | 0.83 ± 0.03 | 0.85 ± 0.06 | 0.088 | |
| Isthmus | FA | 0.55 ± 0.02 | 0.54 ± 0.04 | 0.19 |
| MD (mm2/s × 10− 3) | 0.83 ± 0.03 | 0.84 ± 0.04 | 0.097 | |
| Splenium | FA | 0.60 ± 0.03 | 0.60 ± 0.03 | 0.89 |
| MD (mm2/s × 10− 3) | 0.82 ± 0.03 | 0.84 ± 0.05 | 0.018⁎ |
FASD = Fetal Alcohol Spectrum Disorder; FA = fractional anisotropy; MD = mean diffusivity; SD = standard deviation.
Indicates significance at p < 0.05.
Fig. 3.
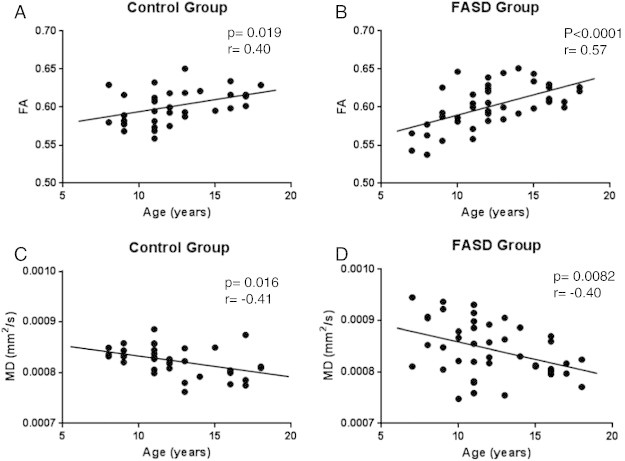
FA and MD changes with age in the splenium.
The correlation between the FA and age is shown for the control (A; n = 35) and FASD (B; n = 43) groups separately. Both groups show increases in FA as age increases.
The correlation between the MD and age is shown for the control (C; n = 35) and FASD (D; n = 43) groups separately. Both groups show decreases in MD as age increases.
3.3. Correlational analyses
After correcting for multiple comparisons, two significant correlations were found (Table 4). The first was a negative correlation between direction errors in the antisaccade task and FA of the splenium within the control group (p = 0.001) (Fig. 4A). This indicates that control participants with higher FA also made fewer errors on the antisaccade task. A positive correlation between the MD of the splenium and direction errors was also significant in the control group (p = 0.009) (Fig. 4C). In contrast, the FASD group showed no significant correlation between FA of the splenium and direction errors in the antisaccade task (p = 0.31; Fig. 4B) or MD of the splenium and direction errors (p = 0.87; Fig. 4D).
Table 4.
Correlations between FA and MD in the corpus callosum with direction errors from the antisaccade task.
| Correlation versus antisaccade direction errors | Control |
FASD |
||
|---|---|---|---|---|
| Pearson r | p-Value | Pearson r | p-Value | |
| Genu FA | − 0.19 | 0.280 | − 0.12 | 0.438 |
| Genu MD | 0.30 | 0.078 | 0.28 | 0.067 |
| Rostral body FA | − 0.11 | 0.542 | − 0.02 | 0.926 |
| Rostral body MD | 0.01 | 0.937 | 0.048 | 0.765 |
| Anterior midbody FA | − 0.21 | 0.237 | − 0.12 | 0.457 |
| Anterior midbody MD | 0.07 | 0.720 | 0.07 | 0.674 |
| Posterior midbody FA | − 0.09 | 0.605 | − 0.02 | 0.927 |
| Posterior midbody MD | 0.19 | 0.270 | 0.02 | 0.890 |
| Isthmus FA | − 0.10 | 0.585 | − 0.05 | 0.774 |
| Isthmus MD | 0.11 | 0.554 | 0.18 | 0.256 |
| Splenium FA | − 0.52 | 0.001⁎ | − 0.16 | 0.311 |
| Splenium MD | 0.44 | 0.009⁎ | 0.03 | 0.868 |
FASD = Fetal Alcohol Spectrum Disorder; FA = fractional anisotropy; MD = mean diffusivity.
Indicates significance at p < 0.009 (Holm–Sidak multiple comparison correction).
Fig. 4.
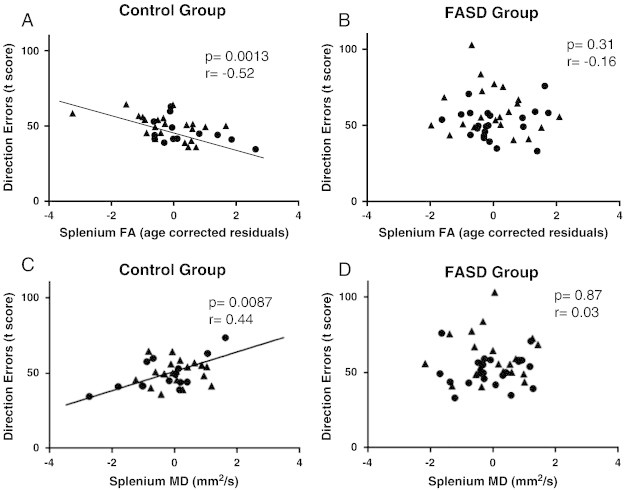
DTI–eye movement correlations.
The age-corrected splenium FA residuals were negatively correlated to direction error t-score (age corrected score) in the control group (A; n = 35) but not the FASD group (B; n = 43). Additionally, the age corrected MD residuals were positively correlated to direction error t-score in the control (C; n = 35) but not the FASD (D; n = 43) group. Males are shown as circles and females are shown as triangles for both groups.
4. Discussion
4.1. General findings
The current study found group differences between children with FASD and typically developing children in both eye movement control and DTI measures. The children with FASD performed significantly worse on eye movement behavioral measures indicating poor response inhibition, reaction time, and spatial working memory. Group differences were also found in the splenium of the corpus callosum with the FASD group displaying significantly higher MD. This result was primarily driven by a difference in parallel diffusivity, which has been associated with neurotoxicity. For example, administration of the neurotoxin methylmercury to the rat results in an increased parallel but not perpendicular diffusivity, and this was found to be due to reductions in microtubules and neurofilaments in the axoplasm (Kinoshita et al., 1999). Alcohol may also have similar neurotoxic effects as a higher parallel diffusivity has been reported in the anterior thalamic radiation of males with high alcohol use (Hill et al., 2013). There were significant correlations between direction errors in the antisaccade task and FA (negative correlation) or MD (positive correlation) of the splenium of the control group, but not the FASD group. These findings point to alterations in connectivity between the two hemispheres of the brain that may contribute to inhibition deficits in children with FASD.
4.2. Eye movement control
The current study found that children with FASD had significant difficulties with eye movement control. Behavioral deficits on the antisaccade task included increased number of anticipatory saccades, direction errors and slower SRT. While we have previously reported increased direction errors and slower SRT (Green et al., 2007, 2009; Paolozza et al., 2013, 2014a), in the current study we also found a significant increase in anticipatory saccades in children with FASD. An increase in anticipatory saccades suggests a problem with top-down control by the prefrontal cortex on cortical and subcortical regions (Clementz et al., 2010), as the children in the FASD group had difficulty waiting for the proper go signal to make a saccade.
Similar to the antisaccade task, the children with FASD displayed increased behavioral errors, specifically more sequence and timing errors, on the memory-guided task. An increase in the frequency of timing errors has consistently been observed in children with FASD compared with controls (Paolozza et al., 2013, 2014a). In contrast, we did not observe a difference in sequence errors in a smaller sample (n = 27) of children with FASD (Paolozza et al., 2013), however with a larger sample size that enabled standardization for age the more subtle difference in sequence errors has become evident (data of the current study and see also Paolozza et al., 2014b). It is important to fully characterize eye movement performance in children with neurodevelopmental disorders, as this may help to establish whether there are (i) unique profiles of deficits that occur in specific disorders and (ii) correlations with certain types of structural or functional brain injury.
4.3. Diffusion parameters
The corpus callosum is the largest white matter tract in the brain, connecting the homologous regions of the two hemispheres. In this study we segmented the corpus callosum into six distinct regions. The only region that was significantly different between the FASD and control groups was the splenium, the most posterior portion, which connects bilateral aspects of the occipital lobes. Structural MRI studies have suggested that the splenium is the most severely affected callosal area in those with FASD compared to controls (Bookstein et al., 2007; Sowell et al., 2001; Yang et al., 2012). Several DTI studies have found group differences of lower FA in the splenium (Lebel et al., 2008; Li et al., 2009; Sowell et al., 2008; Wozniak et al., 2009) and higher MD in the splenium of young adults with FASD (Ma et al., 2005); this latter finding is similar to the current study in a group of children and adolescents. These DTI findings suggest that prenatal alcohol exposure may be associated with microstructural differences, e.g. axonal degradation, in the splenium of the corpus callosum.
4.4. DTI–eye tracking correlation analysis
DTI has been used to demonstrate links between corpus callosum microstructural white matter integrity and cognitive functioning in healthy development (i.e. co-ordination and bimanual tasks) (Johansen-Berg et al., 2007; Muetzel et al., 2008), as well as neurodevelopmental disorders (Alexander et al., 2007; Cheng et al., 2013; Fryer et al., 2009; Sundaram et al., 2008). Using tractography, we demonstrate a negative correlation in the control group between FA of the splenium and direction errors in the antisaccade task, as well as a positive correlation between MD of the splenium and direction errors in the antisaccade task. Poorer response inhibition has been correlated with decreased splenium size in adults with bipolar disorder who also display inhibitory control problems (Bearden et al., 2011). Response inhibition during a dichotic listening task has also been correlated to the area of the posterior corpus callosum in patients with Multiple Sclerosis (Gadea et al., 2009). Finally, in children exposed to polychlorinated biphenyls, the splenium volume has been correlated with psychometric response inhibition, where smaller size was related to greater number of inhibitory errors (Stewart et al., 2003). The relationship seen in this study supports the notion that alterations in white matter integrity of the splenium could lead to response inhibition deficits commonly seen in children with FASD. The splenium has been linked to the integration of visual information with the proper motor response in the dorsal/parietal visual pathway (Cabeza and Nyberg, 2000; DeYoe et al., 1994), and therefore, direction errors may also be due to an early breakdown of visual information coming into the brain that is not being transmitted to the correct areas of the frontal lobes via indirect connections with the splenium which is required for proper inhibitory control.
We did not find any relationship between DTI measures and timing errors on the memory-guided task possibly due to the complex nature of the task itself. The antisaccade task measures response inhibition directly and only requires the participant to follow one instruction (look to the opposite side of the screen). In contrast, the memory-guided task requires the participant to simultaneously remember several instructions and participants must use previously presented sensory information to plan and initiate a motor response at the appropriate time. This task, therefore, requires the integration of multiple domains of cognitive function, including spatial working memory and response suppression, and would presumably therefore depend on multiple pathways in the brain.
4.5. Limitations
There are certain limitations of this study that must be acknowledged. First, the tensor model and deterministic tractography can be prone to error in areas of crossing fibers and may therefore lead to artificially low FA in such locations, and subsequently does not identify the lateral projections of the corpus callosum. Second, this paper only presents data from the corpus callosum and does not include any other tracts in the brain. Therefore, we can point to the splenium as playing a role in inhibition but are unable to determine the potential contribution of other white matter tracts. Third, this tractography analysis used manually placed ROIs which can have increased variability due to human error. However, all were placed by the same investigator who was blind to the individual participant's demographics and performance. Finally, there was an imbalance in the ethnicity of the control and FASD groups, and while this does not appear to affect the data it will be important in the future to better match these groups.
5. Conclusions
In the present study we demonstrate group differences between children with FASD and control participants across many measures of eye movement control. Eye movement tasks hold promise as a future screening tool given that they are efficient, portable and easy to administer. Group differences in MD of the splenium of the corpus callosum indicate that prenatal alcohol exposure may be associated with white matter abnormalities in this area. Response inhibition measures on the antisaccade task in healthy control children correlated negatively with FA and positively with MD of the splenium, which is consistent with the view that interhemispheric connectivity is required to properly integrate information in order to successfully and efficiently inhibit an automatic response and to generate a voluntary response (Madsen et al., 2010). This relationship was not present in children with FASD, who also exhibited evidence of decreased microstructural integrity of the splenium. Future studies should include functional MRI experiments to determine the pattern of brain activation in children with FASD compared with controls during the performance of saccadic eye movement tasks.
Acknowledgments
We thank the participants and their families for taking part in the study. This work was supported by NeuroDevNet (NCE/20000), which is funded by the Networks of Centres of Excellence of Canada, a program of the federal government to advance science and technology. We also acknowledge the NeuroDevNet NeuroInformatics Core for data management system implementation and support and Donald Brien for his technical expertise in the collection and analysis of the eye movement data. Alberta Innovates Health Solutions is acknowledged for a salary award (CB) and PhD scholarship (ST).
References
- Alexander A.L., Lee J.E., Lazar M., Boudos R., DuBray M.B., Oakes T.R. Diffusion tensor imaging of the corpus callosum in Autism. Neuroimage. 2007;34(1):61–73. doi: 10.1016/j.neuroimage.2006.08.032. (S1053-8119(06)00890-1 [pii], Retrieved from PM:17023185) [DOI] [PubMed] [Google Scholar]
- Amador N., Schlag-Rey M., Schlag J. Primate antisaccade. II. Supplementary eye field neuronal activity predicts correct performance. J. Neurophysiol. 2004;91(4):1672–1689. doi: 10.1152/jn.00138.2003. (00138.2003 [pii]. Retrieved from PM:14645374) [DOI] [PubMed] [Google Scholar]
- Aron A.R., Poldrack R.A. The cognitive neuroscience of response inhibition: relevance for genetic research in attention-deficit/hyperactivity disorder. Biol. Psychiatry. 2005;57(11):1285–1292. doi: 10.1016/j.biopsych.2004.10.026. (S0006-3223(04)01106-0 [pii], Retrieved from PM:15950000) [DOI] [PubMed] [Google Scholar]
- Autti-Ramo I., Autti T., Korkman M., Kettunen S., Salonen O., Valanne L. MRI findings in children with school problems who had been exposed prenatally to alcohol. Dev. Med. Child Neurol. 2002;44(2):98–106. doi: 10.1017/s0012162201001748. (Retrieved from PM:11848116) [DOI] [PubMed] [Google Scholar]
- Bearden C.E., van Erp T.G., Dutton R.A., Boyle C., Madsen S., Luders E. Mapping corpus callosum morphology in twin pairs discordant for bipolar disorder. Cereb. Cortex. 2011;21(10):2415–2424. doi: 10.1093/cercor/bhr030. (bhr030 [pii], Retrieved from PM:21383237) [DOI] [PMC free article] [PubMed] [Google Scholar]
- Beaulieu C. The basis of anisotropic water diffusion in the nervous system — a technical review. NMR Biomed. 2002;15(7–8):435–455. doi: 10.1002/nbm.782. (Retrieved from PM:12489094) [DOI] [PubMed] [Google Scholar]
- Bookstein F.L., Connor P.D., Huggins J.E., Barr H.M., Pimentel K.D., Streissguth A.P. Many infants prenatally exposed to high levels of alcohol show one particular anomaly of the corpus callosum. Alcohol Clin. Exp. Res. 2007;31(5):868–879. doi: 10.1111/j.1530-0277.2007.00367.x. (ACER367 [pii], Retrieved from PM:17386071) [DOI] [PubMed] [Google Scholar]
- Bruni J., Montemurro D. Oxford University Press; New York: 2009. Human Neuroanatomy: A Text, Brain Atlas, and Laboratory Dissection Guide. [Google Scholar]
- Cabeza R., Nyberg L. Imaging cognition II: an empirical review of 275 PET and fMRI studies. J. Cogn. Neurosci. 2000;12(1):1–47. doi: 10.1162/08989290051137585. (Retrieved from PM:10769304) [DOI] [PubMed] [Google Scholar]
- Cheng B., Braass H., Ganos C., Treszl A., Biermann-Ruben K., Hummel F.C. Altered intrahemispheric structural connectivity in Gilles de la Tourette syndrome. Neuroimage Clin. 2013;4:174–181. doi: 10.1016/j.nicl.2013.11.011. (S2213-1582(13)00159-9 [pii]. Retrieved from PM:24371800) [DOI] [PMC free article] [PubMed] [Google Scholar]
- Chudley A.E., Conry J., Cook J.L., Loock C., Rosales T., LeBlanc N. Fetal alcohol spectrum disorder: Canadian guidelines for diagnosis. CMAJ. 2005;172(5 Suppl.):S1–S21. doi: 10.1503/cmaj.1040302. (172/5_suppl/S1 [pii], Retrieved from PM:15738468) [DOI] [PMC free article] [PubMed] [Google Scholar]
- Clarren S.K., Smith D.W. The fetal alcohol syndrome. N. Engl. J. Med. 1978;298(19):1063–1067. doi: 10.1056/NEJM197805112981906. (Retrieved from PM:347295) [DOI] [PubMed] [Google Scholar]
- Clementz B.A., Gao Y., McDowell J.E., Moratti S., Keedy S.K., Sweeney J.A. Top-down control of visual sensory processing during an ocular motor response inhibition task. Psychophysiology. 2010;47(6):1011–1018. doi: 10.1111/j.1469-8986.2010.01026.x. (PSYP1026 [pii], Retrieved from PM:20477977) [DOI] [PMC free article] [PubMed] [Google Scholar]
- Das S., Zijdenbos A.P., Harlap J., Vins D., Evans A.C. LORIS: a web-based data management system for multi-center studies. Front. Neuroinform. 2011;5:37. doi: 10.3389/fninf.2011.00037. (Retrieved from PM:22319489) [DOI] [PMC free article] [PubMed] [Google Scholar]
- DeSouza J.F., Menon R.S., Everling S. Preparatory set associated with pro-saccades and anti-saccades in humans investigated with event-related FMRI. J. Neurophysiol. 2003;89(2):1016–1023. doi: 10.1152/jn.00562.2002. (Retrieved from PM:12574477) [DOI] [PubMed] [Google Scholar]
- DeYoe E.A., Felleman D.J., Van Essen D.C., McClendon E. Multiple processing streams in occipitotemporal visual cortex. Nature. 1994;371(6493):151–154. doi: 10.1038/371151a0. (Retrieved from PM:8072543) [DOI] [PubMed] [Google Scholar]
- Everling S., Munoz D.P. Neuronal correlates for preparatory set associated with pro-saccades and anti-saccades in the primate frontal eye field. J. Neurosci. 2000;20(1):387–400. doi: 10.1523/JNEUROSCI.20-01-00387.2000. (Retrieved from PM:10627615) [DOI] [PMC free article] [PubMed] [Google Scholar]
- Everling S., Dorris M.C., Munoz D.P. Reflex suppression in the anti-saccade task is dependent on prestimulus neural processes. J. Neurophysiol. 1998;80(3):1584–1589. doi: 10.1152/jn.1998.80.3.1584. (Retrieved from PM:9744965) [DOI] [PubMed] [Google Scholar]
- Everling S., Dorris M.C., Klein R.M., Munoz D.P. Role of primate superior colliculus in preparation and execution of anti-saccades and pro-saccades. J. Neurosci. 1999;19(7):2740–2754. doi: 10.1523/JNEUROSCI.19-07-02740.1999. (Retrieved from PM:10087086) [DOI] [PMC free article] [PubMed] [Google Scholar]
- Fryer S.L., Schweinsburg B.C., Bjorkquist O.A., Frank L.R., Mattson S.N., Spadoni A.D. Characterization of white matter microstructure in fetal alcohol spectrum disorders. Alcohol Clin. Exp. Res. 2009;33(3):514–521. doi: 10.1111/j.1530-0277.2008.00864.x. (ACER864 [pii], Retrieved from PM:19120066) [DOI] [PMC free article] [PubMed] [Google Scholar]
- Funahashi S., Chafee M.V., Goldman-Rakic P.S. Prefrontal neuronal activity in rhesus monkeys performing a delayed anti-saccade task. Nature. 1993;365(6448):753–756. doi: 10.1038/365753a0. (Retrieved from PM:8413653) [DOI] [PubMed] [Google Scholar]
- Gadea M., Marti-Bonmati L., Arana E., Espert R., Salvador A., Casanova B. Corpus callosum function in verbal dichotic listening: inferences from a longitudinal follow-up of Relapsing–Remitting Multiple Sclerosis patients. Brain Lang. 2009;110(2):101–105. doi: 10.1016/j.bandl.2009.03.006. (S0093-934X(09)00051-0 [pii], Retrieved from PM:19419759) [DOI] [PubMed] [Google Scholar]
- Gottlieb J., Goldberg M.E. Activity of neurons in the lateral intraparietal area of the monkey during an antisaccade task. Nat. Neurosci. 1999;2(10):906–912. doi: 10.1038/13209. (Retrieved from PM:10491612) [DOI] [PubMed] [Google Scholar]
- Green C.R., Munoz D.P., Nikkel S.M., Reynolds J.N. Deficits in eye movement control in children with fetal alcohol spectrum disorders. Alcohol. Clin. Exp. Res. 2007;31(3):500–511. doi: 10.1111/j.1530-0277.2006.00335.x. (ACER335 [pii], Retrieved from PM:17295736) [DOI] [PubMed] [Google Scholar]
- Green C.R., Mihic A.M., Brien D.C., Armstrong I.T., Nikkel S.M., Stade B.C. Oculomotor control in children with fetal alcohol spectrum disorders assessed using a mobile eye-tracking laboratory. Eur. J. Neurosci. 2009;29(6):1302–1309. doi: 10.1111/j.1460-9568.2009.06668.x. (EJN6668 [pii], Retrieved from PM:19302166) [DOI] [PubMed] [Google Scholar]
- Green C.R., Lebel C., Rasmussen C., Beaulieu C., Reynolds J.N. Diffusion tensor imaging correlates of saccadic reaction time in children with fetal alcohol spectrum disorder. Alcohol Clin. Exp. Res. 2013 doi: 10.1111/acer.12132. (Retrieved from PM:23551175) [DOI] [PubMed] [Google Scholar]
- Harris P.A., Taylor R., Thielke R., Payne J., Gonzalez N., Conde J.G. Research electronic data capture (REDCap)—a metadata-driven methodology and workflow process for providing translational research informatics support. J. Biomed. Inform. 2009;42(2):377–381. doi: 10.1016/j.jbi.2008.08.010. (S1532-0464(08)00122-6 [pii], Retrieved from PM:18929686) [DOI] [PMC free article] [PubMed] [Google Scholar]
- Hill S.Y., Terwilliger R., McDermott M. White matter microstructure, alcohol exposure, and familial risk for alcohol dependence. Psychiatry Res. 2013;212(1):43–53. doi: 10.1016/j.pscychresns.2012.11.003. (S0925-4927(12)00295-8 [pii], Retrieved from PM:23473988) [DOI] [PMC free article] [PubMed] [Google Scholar]
- Hollingshead A.A. 1975. Four-factor Index of Social Status. [Google Scholar]
- Hwang K., Velanova K., Luna B. Strengthening of top-down frontal cognitive control networks underlying the development of inhibitory control: a functional magnetic resonance imaging effective connectivity study. J. Neurosci. 2010;30(46):15535–15545. doi: 10.1523/JNEUROSCI.2825-10.2010. (30/46/15535 [pii], Retrieved from PM:21084608) [DOI] [PMC free article] [PubMed] [Google Scholar]
- Iversen S.D., Mishkin M. Perseverative interference in monkeys following selective lesions of the inferior prefrontal convexity. Exp. Brain Res. 1970;11(4):376–386. doi: 10.1007/BF00237911. (Retrieved from PM:4993199) [DOI] [PubMed] [Google Scholar]
- Johansen-Berg H., Della-Maggiore V., Behrens T.E., Smith S.M., Paus T. Integrity of white matter in the corpus callosum correlates with bimanual co-ordination skills. Neuroimage. 2007;36(Suppl. 2):T16–T21. doi: 10.1016/j.neuroimage.2007.03.041. (S1053-8119(07)00238-8 [pii], Retrieved from PM:17499163) [DOI] [PMC free article] [PubMed] [Google Scholar]
- Kinoshita Y., Ohnishi A., Kohshi K., Yokota A. Apparent diffusion coefficient on rat brain and nerves intoxicated with methylmercury. Environ. Res. 1999;80(4):348–354. doi: 10.1006/enrs.1998.3935. (S0013-9351(98)93935-4 [pii], Retrieved from PM:10330308) [DOI] [PubMed] [Google Scholar]
- Lebel C., Rasmussen C., Wyper K., Walker L., Andrew G., Yager J. Brain diffusion abnormalities in children with fetal alcohol spectrum disorder. Alcohol. Clin. Exp. Res. 2008;32(10):1732–1740. doi: 10.1111/j.1530-0277.2008.00750.x. (ACER750 [pii], Retrieved from PM:18671811) [DOI] [PubMed] [Google Scholar]
- Lebel C., Rasmussen C., Wyper K., Andrew G., Beaulieu C. Brain microstructure is related to math ability in children with fetal alcohol spectrum disorder. Alcohol. Clin. Exp. Res. 2010;34(2):354–363. doi: 10.1111/j.1530-0277.2009.01097.x. (ACER1097 [pii], Retrieved from PM:19930234) [DOI] [PubMed] [Google Scholar]
- Leemans A., Jeurissen B., Sijbers J., Jones D. 17th annual meeting of international society of magnetic resonance medicine, Hawaii, USA. 2009. ExploreDTI: a graphical toolbox for processing, analyzing, and visualizing diffusion MR data; p. 3537. [Google Scholar]
- Li L., Coles C.D., Lynch M.E., Hu X. Voxelwise and skeleton-based region of interest analysis of fetal alcohol syndrome and fetal alcohol spectrum disorders in young adults. Hum. Brain Mapp. 2009;30(10):3265–3274. doi: 10.1002/hbm.20747. (Retrieved from PM:19278010) [DOI] [PMC free article] [PubMed] [Google Scholar]
- Liddle P.F., Kiehl K.A., Smith A.M. Event-related fMRI study of response inhibition. Hum. Brain Mapp. 2001;12(2):100–109. doi: 10.1002/1097-0193(200102)12:2<100::AID-HBM1007>3.0.CO;2-6. (2-6 [pii]. Retrieved from PM:11169874) [DOI] [PMC free article] [PubMed] [Google Scholar]
- Ma X., Coles C.D., Lynch M.E., Laconte S.M., Zurkiya O., Wang D. Evaluation of corpus callosum anisotropy in young adults with fetal alcohol syndrome according to diffusion tensor imaging. Alcohol Clin. Exp. Res. 2005;29(7):1214–1222. doi: 10.1097/01.alc.0000171934.22755.6d. (doi:00000374-200507000-00011 [pii]. Retrieved from PM:16046877) [DOI] [PubMed] [Google Scholar]
- Madsen K.S., Baare W.F., Vestergaard M., Skimminge A., Ejersbo L.R., Ramsoy T.Z. Response inhibition is associated with white matter microstructure in children. Neuropsychologia. 2010;48(4):854–862. doi: 10.1016/j.neuropsychologia.2009.11.001. (S0028-3932(09)00431-X [pii], Retrieved from PM:19909763) [DOI] [PubMed] [Google Scholar]
- Muetzel R.L., Collins P.F., Mueller B.A., Schissel M., Lim K.O., Luciana M. The development of corpus callosum microstructure and associations with bimanual task performance in healthy adolescents. Neuroimage. 2008;39(4):1918–1925. doi: 10.1016/j.neuroimage.2007.10.018. (Retrieved from PM:18060810) [DOI] [PMC free article] [PubMed] [Google Scholar]
- Paolozza A., Titman R., Brien D., Munoz D.P., Reynolds J.N. Altered accuracy of saccadic eye movements in children with fetal alcohol spectrum disorder. Alcohol. Clin. Exp. Res. 2013;37(9):1491–1498. doi: 10.1111/acer.12119. (Retrieved from PM:23578065) [DOI] [PubMed] [Google Scholar]
- Paolozza A., Rasmussen C., Pei J., Hanlon-Dearman A., Nikkel S.M., Andrew G. Deficits in response inhibition correlate with oculomotor control in children with fetal alcohol spectrum disorder and prenatal alcohol exposure. Behav. Brain Res. 2014;259:97–105. doi: 10.1016/j.bbr.2013.10.040. (S0166-4328(13)00655-4 [pii], Retrieved from PM:24185031) [DOI] [PubMed] [Google Scholar]
- Paolozza A., Rasmussen C., Pei J., Hanlon-Dearman A., Nikkel S.M., Andrew G. Working memory and visuospatial deficits correlate with oculomotor control in children with fetal alcohol spectrum disorder. Behav. Brain Res. 2014;263:70–79. doi: 10.1016/j.bbr.2014.01.024. (S0166-4328(14)00038-2 [pii], Retrieved from PM:24486257) [DOI] [PubMed] [Google Scholar]
- Putnam M.C., Steven M.S., Doron K.W., Riggall A.C., Gazzaniga M.S. Cortical projection topography of the human splenium: hemispheric asymmetry and individual differences. J. Cogn. Neurosci. 2010;22(8):1662–1669. doi: 10.1162/jocn.2009.21290. (Retrieved from PM:19583478) [DOI] [PubMed] [Google Scholar]
- Ramat S., Leigh R.J., Zee D.S., Optican L.M. What clinical disorders tell us about the neural control of saccadic eye movements. Brain. 2007;130(Pt 1):10–35. doi: 10.1093/brain/awl309. (awl309 [pii], Retrieved from PM:17121745) [DOI] [PubMed] [Google Scholar]
- Reynolds J.N., Weinberg J., Clarren S., Beaulieu C., Rasmussen C., Kobor M. Fetal alcohol spectrum disorders: gene–environment interactions, predictive biomarkers, and the relationship between structural alterations in the brain and functional outcomes. Semin. Pediatr. Neurol. 2011;18(1):49–55. doi: 10.1016/j.spen.2011.02.006. (S1071-9091(11)00007-6 [pii], Retrieved from PM:21575841) [DOI] [PMC free article] [PubMed] [Google Scholar]
- Riley E.P., Mattson S.N., Sowell E.R., Jernigan T.L., Sobel D.F., Jones K.L. Abnormalities of the corpus callosum in children prenatally exposed to alcohol. Alcohol. Clin. Exp. Res. 1995;19(5):1198–1202. doi: 10.1111/j.1530-0277.1995.tb01600.x. (Retrieved from PM:8561290) [DOI] [PubMed] [Google Scholar]
- Schlag-Rey M., Amador N., Sanchez H., Schlag J. Antisaccade performance predicted by neuronal activity in the supplementary eye field. Nature. 1997;390(6658):398–401. doi: 10.1038/37114. (Retrieved from PM:9389478) [DOI] [PubMed] [Google Scholar]
- Snook L., Plewes C., Beaulieu C. Voxel based versus region of interest analysis in diffusion tensor imaging of neurodevelopment. Neuroimage. 2007;34(1):243–252. doi: 10.1016/j.neuroimage.2006.07.021. (S1053-8119(06)00787-7 [pii], Retrieved from PM:17070704) [DOI] [PubMed] [Google Scholar]
- Sowell E.R., Mattson S.N., Thompson P.M., Jernigan T.L., Riley E.P., Toga A.W. Mapping callosal morphology and cognitive correlates: effects of heavy prenatal alcohol exposure. Neurology. 2001;57(2):235–244. doi: 10.1212/wnl.57.2.235. (Retrieved from PM:11468307) [DOI] [PubMed] [Google Scholar]
- Sowell E.R., Johnson A., Kan E., Lu L.H., Van Horn J.D., Toga A.W. Mapping white matter integrity and neurobehavioral correlates in children with fetal alcohol spectrum disorders. J. Neurosci. 2008;28(6):1313–1319. doi: 10.1523/JNEUROSCI.5067-07.2008. (28/6/1313 [pii], Retrieved from PM:18256251) [DOI] [PMC free article] [PubMed] [Google Scholar]
- Stewart P., Fitzgerald S., Reihman J., Gump B., Lonky E., Darvill T. Prenatal PCB exposure, the corpus callosum, and response inhibition. Environ. Health Perspect. 2003;111(13):1670–1677. doi: 10.1289/ehp.6173. (Retrieved from PM:14527849) [DOI] [PMC free article] [PubMed] [Google Scholar]
- Sundaram S.K., Kumar A., Makki M.I., Behen M.E., Chugani H.T., Chugani D.C. Diffusion tensor imaging of frontal lobe in autism spectrum disorder. Cereb. Cortex. 2008;18(11):2659–2665. doi: 10.1093/cercor/bhn031. (bhn031 [pii], Retrieved from PM:18359780) [DOI] [PMC free article] [PubMed] [Google Scholar]
- Swayze V.W., Johnson V.P., Hanson J.W., Piven J., Sato Y., Giedd J.N. Magnetic resonance imaging of brain anomalies in fetal alcohol syndrome. Pediatrics. 1997;99(2):232–240. doi: 10.1542/peds.99.2.232. (Retrieved from PM:9024452) [DOI] [PubMed] [Google Scholar]
- Witelson S.F. Hand and sex differences in the isthmus and genu of the human corpus callosum. A postmortem morphological study. Brain. 1989;112:799–835. doi: 10.1093/brain/112.3.799. [DOI] [PubMed] [Google Scholar]
- Wozniak J.R., Mueller B.A., Chang P.N., Muetzel R.L., Caros L., Lim K.O. Diffusion tensor imaging in children with fetal alcohol spectrum disorders. Alcohol. Clin. Exp. Res. 2006;30(10):1799–1806. doi: 10.1111/j.1530-0277.2006.00213.x. (ACER213 [pii], Retrieved from PM:17010147) [DOI] [PMC free article] [PubMed] [Google Scholar]
- Wozniak J.R., Muetzel R.L., Mueller B.A., McGee C.L., Freerks M.A., Ward E.E. Microstructural corpus callosum anomalies in children with prenatal alcohol exposure: an extension of previous diffusion tensor imaging findings. Alcohol Clin. Exp. Res. 2009;33(10):1825–1835. doi: 10.1111/j.1530-0277.2009.01021.x. (ACER1021 [pii], Retrieved from PM:19645729) [DOI] [PMC free article] [PubMed] [Google Scholar]
- Yang Y., Phillips O.R., Kan E., Sulik K.K., Mattson S.N., Riley E.P. Callosal thickness reductions relate to facial dysmorphology in fetal alcohol spectrum disorders. Alcohol Clin. Exp. Res. 2012;36(5):798–806. doi: 10.1111/j.1530-0277.2011.01679.x. (Retrieved from PM:22150665) [DOI] [PMC free article] [PubMed] [Google Scholar]
- Zhang M., Barash S. Neuronal switching of sensorimotor transformations for antisaccades. Nature. 2000;408(6815):971–975. doi: 10.1038/35050097. (Retrieved from PM:11140683) [DOI] [PubMed] [Google Scholar]