

Abstract
Background
Hypertension doubles coronary heart disease (CHD) risk. Treating hypertension only reduces CHD risk ~25%. Treating hypercholesterolemia in hypertensive patients reduces residual CHD risk >35%.
Methods and Results
To assess progress in concurrent hypertension and hypercholesterolemia control, National Health and Nutrition Examination Surveys 1988–1994, 1999–2004, and 2005–2010 were analyzed. Hypertension was defined by blood pressure (BP) ≥140/≥90 mmHg, current medication treatment, and twice-told hypertension status; BP <140/<90 defined control. Hypercholesterolemia was defined by ATP III criteria based on 10-yr CHD risk, low-density lipoprotein cholesterol (LDL-C) and non-high(H)DL-C; values below diagnostic thresholds defined control. Across surveys, 60.7%–64.3% of hypertensives were hypercholesterolemic. From 1988–1994 to 2005–2010, control of LDL-C rose (9.2% [6.6%–11.9%] to 45.4% [42.6%–48.3%]), concomitant hypertension and LDL-C (5.0% [3.3%–6.7%] to 30.7% [27.9%–33.4%]) and combined hypertension, LDL-C, and non-HDL-C (1.8% [0.4%–3.2%] to 26.9% [24.4%–29.5%]). By multivariable logistic regression, factors associated with concomitant hypertension, LDL-C and non-HDL-C control (odds ratio [95% CI]) were statin (10.7 [8.1–14.3]) and antihypertensive (3.32 [2.45–4.50]) medications, age (0.77 [0.69–0.88/10-yr increase), ≥2 healthcare visits/yr (1.96 [1.23–3.11]) black race (0.59 [0.44–0.80]), Hispanic ethnicity (0.62 [0.43–0.90]), cardiovascular disease ([CVD] 0.44 [0.34–0.56]), and diabetes mellitus (0.54 [0.42–0.70]).
Conclusions
Despite progress, opportunities for improving concomitant hypertension and hypercholesterolemia control persist. Prescribing antihypertensive and anti-hyperlipidemic medications to achieve treatment goals, especially for older, minority, diabetic and CVD patients, and accessing healthcare at least biannually could improve concurrent risk factor control and CHD prevention.
Keywords: hypertension, hypercholesterolemia, cardiovascular disease, coronary heart disease, prevention
Introduction
Hypertension affects roughly 30% of U.S. adults1 and approximately doubles coronary heart disease (CHD) risk.2 Anti-hypertensive therapy reduces CHD about 25%.3 Epidemiological data suggest that treating hypertension to lower goals would reduce residual CHD risk, but clinical trials have not substantiated the prediction.4–7
Despite theoretical advantages, treating hypertension with medication classes other than diuretics and beta-blockers has not consistently reduced CHD. ALLHAT did not show differences in CHD outcomes between hypertensive patients treated initially with chlorthalidone, a diuretic, lisinopril, an angiotensin converting enzyme inhibitor, or amlodipine, a calcium antagonist.3,8 Doxazosin, an α1-antagonist, was stopped early for worse outcomes, including 10% more CHD than chlorthalidone.9 CHD outcomes were not significantly different among hypertensive patients randomized to losartan- vs atenolol-based regimens (LIFE),10 amlodipine- vs. atenolol-based regimens (ASCOT)11, or amlodipine- vs. valsartan-based regimens (VALUE).12 In ACCOMPLISH,13 hypertensive patients randomized to combination therapy with benazepril-amlodipine had less CHD than patients on benazepril-hydrochlorothiazide.
Treating hypercholesterolemia, which affects the majority of hypertensive patients, reduces CHD. In AFCAPS/TexCAPS,14 lovastatin 20–40 mg/d lowered low-density lipoprotein cholesterol (LDL–C) compared with placebo (156 vs. 115 mg/dL) and reduced CHD 38% in hypertensive patients. In ASCOT,15 lowering LDL–C from 133 at baseline to 87 mg/dL in hypertensive patients randomized to 10 mg atorvastatin daily reduced CHD 36% compared with placebo-treated patients.
Healthy People 2020 aims to reduce CHD deaths 20%, while Million Hearts seeks to prevent 1,000,000 heart attacks and strokes in the U.S. by 2017.16,17 Controlling both hypertension and hypercholesterolemia are important in CHD prevention.14,15,18,19 Time trends in concomitant control of hypertension and hypercholesterolemia and clinical variables associated with dual control could guide healthcare policy and delivery to reduce CHD risk and achieve national prevention goals. The current National Health and Nutrition Examination Surveys (NHANES) analysis addresses this opportunity.
Methods
NHANES assess a representative sample of the U.S. civilian population.1 Our study included adults ≥18 years old in NHANES III (1988–1994), 1999–2004, or 2005–2010.
Informed Consent for Human Studies
The study was approved by the institutional review committee of the National Center for Health Statistics. All adults provided written consent to participate.
Race/Ethnicity was determined by self-report and separated into non-Hispanic white (white), non-Hispanic black (black), Hispanic ethnicity of any race and other.
Blood pressure (BP) was measured as described.1 Mean systolic and diastolic BP for individuals was determined as recommended in NHANES reporting guidelines excluding the first value in subjects with more than one value.1,20
Hypertension was defined as (i) mean systolic BP ≥140 and/or diastolic BP ≥90 mmHg (ii) a positive response to the question, “Are you currently taking medication to lower your BP?” (iii) by untreated individuals with BP <140/<90 reporting they were told twice they had hypertension.21 Hypertension control for treated and untreated patients was defined as BP <140/<90, although BP goals for patients with diabetes and/or chronic kidney disease (CKD) were lower for 1999–2010.22,23 Evidence does not clearly support a more stringent systolic BP goal than <140 for patients with diabetes and/or CKD.5–7,24,25 This study focuses mainly on goal BP <140/<90 for all hypertensive individuals. Goal BP <130/<80 in patients with diabetes and/or CKD is also reported.
Hypercholesterolemia was defined by low-density lipoprotein cholesterol (LDL–C) and non-high-density lipoprotein cholesterol (non-HDL–C) values relative to 10-yr Framingham CHD risk:26 LDL–C ≥100 mg/dL or non-HDL–C (total cholesterol–HDL) ≥130 mg/dL in patients with diabetes or clinical cardiovascular disease (CHD risk equivalent) and others with Framingham 10-yr CHD risk >20%; LDL–C ≥130 or non-HDL–C ≥160 in subjects with 10-yr CHD risk 10–20% and subjects with 10-yr CHD risk <10% and at least two major CHD risk factors; LDL–C ≥160 or non-HDL–C ≥190 in subjects with 10-yr CHD risk <10% and at most one major risk factor. Hypercholesterolemia was also defined by affirmative answer to the question “Are you now taking medication to lower your cholesterol?” and positive match between medication(s) reported or brought to the examination and known lipid lowering medication(s). Major CHD risk factors were defined as described26 with one exception. Family history of premature CHD was defined as CHD in first-degree relative before age 50 given limited documentation on family history of CHD in NHANES.26,27 Cholesterol control was defined by values below diagnostic threshold.
Diabetes mellitus was defined by a positive response to the questions, “Have you ever been told by a doctor that you have diabetes?”, and/or “Are you now taking insulin?”, and/or “Are you now taking diabetic pills to lower your blood sugar?” Patients with only fasting plasma glucose ≥126 mg/dL or glycosylated hemoglobin ≥6.5%, i.e. “undiagnosed diabetes”, were not defined diabetic.28
Chronic kidney disease (CKD) was defined as estimated glomerular filtration rate (eGFR) <60 mL/1.7m2/min and/or urine albumin:creatinine ≥300 mg/g. Serum creatinine values were adjusted to facilitate eGFR comparisons across surveys.29
Medical visits were defined from responses to the question “How many times did you receive health care over the last year?” Responses were classified into 3 categories: 0 to 1, 2 to 3, and ≥4 visits/year.29
Uninsured status was defined by a negative answer to the question “Are you covered by health insurance or some other kind of health care plan?”29
Cigarette smoker was defined if a patient answered “Every day” or “some days” to the household question “Do you now smoke cigarettes”.29
Coronary heart disease (CHD) was defined by positive response to the question, “Has a doctor ever told you that you had a heart attack,” and/or “Has a doctor ever told you that you had coronary heart disease?” and/or angina by the Rose questionnaire.29 Stroke was defined by positive response to the question, “Has a doctor ever told you that you had a stroke?”30
Congestive heart failure was determined by affirmative response to the question, “Has a doctor ever told you that you had congestive heart failure?”31
Data analysis
Factors influencing analytic approach
For reasons noted, this report focuses mainly on goal BP <140/<90 mmHg. Cholesterol control was based principally on NCEP/ATP III goals.26 ATP III and ATP II (1993) goals for LDL-C in high risk patients were both <100 mg/dL.26,32 LDL–C goals from the first NCEP report (1988) where 30 mg/dL higher than subsequent reports.33 Recent evidence indicates non-HDL-C is a better predictor than LDL–C of CHD outcomes in statin-treated, although both are significant.34 Thus, non-HDL–C control to ATP III goals is also reported, as most patients treated for hypercholesterolemia reported taking statins. Given documented efficacy of treating LDL-C below ATP III for reducing CHD,35,36 control rates are reported for optional LDL–C and non-HDL–C goals 30 mg/dL below ATP III.37 SAS version 9.3 (Cary, NC) was used for all analyses to account for NHANES complex sampling design. Sampling weights were used to adjust for oversampling of Hispanic and non-Hispanic black subjects and when combining two or more 2-year cycles of the continuous NHANES. Statistical procedures PROC SURVEYMEANS, and PROC SURVEYLOGISTIC (link function logit) provide estimates for population mean, proportion, odds ratio and confidence intervals.
The Rao-Scott Chi-Square Test in the PROC SURVEYFREQ was used to test for differences in categorical variables; the Wald F test in the PROC SURVEYREG was used to test for differences in continuous variables within each survey. For categorical variables with more than two subcategories, e.g., race/ethnicity and BMI, differences in the distribution of subcategories between groups in Tables 1 and 2 were assessed within each survey. However, differences between specific subcategories by race/ethnicity or BMI between groups were not assessed. The Taylor series (linearization) method was used to estimate sampling errors of estimators based on complex sample designs. For subpopulations of interest, such as hypertensive adults with hypercholesterolemia, domain analysis was used. Formation of subpopulations was unrelated to sample design, so domain sample sizes were random variables. Domain analysis accounts for this variability by using the entire sample in calculating variance of domain estimates. Pairwise comparisons between the three NHANES periods were conducted with t-tests of weighted means. Given the number of statistical comparisons, p-values ≤0.01 were accepted as statistically significant. For the multivariable logistic regression analyses of factors associated with control of cholesterol alone and with BP, 95% confidence intervals that did not cross the line of identity (1.0) were defined as statistically significant.
Table 1.
Descriptive characteristics of hypertensive patients with and without LDL-C in three NHANES time periods.
| NHANES Period | 1988 – 1994 | 1999 – 2004 | 2005 – 2010 | |||
|---|---|---|---|---|---|---|
| NHANES N, % (N) U.S. Pop | 5734, 27.2% (49,810,593) | 5172, 31.4%, (62,225,441) | 6156, 32.8%, (69,309,914) | |||
| Descriptor, Mean (95% CI) | HTN w/LDL | HTN no LDL | HTN w/LDL | HTN no LDL | HTN w/LDL | HTN no LDL |
| Number, % | 38.6 (36.3–40.9) | 61.4 (59.1–63.7) | 42.4 (39.9–44.9) | 57.6 (55.1–60.1) | 43.6 (42.0–45.2) | 56.4 (54.8–58.0) |
| Age, years | 57.0 (55.5–58.5) | 56.5 (55.4–57.6) | 56.9 (56.1–57.7) | 57.6 (56.7–58.6) | 58.1 (56.9–59.2) | 57.6 (56.5–58.6) |
| Gender, % | ||||||
| male | 48.0 (45.3–50.7) | 47.2 (44.3–50.0) | 47.9 (45.6–50.2) | 46.8 (44.7–48.9) | 48.1 (46.1–50.1) | 48.5 (46.5–50.4) |
| Race | ||||||
| White | 77.1 (74.3–80.0) | 77.8 (74.5–81.0) | 75.5 (71.5–79.6) | 72.3 (68.3–76.3) | 72.9 (68.4–77.4) | 72.8 (68.8–76.9) |
| Black | 13.5 (11.4–15.5) | 13.8 (11.9–15.7) | 11.8 (9.1–14.5) | 13.8 (10.5–17.0) | 13.2 (10.4–15.9) | 14.7 (11.8–17.6) |
| Hispanic | 3.6 ‡, § (2.9–4.3) | 3.5 § (2.9–4.1) | 8.5 (5.1–11.9) | 9.7 (6.7–12.6) | 8.7 ‡ (6.3–11.1) | 7.9 § (5.8–10.1) |
| BMI, kg/m2 | ||||||
| <25, % | 28.1 (24.5–31.7) | 27.0 ‡ (24.5–29.6) | 23.0 (21.0–25.0) | 21.1 (19.2–23.0) | 21.0 ‡ (19.0–23.1) | 19.7 § (17.9–21.5) |
| ≥30, % | 37.1 (33.5–40.7) | 37.4 ‡ (33.8–40.9) | 42.2 (40.0–44.5) | 43.4 (40.7–46.1) | 48.5 § (45.9–51.0) | 46.6 § (44.6–48.7) |
| Visits/ yr, % | ||||||
| (0–1) | 31.0 § (27.8–34.1) | 29.1 § (26.7–31.5) | 20.9 (18.5–23.2) | 22.3 (20.3–24.3) | 20.3 § (17.6–23.1) | 20.7 § (19.0–22.5) |
| (2–3) | 26.9 (24.7–29.1) | 26.2 (24.1–28.4) | 29.5 (27.2–31.8) | 25.5 (23.4–27.6) | 27.6 (25.2–29.9) | 26.5 (24.6–28.3) |
| (≥4) | 42.1 ‡ (38.8–45.5) | 44.6 § (42.3–46.9) | 49.7 (46.3–53.0) | 52.2 (49.6–54.7) | 52.1 § (48.9–55.3) | 52.8 § (50.8–54.8) |
| Uninsured, % | 8.0 (5.6–10.5) | 9.3 (6.9–11.6) | 9.0 * (7.5–10.5) | 11.4 (9.6–13.3) | 12.6 ‡ (10.6–14.5) | 12.4 (10.8–14.0) |
| Blood Pressure | ||||||
| SBP, mm Hg | 136.7 † 135.1–138.3 |
140.6 139.2–141.9 |
137.8 § 136.8–138.9 |
140.4 § 139.5–141.4 |
132.4 †, § 131.7–133.2 |
135.2 § 134.2–136.2 |
| DBP, mmHg | 78.2 *, ‡ (77.2–79.2) | 80.1 § (79.4–80.8) | 75.9 § (75.1–76.8) | 76.5 ‡ (75.6–77.5) | 71.8 †, § (70.9–72.7) | 74.3 § (73.5–75.2) |
| BP meds, % | 48.6 ‡ (44.9–52.2) | 46.2 § (43.3–49.1) | 57.9 § (54.7–61.0) | 57.0 ‡ (54.0–60.0) | 69.2 *, § (66.8–71.6) | 64.3 § (61.4–67.2) |
| BP<140/<90,% | 43.5 * (39.4–47.6) | 36.1 (33.5–38.7) | 44.7 § (41.8–47.7) | 40.3 § (37.8–42.8) | 58.3 *, § (56.1–60.5) | 51.6 § (48.8–54.5) |
| 1 nHT, % | 17.8 § (15.0–20.5) | 15.8 § (13.2–18.4) | 10.8 (9.1–12.5) | 8.9 (7.0–10.8) | 10.4 § (8.6–12.2) | 9.0 § (7.3–10.6) |
| Lipids | ||||||
| Total Cholesterol, mg/dL | 217.5 *, § 215.1–219.9 |
223.2 § 220.8–225.7 |
205.4 †, § 203.1–207.8 |
212.8 § 210.6–215.0 |
195.8 †, § 193.9–197.7 |
203.8 § 201.5–206.1 |
| HDL-C, mg/dl | 49.8 § 48.5–51.0 |
49.5 § 48.5–50.5 |
52.8 * (51.8–53.8) |
51.3 (50.5–52.1) |
53.4 †, § (52.7–54.2) |
50.9 (50.0–51.9) |
| Triglycerides, mg/dL | 152.7 147.1–158.4 |
149.5 ‡ 145.3–153.6 |
139.8 § 136.7–142.9 |
|||
| LDL-C, mg/dL | 137.2 § 135.1–139.3 |
122.8 § 120.5–125.0 |
114.4 § 112.8–115.9 |
|||
| Non-HDL-C, mg/dL | 167.7 *, § 165.4–170.1 |
173.2 § 170.3–176.1 |
152.6 †, § 150.2–155.1 |
161.4 § 159.1–163.8 |
142.3 § 140.7–143.9 |
152.9 § 150.8–154.9 |
| Lipid Med, % | 4.6 § 3.2–6.0 |
5.5 § 4.5–6.6 |
22.0 § (20.0–24.0) | 21.6 § (19.3–23.8) | 34.4 § (31.9–37.0) | 32.6 § (30.6–34.5) |
| Statin, % | 2.7 § 1.7–3.7 |
3.2 § 2.3–4.2 |
20.1 § (18.2–21.9) | 19.3 § (17.1–21.5) | 32.1 § (29.5–34.7) | 29.9 § (28.1–31.7) |
| Other Risk Factors | ||||||
| Diabetes Mellitus, % | 8.2 † 6.8–9.7 |
13.3 ‡ 11.7–14.8 |
10.2 †, § (8.8–11.6) | 17.0 (15.2–18.8) | 18.5 § (16.9–20.2) | 18.0 § (16.4–19.7) |
| Current Smoker, % | 21.5 ‡ 18.6–24.5 |
21.6 19.0–24.2 |
16.2 (13.9–18.6) | 19.7 (18.1–21.4) | 18.7 (16.4–21.1) | 19.1 (17.0–21.2) |
| CKD, % | 9.9 * 8.2–11.7 |
13.2 11.6–14.9 |
12.6 * (11.0–14.2) | 15.8 (14.2–17.4) | 15.3 § (13.5–17.2) | 14.4 (13.0–15.9) |
| CVD, % | 16.6 14.2–19.1 |
16.9 ‡ 15.2–18.7 |
17.7 (15.3–20.0) | 21.1 (18.9–23.4) | 21.0 (18.5–23.5) | 19.6 (18.0–21.1) |
| 10yr FCR>20%, % | 29.9 26.7–33.1 |
32.8 ‡ 30.6–35.0 |
27.9 †, § (25.9–29.9) | 37.1 (34.6–39.6) | 36.5 ‡ (33.7–39.4) | 35.4 (33.4–37.4) |
| 10yr FCR 10–20%, % | 23.0 20.1–25.8 |
22.5 20.1–24.9 |
21.0 ‡ (19.1–22.9) | 19.2 (17.9–20.6) | 17.7 ‡ (16.0–19.4) | 19.5 (17.3–21.6) |
| 10yr FCR<10%, % | 47.1 43.9–50.4 |
44.7 41.6–47.8 |
51.1 ‡ (48.9–53.4) | 43.7 (41.0–46.3) | 45.8 (43.0–48.5) | 45.1 (42.5–47.8 |
| 2<10→10–20%, % | 23.5* 21.3–25.8 |
18.2 15.7–20.8 |
24.3 † 22.4–26.2 |
17.9 § 15.8–20.1 |
21.1* 19.0–23.1 |
24.1 ‡ 21.9–25.3 |
N=number, CI=confidence intervals,
p<0.01;
p<0.0001 between LDL and no LDL groups within NHANES periods.
p<0.01;
p<0.0001 within LDL/no LDL groups between periods. Symbols in 1988–1994 column compare with 1999–2004, 1999–2004 with 2005–2010, 2005–2010 with 1988–1994.
% of hypertensive patients twice told they were hypertensive but with non-hypertensive untreated BP on exam;
% of patients reclassified from <10% to 10–20% 10-yr CHD risk based on presence of 2 or more major CHD risk factors.26
Table 2.
Characteristics of hypertensive patients with LDL-C subdivided by presence or absence of hypercholesterolemia defined by LDL-C.
| NHANES Period | 1988 – 1994 | 1999 – 2004 | 2005 – 2010 | |||
|---|---|---|---|---|---|---|
| Group | HTN+HL | HTN–HL | HTN+HL | HTN–HL | HTN+HL | HTN–HL |
| NHANES subject number | n=1410 | n=800 | n=1366 | n=803 | n=1813 | n=888 |
| (Number U.S. Population) | N=12,160,76 | N=7,079,85 | N=16,003,04 | N=10,365,48 | N=19,445,23 | N=10,782,13 |
| Characteristic, Mean (95% CI) | 5 | 7 | 0 | 0 | 4 | 4 |
| Number, % | 63.2 (59.9–66.5) | 36.8 (33.5–40.1) | 60.7 (58.3–63.1) | 39.3 (36.9–41.7) | 64.3 (62.1–66.5) | 35.7 (33.5–37.9) |
| Age, years | 60.6 * (59.1–62.1) | 50.8 (48.6–52.9) | 60.1 † (59.1–61.1) | 52.0 (50.7–53.2) | 61.6 † (60.6–62.5) | 51.8 (50.2–53.4) |
| Gender, % male | 51.1 (47.3–55.0) | 42.7 (37.5–47.8) | 50.6 * (48.1–53.2) | 43.7 (39.5–47.9) | 49.1 (46.6–51.7) | 46.3 (42.3–50.2) |
| Race | ||||||
| White | 79.7 * (76.3–83.1) | 72.7 (68.9–76.5) | 77.4 * (73.3–81.6) | 72.6 (67.5–77.7) | 74.7 * (70.2–79.3) | 69.6 (64.5–74.7) |
| Black | 10.9 (8.8–13.1) | 17.8 (14.6–21.0) | 9.9 (7.7–12.2) | 14.7 (10.6–18.8) | 11.5 (8.7–14.4) | 16.1 (12.6–19.5) |
| Hispanic | 3.0 ‡ (2.4–3.7) | 4.5 (3.3–5.7) | 7.9 (4.2–11.5) | 9.5 (5.8–13.1) | 8.2 ‡ (5.5–10.9) | 9.6 ‡ (7.1–12.2) |
| BMI, kg/m2 | ||||||
| <25, % | 22.5 † (18.9–26.0) | 37.8 ‡ (32.0–43.6) | 20.4 * (18.3–22.6) | 26.9 (22.9–30.9) | 17.0 †, ‡ (15.0–19.0) | 28.4 (23.6–33.1) |
| ≥30, % | 38.4 (34.3–42.5) | 34.9 (28.9–40.9) | 41.2 § (37.9–44.5) | 43.8 (39.7–47.9) | 50.4 § (47.5–53.3) | 44.9 (40.2–49.7) |
| Visits/yr, % | ||||||
| (0–1) | 27.6 § (23.8–31.4) | 36.7 ‡ (31.0–42.5) | 17.6 * (15.1–20.2) | 25.9 (21.2–30.6) | 15.2 †, § (12.5–17.9) | 29.5 (26.1–32.9) |
| (2–3) | 27.7 (24.1–31.2) | 25.6 (20.6–30.5) | 29.0 (26.0–32.0) | 30.2 (26.5–33.9) | 27.7 (24.8–30.6) | 27.4 (23.5–31.3) |
| (≥4) | 44.7 ‡ (41.0–48.4) | 37.7 (32.0–43.5) | 53.4 (49.8–57.0) | 43.9 (38.3–49.5) | 57.1 § (53.0–61.2) | 43.1 (39.1–47.1) |
| Uninsured, % | 6.5 (3.5–9.4) | 10.8 (6.8–14.7) | 8.1 (6.2–9.9) | 10.5 ‡ (8.3–12.7) | 10.4 † (8.3–12.5) | 16.5 (13.6–19.3) |
| Blood Pressure | ||||||
| SBP, mm Hg | 138.6 * (137.1–140.2) | 133.5 (130.8–136.2) | 138.6 § (137.3–139.9) | 136.7 § (135.1–138.2) | 132.9 § (131.8–134.0) | 131.7 (130.3–133.0) |
| DBP, mmHg | 78.3 ‡ (77.0–79.5) | 78.1 (76.9–79.3) | 75.2 § (74.2–76.3) | 77.0 ‡ (75.7–78.3) | 70.6 †, § (69.6–71.6) | 73.9 § (72.5–75.3) |
| BP meds, % | 55.0 †, ‡ (50.6–59.3) | 37.6 (32.4–42.8) | 65.7 †, § (61.5–70.0) | 45.7 ‡ (41.7–49.7) | 78.1 †, § (75.8–80.4) | 53.2 § (49.2–57.2) |
| BP <140/<90, % | 40.4 (35.2–45.6) | 48.8 (42.8–54.8) | 45.5 § (41.4–49.5) | 43.6 § (39.2–48.0) | 58.3 § (55.1–61.4) | 58.4 ‡ (54.8–62.0) |
| 1 nHT | 12.2 † (8.8–15.6) | 27.3 § (22.5–32.2) | 8.6 * (6.6–10.6) | 14.2 (11.2–17.2) | 6.5 †, ‡ (4.5–8.6) | 17.4 § (14.3–20.5) |
| Lipids | ||||||
| Total Cholesterol mg/dL | 235.1 †, § (232.9–237.2) | 187.3 (183.7–191.0) | 217.0 †, § (214.3–219.7) | 187.6 (184.9–190.3) | 202.0 †, § (199.8–204.1) | 184.5 (181.5–187.6) |
| HDL-C, mg/dl | 47.2 †, ‡ (45.7–48.6) | 54.2 (52.2–56.2) | 50.3 † (49.5–51.2) | 56.6 (55.0–58.2) | 51.8 †, § (51.0–52.7) | 56.3 (54.9–57.8) |
| Triglycerides, mg/dL | 169.0 † (162.0–176.1) | 124.8 (117.7–131.8) | 164.4 †, § (158.8–170.1) | 126.3 (121.0–131.7) | 150.2 †, § (145.7–154.7) | 121.0 (116.4–125.6) |
| LDL-C, mg/dL | 154.1 †, § (151.6–156.5) | 108.2 (105.4–110.9) | 133.8 †, § (131.2–136.4) | 105.7 (103.3–108.2) | 120.1 †, § (118.2–122.0) | 104.0 (101.6–106.5) |
| Non-HDL-C, mg/dL | 187.9 †, § (185.7–190.1) | 133.1 (130.1–136.2) | 166.7 †, § (163.9–169.4) | 131.0 (128.3–133.7) | 150.2 †, § (148.2–152.1) | 128.2 (125.7–130.8) |
| Lipid Med, % | 7.4 § (5.2–9.5) | 36.3 § (33.3–39.3) | 53.5 § (50.6–56.4) | |||
| Statin, % | 4.3 § (2.7–5.9) | 33.1 § (30.2–35.9) | 49.9 § (46.8–53.1) | |||
| Other Risk Factors | ||||||
| Diabetes Mellitus, % | 11.5 † (9.2–13.7) | 2.6 (1.3–3.9) | 14.5 †, § (12.3–16.7) | 3.5 (2.0–4.9) | 26.0 †, § (23.6–28.3) | 5.2 ‡ (3.8–6.5) |
| Current Smoker, % | 23.0 (18.9–27.2) | 18.9 (15.3–22.6) | 17.6 (14.4–20.7) | 14.2 (10.5–17.8) | 18.4 (15.8–21.0) | 19.3 (15.5–23.1) |
| CKD, % | 12.0 † (9.5–14.5) | 6.4 (4.6–8.1) | 14.7 * (12.7–16.7) | 9.4 (6.9–11.8) | 17.6 †, ‡ (15.4–19.8) | 11.2 (8.8–13.6) |
| CVD, % | 23.5 † (20.2–26.8) | 4.8 (3.2–6.5) | 26.2 † (23.0–29.4) | 4.4 (2.9–5.9) | 29.5 †, ‡ (26.3–32.6) | 5.8 (4.2–7.4) |
| 10-yr FCR >20% | 42.5 † (38.5–46.6) | 8.2 (5.8–10.5) | 40.5 †, § (37.7–43.4) | 8.4 (6.8–9.9) | 51.1 †, ‡ (47.6–54.5) | 10.3 (8.4–12.2) |
| 10-yr FCR 10–20% | 26.2 (22.6–29.9) | 17.4 (14.1–20.7) | 23.6 (20.8–26.5) | 16.8 (14.0–19.6) | 19.1 ‡ (16.6–21.6) | 15.2 (11.7–18.6) |
| 10-yr FCR <10% | 31.2 (28.2–34.2) | 74.5 (70.0–78.9) | 35.8 ‡ (32.8–38.8) | 74.8 (71.4–78.2) | 29.8 (26.8–32.9) | 74.5 (70.6–78.4) |
| 2<10→10–20%, % | 23.5 20.3–26.8 |
23.5 19.3–27.7 |
24.3 ‡ 21.2–27.4 |
24.2 20.0–28.4 |
18.8 * 16.3–21.3 |
25.2 21.9–28.5 |
Results
The process for deriving the 17,062 hypertensive adults from NHANES is depicted in Figure 1. The 7,080 patients with and the 9,982 without LDL-C values were separated. Prevalent hypertension increased form 27.2% in 1988–1994 to 32.8% in 2005–2010. The estimated number of hypertensive individuals in the U.S. rose from 49.8 million to 69.3 million (Table 1). Descriptive characteristics of hypertensive patients with and without LDL–C in NHANES 1988–1994, 1999–2004, and 2005–2010 are provided. The two groups did not differ by demographic characteristics, body mass index, annual healthcare visits, or insurance status. Patients without LDL–C had higher BP and were less likely to have hypertension controlled to <140/<90. Total and non-HDL–C were also higher in those without LDL–C, although percentages of patients that reported taking lipid lowering medications including statins were not different. Other risk factors including current smoker status, CVD, and calculated 10-yr risk for CHD, excluding patients reclassified from <10% to 10–20% based on two or more major CHD risk factors, were generally similar in the two groups. Diabetes mellitus was more common in those without LDL in 1988–1994 and 1999–2004 but not different in 2005–2010. Roughly five-eighths of hypertensive patients with an LDL–C value were hypercholesterolemic by ATP III.26 Hypertensive patients with hypercholesterolemia were older (Table 2), different by race-ethnicity, and less likely to be lean, uninsured and to have 0–1 healthcare visits/yr. They were more likely to have ≥4 healthcare visits/yr and report taking BP medications. Hypercholesterolemic patients had higher total cholesterol, triglycerides, LDL–C, and non-HDL–C and lower HDL–C. They were more likely to have diabetes, CKD, CVD and 10-yr CHD risk >20% and less likely to have 10-yr CHD risk <10%. Supplemental Table 1 provides data for patients with and without hypercholesterolemia defined by optional LDL–C and non-HDL–C goals 30 mg/dL below ATP III targets;37 75–78% of hypertensive patients were hypercholesterolemic by optional targets.
Figure 1.

The flow diagram depicts the process for deriving the subject sample for the present analysis of the NHANES database for 1988–1994 and 1999–2010 subdivided into 1999–2004 and 2005–2010.
Using data in Tables 1 and 2, Figure 2, and Supplemental Table 2, in hypertensive patients with LDL-C, 53.5% were treated and 45.4% were controlled to their ATP-3 goal in 2005–2010. Thus, 46.5% were uncontrolled including 8.1% who were treated, i.e., the majority (0.465–0.081/0.465=0.826 or 82.6%) of uncontrolled hypercholesterolemia patients in 2005–2010 were untreated. In 2005–2010, ~54% of all hypertensive patients were controlled to <140/<90 and 46% were uncontrolled. Approximately ~9.5% of all hypertensive patients were twice told hypertensives with non-hypertensive BP on NHANES examination and untreated, i.e., in absolute percentages 44.5% of controlled hypertensive patients were treated and 9.5% untreated. With all hypertensive patients as the denominator, 66% were treated and 44.5% were treated and controlled and 21.5% were treated and uncontrolled. Since 24.5% of all uncontrolled hypertensive pateints were untreated and 21.5% were treated, the majority of uncontrolled hypertensive patients are untreated (0.245/0.46=0.53 or 53%, which is similar to our previous report.29
Figure 2.
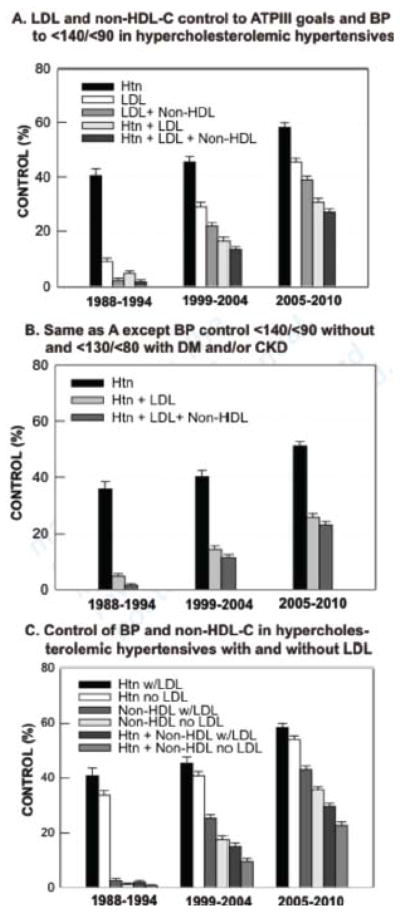
Hypertension and hypercholesterolemia control (mean, standard error) (A) ATPIII cholesterol goals, BP <140/<90, (B) Same as A except BP <130/<80 for diabetes/CKD, (C) Control BP <140/<90 and non-HDL-C (ATPIII goals) in patients with and without LDL-C. All comparisons between time periods are significant at p<0.01 except hypertension control between 1988–1994 and 1999–2004 in 2A, 2B, and 2C (Htn with LDL [mean values for risk factor control and p-values are provided in Supplemental Table 2]).
Hypertension, LDL–C and non-HDL–C control increased over time (Figure 2A, 2B; means and p-values Supplemental Table 2). Concomitant control of hypertension to <140/<90 and LDL-C to ATP III targets rose roughly six-fold 1988–1994 to 2005–2010; concomitant control of hypertension, LDL–C, and non-HDL–C increased from 1.8% [0.4%–3.2%] in 1988–1994 to 26.9% [24.4%–29.5%] in 2005–2010 (Figure 2A). Concomitant hypertension and hypercholesterolemia control was lower when more stringent BP goals were applied to patients with diabetes and/or chronic kidney disease (Figure 2B).
Approximately 90% of patients without LDL–C had non-HDL–C values. Control of BP to <140/<90 and non-HDL–C to ATP III targets are depicted in Figure 2C (data, p-values Supplemental Table 2) for hypertensive patients with elevated non-HDL–C; among hypertensive patients with and without LDL–C, the percentages with elevated non-HDL–C in 1998–1994, 1999–2004, and 2005–2010 were 58.7%, 55.9% and 61.5% vs 57.1%, 59.2%, 67.4%, respectively. Control rates increased with time in both groups and were higher in subjects with than without LDL–C except for non-HDL–C in 1988–1994.
Multiple logistic regression odds ratios for clinical factors independently associated with LDL–C control alone and with non-HDL–C and hypertension for each NHANES time period separately and all periods combined are provided in Figure 3. The multivariable odds ratios and 95% confidence limits for all time periods combined are provided in Table 3 and for the separate time periods in Supplemental Table 3. With all time periods together, the strongest positive predictor of LDL–C control was statin therapy followed by non-statin cholesterol therapy. The strongest negative predictors of LDL–C control were clinical cardiovascular disease and diabetes. Male sex and older age were negatively associated with LDL–C. The four negative predictors are associated with higher 10-yr CHD risk and lower LDL–C treatment goals, which are more challenging to achieve. Higher HDL–C was negatively associated with LDL–C control. Of note, when controlling for Framingham 10-yr CHD risk, women were significantly less likely than men to obtain control of cholesterol alone and together with BP. Framingham CHD risk was excluded from the final model, since it includes several variables in the model, i.e., not independent. Figure 4 depicts 10-yr CHD risk distribution in men and women and control of non-HDL–C to ATP III goals for each CHD risk group; non-HDL–C was selected as ~95% of patients, while >50% had a missing LDL–C values. Framingham risk scores were significantly skewed toward greater risk in men than women in all three NHANES periods (4A). At 10-yr CHD risk >20% women are less likely than men to control non-HDL–C to goal, whereas at 10-yr CHD risk <10%, women are more likely to reach goal (4B). A similar pattern emerged for combined BP and non-HDL-C control (4C).
Figure 3.

Multivariable odds ratios and 95% CI are depicted for clinical variables independently associated with control of LDL-C alone and with BP and non-HDL-C for three NHANES periods separately and combined. 95% CIs not crossing the line of identity (1.0) are significant.
Table 3.
Multivariable odds ratios and 95% confidence limits for clinical variables associated with control of BP and LDL-C and non-HDL cholesterol (NCEP III Goals) in NHANES 1988–2010 combined (Figure 3).
| Descriptor | Control of LDL | Control of LDL and Non-HDL | Control of Htn and LDL | Control of Htn, LDL and Non-HDL | ||||||||
|---|---|---|---|---|---|---|---|---|---|---|---|---|
| Odds | LCL | UCL | Odds | LCL | UCL | Odds | LCL | UCL | Odds | LCL | UCL | |
| Age/10 years | 0.78 | 0.71 | 0.87 | 0.75 | 0.67 | 0.83 | 0.75 | 0.67 | 0.83 | 0.77 | 0.69 | 0.88 |
| Gender | ||||||||||||
| Male | 0.71 | 0.58 | 0.86 | 0.72 | 0.59 | 0.89 | 0.86 | 0.68 | 1.09 | 0.83 | 0.65 | 1.07 |
| Race | ||||||||||||
| Black | 0.69 | 0.52 | 0.91 | 0.57 | 0.43 | 0.75 | 0.48 | 0.36 | 0.64 | 0.59 | 0.44 | 0.80 |
| Hispanic | 0.75 | 0.56 | 1.00 | 0.78 | 0.58 | 1.06 | 0.60 | 0.43 | 0.84 | 0.62 | 0.43 | 0.90 |
| Other | 0.94 | 0.52 | 1.70 | 1.48 | 0.78 | 2.83 | 1.24 | 0.68 | 2.26 | 1.69 | 0.88 | 3.25 |
| BMI | ||||||||||||
| <25 | 1.07 | 0.76 | 1.51 | 1.11 | 0.76 | 1.63 | 1.25 | 0.86 | 1.80 | 1.08 | 0.72 | 1.64 |
| ≥ 30 | 1.23 | 0.90 | 1.68 | 1.35 | 0.97 | 1.88 | 1.40 | 0.94 | 2.06 | 1.17 | 0.78 | 1.78 |
| Visits /year | ||||||||||||
| (2–3 vs 0–1) | 1.09 | 0.82 | 1.46 | 1.21 | 0.85 | 1.71 | 1.89 | 1.25 | 2.87 | 1.96 | 1.23 | 3.11 |
| (≥ 4 vs 0–1) | 1.17 | 0.87 | 1.58 | 1.22 | 0.89 | 1.67 | 1.90 | 1.30 | 2.77 | 1.86 | 1.23 | 2.80 |
| Uninsured | 1.23 | 0.82 | 1.83 | 1.50 | 1.00 | 2.26 | 1.20 | 0.77 | 1.88 | 1.35 | 0.81 | 2.25 |
| Blood Pressure | ||||||||||||
| SBP /10mm Hg | 0.89 | 0.82 | 0.96 | 0.88 | 0.79 | 0.97 | x | x | x | x | x | x |
| DBP /10mm Hg | 0.93 | 0.87 | 1.00 | 0.90 | 0.84 | 0.98 | x | x | x | x | x | x |
| BP <140/<90 | 0.96 | 0.74 | 1.24 | 0.81 | 0.57 | 1.14 | x | x | x | x | x | x |
| BP meds | 1.02 | 0.78 | 1.33 | 1.01 | 0.74 | 1.37 | 3.01 | 2.38 | 3.82 | 3.32 | 2.45 | 4.50 |
| Lipids | ||||||||||||
| HDL /(10mg/dl) | 0.88 | 0.81 | 0.94 | x | x | x | x | x | x | x | x | x |
| Triglycerid es (100mg/dl) | 1.11 | 0.90 | 1.22 | 0.50 | 0.40 | 0.55 | x | x | x | x | x | x |
| Non-statin | 3.07 | 1.83 | 5.14 | 3.85 | 2.55 | 5.79 | 2.37 | 1.33 | 4.24 | 2.67 | 1.52 | 4.68 |
| Statin | 18.0 | 13.9 | 23.2 | 21.0 | 16.3 | 27.0 | 7.94 | 6.25 | 10.1 | 10.7 | 8.05 | 14.3 |
| Risk Factors | ||||||||||||
| Smoke | 0.83 | 0.64 | 1.08 | 0.88 | 0.63 | 1.22 | 1.19 | 0.89 | 1.58 | 1.14 | 0.80 | 1.63 |
| CKD | 1.23 | 0.92 | 1.64 | 1.28 | 0.97 | 1.68 | 0.99 | 0.73 | 1.35 | 0.94 | 0.68 | 1.29 |
| CVD | 0.26 | 0.20 | 0.34 | 0.26 | 0.19 | 0.35 | 0.45 | 0.35 | 0.57 | 0.44 | 0.34 | 0.56 |
| DM | 0.49 | 0.39 | 0.61 | 0.44 | 0.35 | 0.56 | 0.65 | 0.50 | 0.83 | 0.54 | 0.42 | 0.70 |
Figure 4.
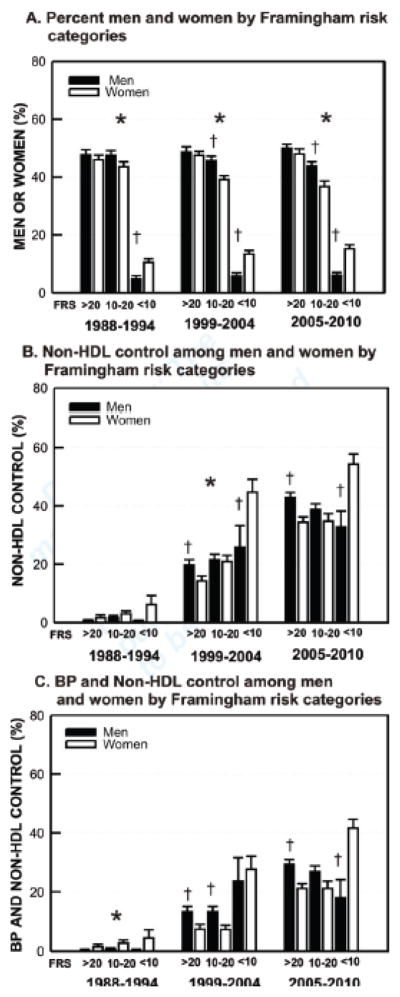
Hypertension and hypercholesterolemia control in men and women by Framingham 10-yr CHD risk score categories (FRS) (mean, standard error) (A) FRS categories by sex in NHANES 1999–2004 and 2005–2010 (B) Non-HDL-C control (ATP III goals) in men and women by FRS (C) BP <140/<90 and non-HDL-C control in men and women by FRS categories. *p<0.01 for distribution across FRS categories in men vs women; †p<0.01 men vs. women within FRS category.
When cholesterol (LDL–C alone and with non-HDL–C) and BP (goal <140/<90 for all patients) were considered together, the positive predictors of concomitant control were patient reported use of statin, non-statin cholesterol and antihypertensive medications. Patients reporting 2–3 and ≥4 healthcare visits annually were more likely to achieve concurrent lipid and BP control than individuals seen less frequently. Factors most negatively associated with concurrent control included cardiovascular disease and diabetes. Increasing age, black race, and Hispanic ethnicity were also associated with a reduced likelihood of concurrent cholesterol and hypertension control.
Supplemental Figures 1 (data Supplemental Table 4) and 2 (data Supplemental Table 5) are identical to Figures 2 and 3 except LDL–C and non-HDL–C control reflect optional targets.37 Among all adults and all men and all women without CHD risk equivalent conditions and those with CHD risk equivalent conditions, 10-yr CHD risk shifted significantly away from the highest risk (>20%) and toward the lowest risk (<10%) categories for the entire group, and those with hypertension and hypercholesterolemia (Supplemental Table 6). In all patients with CHD risk equivalent patients and those with hypertension and hypercholesterolemia, the percentage with BP <140/<90 and non-HDL-C <130 rose significantly over time.
Discussion
The principal finding of this report is that concomitant hypertension and hypercholesterolemia control improved over time but remain low with fewer than one in three patients attaining control of both risk factors (Figure 2, Supplemental Table 2). Hypertension impacts about one in three U.S. adults (Table 1) or nearly 70 million people in 2005–2010, when untreated, twice-told hypertensive patients with non-hypertensive BP are designated hypertensive.21,38 While fewer than half of hypertensive patients in NHANES had an LDL–C value, ~60–65% of them were hypercholesterolemic when defined by ATP III (Table 2).26 Hypertensive patients with and without LDL–C differed on several key variables, i.e., extrapolation to all hypertensive patients is limited. However, nearly 95% of hypertensive patients had non-HDL–C, and 64.7% of them, or roughly 42.5 million individuals, were also hypercholesterolemic by ATP III criteria in 2005–2010, which is similar to 64.3% hypercholesterolemic by LDL–C (Table 2). Hypertension approximately doubles risk for CHD, yet treating hypertension reduces CHD risk only 20–25%.3 Treating hypercholesterolemia in hypertensive patients reduces residual CHD risk 35–40%.14,15 The data suggest that effective treatment of both hypertension and hypercholesterolemia would reduce CHD 50% or more and decrease residual risk observed when only hypertension is addressed.
Opportunities for clinically significant progress remain. Fewer than half of hypertensive hypercholesterolemic patients in 2005–2010 had LDL–C controlled to ATP III targets, and only ~30% had dual BP <140/<90 and LDL–C to target.26 The majority of patients with uncontrolled hypertension29 and hypercholesterolemia are untreated (Results). Our analyses suggest patients need to be seen at least biannually to improve likelihood of dual cholesterol and hypertension control (Figure 3). This finding coincides with evidence that hypertensive patients seen within the last six months were more likely to obtain BP control than patients not seen in the previous six months.39
While treating BP to lower targets in hypertensive patients has not significantly reduced clinical CHD to date,5–7 treating hypercholesterolemia to lower targets reduces CHD.35–37,40 Of note, when optional goals for LDL–C, i.e., 30 mg/dL below ATP III targets are considered, prevalent hypercholesterolemia rises to 76.6% and dual hypertension and LDL–C control falls to 16.2% in 2005–2010 (Supplemental Table 1, Supplemental Figure 1A). This information is relevant to prevention goals as Healthy People 2020 aims to reduce CHD 20%, and Million Hearts seeks to prevent 1,000,000 heart attacks and strokes by 2017.16,17 Attaining these important national objectives would be facilitated by improving concomitant control of hypertension to <140/<90 and hypercholesterolemia to lower optional targets.35–37,40
Cardiovascular mortality declined 38% in the U.S. between 1995 and 2009.41 Better hypertension and hypercholesterolemia control, documented in this report and elsewhere, probably contributed to that decline.3,14–19,21,27 In fact, Framingham 10-year CHD risk scores shifted toward lower risk among all adults combined and men and women separately and for those with both hypertension and hypercholesterolemia. In CHD risk equivalent patients with diabetes mellitus or cardiovascular disease for whom Framingham risk cannot change, BP and cholesterol control improved over time (Supplemental Table 6).
LDL–C control among hypertensive hypercholesterolemic patients in our report is marginally higher than for all hypercholesterolemic patients in NHANES of 4% in 1988–1994 and 25% in 1999–2004.27 Total and non-HDL–C declined over time in hypercholesterolemic patients with and without LDL–C, consistent with secular trends.42 Cholesterol did not decline temporally in non-hypercholesterolemic hypertensive patients. Our analysis does not elucidate this discrepancy.
Cause and effect cannot be determined from logistic regression analyses. Nevertheless, clinical variables independently associated with concomitant hypercholesterolemia and hypertension control may inform healthcare policy and resource allocation to improve outcomes. In addition to insuring healthcare visits at least biannually,39 appropriate prescribing of medications to lower BP and cholesterol to goal could also improve control. The latter measures are especially important for older, African American and Hispanic patients and those with diabetes or cardiovascular disease who are less likely to attain dual control than comparator groups (Figure 3). Women at high CHD risk could also benefit from greater attention to cholesterol control (Figure 4). Women and African Americans as a group have higher HDL–C than white men. LDL–C control was inversely associated with HDL–C raising the possibility clinicians are less likely to treat cholesterol to goal when HDL–C values are higher. However, HDL–C may be less protective in subjects at high CHD risk.43 Treating LDL– and non-HDL–C to goal irrespective of HDL–C appears important in CHD outcomes.34
This analysis has limitations. Treatment goals for hypercholesterolemia were less stringent in 1988–1994 and comparisons with later time periods are illustrative and not intended to reflect care quality.26,32,33 Our NHANES analyses generate higher hypertension control rates than other reports,44,45 which would raise estimates of concomitant hypertension and hypercholesterolemia control. We focused on BP goal <140/<90 for all patients, given an absence of compelling data that a lower BP target significantly reduces CHD in patients with major comorbidities.5–7 Even when lower BP goals for patients with diabetes and CKD are evaluated, our analyses show higher control rates than other reports.44,45 We excluded the initial BP in calculating mean systolic and diastolic BP as recommended in NHANES guidelines.1,21,29 The initial BP is generally higher and leads to lower BP control rates when included in the mean.46 Our report also includes as hypertensive individuals twice told they were hypertensive with a non-hypertensive BP similar to other publications.21,38,47 Including these individuals also raises BP control rates. Treating BP to lower goals and with medications other than diuretics and β-blockers has not consistently reduced CHD, but stroke and/or cardiovascular disease declined.5,8,10,11
In summary, various strategies to reduce residual CHD risk in hypertensive patients included treating BP to lower goals5–7 and using different classes of antihypertensive medications8–12 with limited impact. However, treating moderate cholesterol elevations with low-dose statins reduced CHD 35–40%.14,15 Larger reductions of LDL-C decrease CHD more,18,19,35–37, 40 which supports lower optional targets.37 More than three-fourths of hypertensive patients were hypercholesterolemic and fewer than 20% controlled in 2005–2010 based on lower optional targets. Significant opportunities remain for attaining national CHD prevention goals by improving concomitant hypertension and hypercholesterolemia control.
Supplementary Material
Clinical Perspective Summary.
Hypertension affects 70 million U.S. adults and doubles coronary heart disease (CHD) risk. Antihypertensive pharmacotherapy reduces CHD risk ~20–25%. Strategies to reduce residual CHD risk included treating blood pressure (BP) to lower goals and using different antihypertensive medication classes with limited success. Treating hypercholesterolemia in hypertensive patients reduces residual CHD risk >35%. To facilitate progress in reducing CHD risk, concurrent BP and cholesterol control and factors associated with concomitant control were assessed using National Health and Nutrition Examination Survey data. Approximately 5 in 8 hypertensive patients had high cholesterol (C). Between 1988–1994 and 2005–2010, control of LDL-C increased from 9% to 45%, concurrent LDL-C and BP control rose from 5% to 31%, and triple control of LDL-C, non-HDL-C and BP improved from 2% to 27%. Patients who received infrequent healthcare or who were older, black or Hispanic, or who had diabetes mellitus or cardiovascular disease were less likely to achieve concurrent BP and cholesterol control. Among CHD risk equivalent patients, women were less likely to attain dual control than men. Patients receiving antihypertensive medications and statins were more likely to attain dual control. Strategies to improve concomitant control of BP and cholesterol could include: (1) more frequent healthcare visits for patients seen infrequently (2) prescribing BP and statin medications to treat BP and cholesterol to goal, especially for patient groups less likely to attain concurrent risk factor control. Policies and programs addressing these opportunities could facilitate progress toward Healthy People 2020 and Millions Hearts CHD prevention goals.
Acknowledgments
Funding Sources: This report was supported in part by grants from the Centers for Disease Control (Community Transformation Grant thru the South Carolina Department of Health and Environmental Control [SC DHEC]; State of South Carolina; NIH HL105880, NS058728 and HL091841.
Footnotes
Conflict of Interest Disclosures: In addition to federal and state funding sources listed, during the previous three years Dr. Egan received research support from Daiichi-Sankyo (>$10,000), Medtronic (>$10,000), Novartis (>$10,000), Takeda (>$10,000) and served as a consultant to Astra Zeneca (<$10,000), Daiichi-Sankyo (<$10,000), Medtronic (>$10,000), Novartis (<$10,000), Takeda (<$10,000), Blue Cross Blue Shield South Carolina (>$10,000). The remaining authors do not report any conflicts.
References
- 1.Egan BM, Zhao Y, Axon RN. US trends in prevalence, awareness, treatment, and control of hypertension, 1988–2008. JAMA. 2010;303:2043–2050. doi: 10.1001/jama.2010.650. [DOI] [PubMed] [Google Scholar]
- 2.Kannel WB. Hypertension: reflections on risks and prognostication. Med Clin North Am. 2009;93:541–558. doi: 10.1016/j.mcna.2009.02.006. [DOI] [PMC free article] [PubMed] [Google Scholar]
- 3.Psaty BM, Lumly TM, Furberg CD, Schellenbaum G, Pahor M, Alderman MH, Weiss NS. Health outcomes associated with various antihypertensive therapies used as first-line agents: A network meta-analysis. JAMA. 2003;289:2534–2544. doi: 10.1001/jama.289.19.2534. [DOI] [PubMed] [Google Scholar]
- 4.Lewington S, Clarke R, Qizilbash N, Peto R, Collins R Prospective Studies Collaboration. Age-specific relevance of usual blood pressure to vascular mortality: a meta-analysis of individual data for one million adults in 61 prospective studies. Lancet. 2002;360:1903–1913. doi: 10.1016/s0140-6736(02)11911-8. [DOI] [PubMed] [Google Scholar]
- 5.The ACCORD Study Group. Effects of intensive blood-pressure control in type 2 diabetes mellitus. N Engl J Med. 2010;362:1575–1585. doi: 10.1056/NEJMoa1001286. [DOI] [PMC free article] [PubMed] [Google Scholar]
- 6.Cooper-DeHoff RM, Gong Y, Handberg EM, Bavry AA, Denardo SJ, Bakris GL, Pepine CJ. Tight blood pressure control and cardiovascular outcomes among hypertensive patients with diabetes and coronary artery disease. JAMA. 2010;304:61–68. doi: 10.1001/jama.2010.884. [DOI] [PMC free article] [PubMed] [Google Scholar]
- 7.Mancia G, Schumacher H, Redon J, Verdecchia P, Schmieder R, Jennings G, Yusoff K, Ryden L, Lisheng L, Teo K, Sleight P, Yusuf S. Blood pressure targets recommended by guidelines and incidence of cardiovascular and renal events in the Ongoing Telmisartan Alone and in Combination With Ramipril Global Endpoint Trial (ONTARGET) Circulation. 2011;124:1727–1736. doi: 10.1161/CIRCULATIONAHA.110.008870. [DOI] [PubMed] [Google Scholar]
- 8.ALLHAT Collaborative Research Group. Major outcomes in high-risk hypertensive patients randomized to angiotensin-converting enzyme inhibitor or calcium channel blocker vs. diuretic. The antihypertensive and lipid-lowering treatment to prevent heart attack trial (ALLHAT) JAMA. 2002;288:2981–2997. doi: 10.1001/jama.288.23.2981. [DOI] [PubMed] [Google Scholar]
- 9.ALLHAT Collaborative Research Group. Major cardiovascular events in hypertensive patients randomized to doxazosin vs chlorthalidone: The antihypertensive and lipid-lowering treatment to prevent heart attack trial (ALLHAT) JAMA. 2000;283:1967–1975. [PubMed] [Google Scholar]
- 10.Kjeldsen SE, Dahlöf B, Devereux RB, Julius S, Aurup P, Edelman J, Beevers G, de Faire U, Fyhrquist F, Ibsen H, Kristianson K, Lederballe-Pedersen O, Lindholm LH, Nieminen MS, Omvik P, Oparil S, Snapinn S, Wedel H for the LIFE Study Group. . Effects of losartan on cardiovascular morbidity and mortality in patients with isolated systolic hypertension and left ventricular hypertrophy: a Losartan Intervention for Endpoint Reduction (LIFE) substudy. JAMA. 2002;288:1491–1498. doi: 10.1001/jama.288.12.1491. [DOI] [PubMed] [Google Scholar]
- 11.Dahlöf B, Sever PS, Poulter NR, Wedel H, Beevers DG, Caulfield M, Collins R, Kjeldsen SE, Kristinsson A, McInnes GT, Mehlsen J, Nieminen M, O’Brien E, Ostergren J ASCOT Investigators. Prevention of cardiovascular events with an antihypertensive regimen of amlodipine adding perindopril as required versus atenolol adding bendroflumethiazide as required, in the Anglo-Scandinavian Cardiac Outcomes Trial-Blood Pressure Lowering Arm (ASCOT-BPLA): a multicentre randomised controlled trial. Lancet. 2005;366:895–906. doi: 10.1016/S0140-6736(05)67185-1. [DOI] [PubMed] [Google Scholar]
- 12.Julius S, Kjeldsen SE, Weber M, Brunner HR, Ekman S, Hansson L, Hua T, Laragh J, McInnes GT, Mitchell L, Plat F, Schork A, Smith B, Zanchetti A VALUE trial group. Outcomes in hypertensive patients at high cardiovascular risk treated with regimens based on valsartan or amlodipine: the VALUE randomised trial. Lancet. 2004;363:2022–2031. doi: 10.1016/S0140-6736(04)16451-9. [DOI] [PubMed] [Google Scholar]
- 13.Jamerson K, Weber MA, Bakris GL, Dahlöf B, Pitt B, Shi V, Hester A, Gupte J, Gatlin M, Velazquez EJ ACCOMPLISH Trial Investigators. Benazepril plus amlodipine or hydrochlorothiazide for hypertension in high-risk patients. NEJM. 2008;359:2417–2428. doi: 10.1056/NEJMoa0806182. [DOI] [PubMed] [Google Scholar]
- 14.Downs JR, Clearfield M, Weis S, Whitney E, Shapiro DR, Beere PA, Langendorfer A, Stein EA, Kruyer W, Gotto AM, Jr for the AFCAPS/TexCAPS Research Group. Primary prevention of acute coronary events with lovastatin in men and women with average cholesterol levels. JAMA. 1998;279:1615–1622. doi: 10.1001/jama.279.20.1615. [DOI] [PubMed] [Google Scholar]
- 15.Sever PS, Dahlöf B, Poulter N, Wedel H, Beevers G, Caulfield M, Collins R, Kjeldsen SE, Kristinsson A, McInnes GT, Mehlsen J, Nieminen M, O’Brien E, Ostergren J ASCOT investigators. Prevention of coronary and stroke events with atorvastatin in hypertensive patients who have average or lower-than-average cholesterol concentrations, in the Anglo-Scandinavian Cardiac Outcomes Trial—Lipid Lowering Arm (ASCOT-LLA): A multicenter randomised controlled trial. Lancet. 2003;361:1149–1158. doi: 10.1016/S0140-6736(03)12948-0. [DOI] [PubMed] [Google Scholar]
- 16. [accessed September 12, 2012]; http://www.healthypeople.gov/2020/topicsobjectives2020/default.aspx.
- 17. [accessed September 12, 2012]; http://millionhearts.hhs.gov/aboutmh/overview.html.
- 18.Wong ND, Pio JR, Franklin SS, L’Italien GJ, Kamath TV, Williams GR. Preventing coronary events by optimal control of blood pressure and lipids in patients with the metabolic syndrome. Am J Cardiol. 2003;91:1421–1426. doi: 10.1016/s0002-9149(03)00392-8. [DOI] [PubMed] [Google Scholar]
- 19.Lewington S, Clarke R. Combined effects of systolic blood pressure and total cholesterol on cardiovascular disease risk. Circulation. 2005;112:3373–3374. doi: 10.1161/CIRCULATIONAHA.105.581934. [DOI] [PubMed] [Google Scholar]
- 20.National Health and Nutrition Examination Survey (NHANES) Health tech/blood pressure procedures manual. Centers for Disease Control; May, 2009. http://www.cdc.gov/nchs/data/nhanes/nhanes_09_10/BP.pdf. [Google Scholar]
- 21.Fields LE, Burt VL, Cutler JA, Hughes J, Roccella EJ, Sorlie P. The burden of adult hypertension in the United States 1999 to 2000. A rising tide. Hypertension. 2004;44:398–404. doi: 10.1161/01.HYP.0000142248.54761.56. [DOI] [PubMed] [Google Scholar]
- 22.The sixth report of the Joint National Committee on Prevention. Detection, Evaluation, and Treatment of High Blood Pressure. Arch Intern Med. 1997;157:2413–2446. doi: 10.1001/archinte.157.21.2413. [DOI] [PubMed] [Google Scholar]
- 23.Chobanian AV, Bakris GL, Black HR, Cushman WC, Green LA, Izzo JL, Jr, Jones DW, Materson BJ, Oparil S, Wright JT, Jr, Roccella EJ Joint National Committee on Prevention, Detection, Evaluation, and Treatment of High Blood Pressure, National Heart, Lung, and Blood Institute; National High Blood Pressure Education Program Coordinating Committee. Seventh report of the Joint National Committee on Prevention, Detection, Evaluation, and Treatment of High Blood Pressure. Hypertension. 2003;42:1206–1252. doi: 10.1161/01.HYP.0000107251.49515.c2. [DOI] [PubMed] [Google Scholar]
- 24.Peralta CA, Norris KC, Li S, Tamura MK, Jolly SE, Bakris G, McCullough PA, Shlipak M KEEP Investigators. Blood pressure components and end-stage renal disease in persons with chronic kidney disease. The Kidney Early Evaluation Program (KEEP) Arch Intern Med. 2012;172:41–47. doi: 10.1001/archinternmed.2011.619. [DOI] [PMC free article] [PubMed] [Google Scholar]
- 25.Appel LJ, Wright JT, Jr, Greene T, Agodoa LY, Astor BC, Bakris GL, Cleveland WH, Charleston J, Contreras G, Faulkner ML, Gabbai FB, Gassman JJ, Hebert LA, Jamerson KA, Kopple JD, Kusek JW, Lash JP, Lea JP, Lewis JB, Lipkowitz MS, Massry SG, Miller ER, Norris K, Phillips RA, Pogue VA, Randall OS, Rostand SG, Smogorzewski MJ, Toto RD, Wang X for the AASK Collaborative Research Group. . Intensive blood pressure control in hypertensive chronic kidney disease. N Engl J Med. 2010;363:918–929. doi: 10.1056/NEJMoa0910975. [DOI] [PMC free article] [PubMed] [Google Scholar]
- 26.Executive Summary of the Third Report of the National Cholesterol Education Program (NCEP) Expert Panel on Detection, Evaluation, and Treatment of High Blood Cholesterol in Adults (Adult Treatment Panel III) JAMA. 2001;285:2486–2497. doi: 10.1001/jama.285.19.2486. [DOI] [PubMed] [Google Scholar]
- 27.Hyre AD, Munter P, Menke A, Raggi P, He J. Trends in ATP-III-defined high blood cholesterol prevalence, awareness, treatment and control among U.S. adults. Ann Epidemiol. 2007;17:548–555. doi: 10.1016/j.annepidem.2007.01.032. [DOI] [PubMed] [Google Scholar]
- 28.Harris MI, Flegal KM, Cowie CC, Eberhardt MS, Goldstein DE, Little RR, Wiedmeyer H-M, Byrd-Holt DD. Prevalence of diabetes, impaired fasting glucose, and impaired glucose tolerance in U.S. adults; the Third National Health and Nutrition Examination Survey, 1988–1994. Diabetes Care. 1998;21:518–524. doi: 10.2337/diacare.21.4.518. [DOI] [PubMed] [Google Scholar]
- 29.Egan BM, Zhao Y, Axon RN, Brzezinski WA, Ferdinand KC. Uncontrolled and apparent treatment resistant hypertension in the U.S. 1988–2008. Circulation. 2011;124:1046–1058. doi: 10.1161/CIRCULATIONAHA.111.030189. [DOI] [PMC free article] [PubMed] [Google Scholar]
- 30.Alexander CM, Landsman PB, Teutsch SM, Haffner SM. NCEP-defined metabolic syndrome, diabetes, and prevalence of coronary heart disease among NHANES III participants age 50 years and older. Diabetes. 2003;52:1210–1214. doi: 10.2337/diabetes.52.5.1210. [DOI] [PubMed] [Google Scholar]
- 31.Muntner P, DeSalvo KB, Wildman RP, Raggi P, He J, Whelton PK. Trends in the prevalence, awareness, treatment, and control of cardiovascular disease risk factors among noninstitutionalized patients with a history of myocardial infarction and stroke. Am J Epidemiol. 2006;163:913–920. doi: 10.1093/aje/kwj124. [DOI] [PubMed] [Google Scholar]
- 32.Summary of the Second Report of the National Cholesterol Education Program (NCEP) Expert Panel on Detection, Evaluation, and Treatment of High Blood Cholesterol in Adults (Adult Treatment Panel II) JAMA. 1993;269:3015–3023. [PubMed] [Google Scholar]
- 33.Report of the National Cholesterol Education Program Expert Panel on Detection, Evaluation, and Treatment of High Blood Cholesterol in Adults. Arch Intern Med. 1988;148:36–69. [PubMed] [Google Scholar]
- 34.Boekholdt SM, Arsenault BJ, Mora S, Pedersen TR, LaRosa JC, Neste PJl, Simes RJ, Durrington P, Hitman GA, Welch KMA, DeMicco DA, Zwinderman AH, Clearfield MB, Downs JR, Tonkin AM, Colhoun HM, Gotto AM, Ridker PM, Kastelein JJP. Association of LDL cholesterol, non-HDL cholesterol, and apolipoprotein B levels with risk of cardiovascular events among patients treated with statins: a meta-analysis. JAMA. 2012;307:1302–1309. doi: 10.1001/jama.2012.366. [DOI] [PubMed] [Google Scholar]
- 35.MRC/BHF Heart Protection Study of cholesterol lowering with simvastatin in 20,536 high-risk individuals: a randomised placebo-controlled trial. Lancet. 2002;360:7–22. doi: 10.1016/S0140-6736(02)09327-3. [DOI] [PubMed] [Google Scholar]
- 36.LaRosa JC, Grundy SM, Waters DD, Shear C, Barter P, Fruchart JC, Gotto AM, Greten H, Kastelein JJ, Shepherd J, Wenger NK Treating to New Targets (TNT) Investigators. Intensive lipid lowering with atorvastatin in patients with stable coronary disease. N Engl J Med. 2005;352:1425–1435. doi: 10.1056/NEJMoa050461. [DOI] [PubMed] [Google Scholar]
- 37.Grundy SM, Cleeman JI, Merz CNB, Brewer HB, Jr, Clark LT, Hunninghake DB, Pasternak RC, Smith SC, Jr, Stone NJ for the Coordinating Committee of the National Cholesterol Education Program. Implications of recent clinical trials for the National Cholesterol Education Program Adult Treatment Panel III Guidelines. Circulation. 2004;110:227–239. doi: 10.1161/01.CIR.0000133317.49796.0E. [DOI] [PubMed] [Google Scholar]
- 38.Roger VL, Go AS, Lloyd-Jones DM, Benjamin E, Berry JD, Borden WB, Bravata DM, Dai S, Ford ES, Fox CS, Fullerton H, Gillespie C, Hailpern SM, Heit JA, Howard VJ, Kissela BM, Kittner SJ, Lackland DT, Lichtman JH, Lisabeth LD, Makuc DM, Marcus GM, Marelli A, Matchar DB, Moy CS, Mozaffarian D, Mussolino ME, Nichol G, Paynter NP, Soliman EZ, Sorlie PD, Sotoodehnia N, Turan TN, Virani SS, Wong ND, Woo D, Turner MB Subcommittee on behalf of the American Heart Association Statistics Committee and Stroke Statistics. Heart disease and stroke statistics–2012 Update. A report from the American Heart Association. Circulation. 2012;125:e2–e220. doi: 10.1161/CIR.0b013e31823ac046. [DOI] [PMC free article] [PubMed] [Google Scholar]
- 39.Ahluwalia JS, McNagny SE, Rask KJ. Correlates of controlled hypertension in indigent, inner-city hypertensive patients. J Gen Intern Med. 1997;12:7–14. doi: 10.1046/j.1525-1497.1997.12107.x. [DOI] [PMC free article] [PubMed] [Google Scholar]
- 40.Ridker PM, Danielson E, Fonseca FAH, Genest J, Gotto AM, Jr, Kastelein JJ, Koenig W, Libby P, Lorenzatti AJ, MacFadyen JG, Nordestgaard BG, Shepherd J, Willerson JT, Glynn RJ JUPITER Study Group. Rosuvastatin to prevent vascular events in men and women with elevated C-Reactive Protein. NEJM. 2008;359:2195–2207. doi: 10.1056/NEJMoa0807646. [DOI] [PubMed] [Google Scholar]
- 41.Centers for Disease Control and Prevention, National Center for Health Statistics. Compressed Mortality File 1979–1998. CDC WONDER On-line Database; [Sep 28, 2012]. compiled from Compressed Mortality File CMF 1979–1998, Series 20, No. 2E, 2003 and CMF 1999–2009 Series 20 No. 2O, 2012 and using 2009 population as a constant for all comparisons. Accessed at http://wonder.cdc.gov/cmf-icd10.html on. [Google Scholar]
- 42.Guo F, He D, Zhan W, Walton G. Trends in the prevalence, awareness, management and control of hypertension among United States adults, 1999 to 2010. JACC. 2012;60:599–606. doi: 10.1016/j.jacc.2012.04.026. [DOI] [PubMed] [Google Scholar]
- 43.Kontush A, Chapman MJ. Functionally defective high-density lipoprotein: a new therapeutic target at the crossroads of dyslipidemia, inflammation, and atherosclerosis. Pharmacol Rev. 2006;58:342–374. doi: 10.1124/pr.58.3.1. [DOI] [PubMed] [Google Scholar]
- 44.CDC Vital Signs: Prevalence, Treatment, and Control of Hypertension ---United States, 1999–2002 and 2005–2008. MMWR. 2011;60:103–108. [PubMed] [Google Scholar]
- 45.Carroll MD, Kit BK, Lacher DA, Shero ST, Mussolino ME. Trends in lipids and lipoproteins in US adults, 1988–2010. JAMA. 2012;308:1545–1554. doi: 10.1001/jama.2012.13260. [DOI] [PubMed] [Google Scholar]
- 46.Handler J, Zhao Y, Egan BM. Impact of the number of blood pressure measurements on blood pressure classification in U.S. adults: NHANES 1999–2008. J Clin Hypertens. 2012;14:751–759. doi: 10.1111/jch.12009. [DOI] [PMC free article] [PubMed] [Google Scholar]
- 47.Roger VL, Go AS, Lloyd-Jones DM, Adams RJ, Berry JD, Brown TM, Carnethon MR, Dai S, de Simone G, Ford ES, Fox CS, Fullerton HJ, Gillespie C, Greenlund KJ, Hailpern SM, Heit JA, Ho PM, Howard VJ, Kissela BM, Kittner SJ, Lackland DT, Lichtman JH, Lisabeth LD, Makuc DM, Marcus GM, Marelli A, Matchar DB, McDermott MM, Meigs JB, Moy CS, Mozaffarian D, Mussolino ME, Nichol G, Paynter NP, Rosamond WD, Sorlie PD, Stafford RS, Turan TN, Turner MB, Wong ND, Wylie-Rosett J American Heart Association Statistics Committee and Stroke Statistics Subcommittee. Heart disease and stroke statistics–2011 Update. A report from the American Heart Association. Circulation. 2011;123:e18–e209. doi: 10.1161/CIR.0b013e3182009701. [DOI] [PMC free article] [PubMed] [Google Scholar]
Associated Data
This section collects any data citations, data availability statements, or supplementary materials included in this article.