

Abstract
Obesity is associated with vascular diseases that are often attributed to vascular oxidative stress. We tested the hypothesis that vascular oxidative stress could induce obesity. We previously developed mice that overexpress p22phox in vascular smooth muscle, tgsm/p22phox, which have increased vascular ROS production. At baseline, tgsm/p22phox mice have a modest increase in body weight. With high-fat feeding, tgsm/p22phox mice developed exaggerated obesity and increased fat mass. Body weight increased from 32.16 ± 2.34 g to 43.03 ± 1.44 g in tgsm/p22phox mice (vs. 30.81 ± 0.71 g to 37.89 ± 1.16 g in the WT mice). This was associated with development of glucose intolerance, reduced HDL cholesterol, and increased levels of leptin and MCP-1. Tgsm/p22phox mice displayed impaired spontaneous activity and increased mitochondrial ROS production and mitochondrial dysfunction in skeletal muscle. In mice with vascular smooth muscle–targeted deletion of p22phox (p22phoxloxp/loxp/tgsmmhc/cre mice), high-fat feeding did not induce weight gain or leptin resistance. These mice also had reduced T-cell infiltration of perivascular fat. In conclusion, these data indicate that vascular oxidative stress induces obesity and metabolic syndrome, accompanied by and likely due to exercise intolerance, vascular inflammation, and augmented adipogenesis. These data indicate that vascular ROS may play a causal role in the development of obesity and metabolic syndrome.
Introduction
Obesity is recognized as the leading public health problem in Western societies. Approximately one-third of American men and women >20 years of age are obese (1). In addition to excessive energy intake, obese animals and humans display reduced spontaneous activity and energy expenditure. The mechanisms for this remain unclear, but impairments in skeletal muscle perfusion and insulin uptake are present in humans with diabetes and obesity (2). Likewise, obesity and metabolic syndrome are commonly associated with oxidative stress (3), which in turn likely contributes to perturbations of tissue perfusion.
Obesity is also commonly associated with vascular diseases including hypertension and atherosclerosis (4). A major source of reactive oxygen species (ROS) in vascular cells is the NADPH oxidases (NOX enzymes) (5). These enzymes are activated by various hormones, cytokines, and altered mechanical forces. ROS produced by the NOX enzymes can activate downstream enzymatic sources of ROS, such as uncoupled nitric oxide (NO) synthase and mitochondria (6). In experimental hypertension, atherosclerosis, and diabetes, the NOX enzymes are activated to contribute to vascular dysfunction. Mice lacking components of the NOXs are protected against hypertension and when crossed to the apoE−/− background have reduced atherosclerotic lesion formation (7,8).
In the current study, we tested the hypothesis that excessive vascular ROS produced by the NOX enzymes play a causal role in obesity by promoting inflammation, adipogenesis, and exercise intolerance. To perform these studies, we used mice that we previously generated in which the NOX subunit p22phox is overexpressed in smooth muscle cells (tgsm/p22phox) (9). As a docking subunit for all NOX proteins in rodents, p22phox stabilizes these proteins and is essential for their function. Tgsm/p22phox mice have increased vascular smooth muscle NOX1 (9) and increased vascular superoxide and hydrogen peroxide production at baseline. When given angiotensin II, these animals develop augmented hypertension (10). We found that tgsm/p22phox mice develop marked obesity, insulin resistance, leptin resistance, and parameters of metabolic syndrome upon high-fat feeding. These mice also had impaired spontaneous activity and skeletal muscle mitochondrial dysfunction. Studies of mice lacking p22phox in vascular smooth muscle confirmed a role of this protein in modulation of weight gain. Taken together, these studies identify a previously unidentified role for vascular ROS as a causal factor for obesity and its associated metabolic consequences.
Results
Augmented Obesity, Leptin Resistance, and Adipogenesis in High-Fat Diet–Fed Tgsm/p22phox Mice
High-fat feeding induced a significantly greater increase in body weight in tgsm/p22phox mice compared with wild-type (WT) controls (Fig. 1A–B). The composition of the high-fat diet is provided in Supplementary Table 1. As shown in Supplementary Table 2, resting levels of body weight, food intake, water intake, energy intake, leptin, cholesterol, insulin, and glucose were not different among all groups. Figure 1A illustrates the appearance of representative WT or tgsm/p22phox mice fed a normal or high-fat diet for 6 weeks. Whereas body weight of 6-month-old WT mice increased from 30.81 ± 0.71 g to 37.89 ± 1.16 g after high-fat feeding for 6 weeks, body weight of tgsm/p22phox mice increased from 32.16 ± 2.34 g to 43.03 ± 1.44 g (Fig. 1B). The percentage of body weight increase was 34% vs. 23% for tgsm/p22phox vs. WT mice, indicating 50% more weight gain in the tgsm/p22phox animals. Of note, the augmented weight gain in tgsm/p22phox mice was accompanied by increased abdominal white fat (Fig. 1C) and liver size (Fig. 1D). There were no noticeable increases in intake of water, food, or calculated energy in tgsm/p22phox mice compared with WT controls when fed high-fat diet (Fig. 2A–C). Although water intake was transiently reduced in tgsm/p22phox mice at 3 weeks of high-fat feeding, it did not affect energy intake.
Figure 1.

Augmented obesity in high-fat diet–fed tgsm/p22phox mice. A: Representative mice from WT and tgsm/p22phox groups fed with high-fat diet for 6 weeks. B: Body weight gain in WT and tgsm/p22phox mice fed with control or high-fat diet for 6 weeks. C: White fat mass. D: Liver weight in WT and tgsm/p22phox mice fed with control or high-fat diet for 6 weeks. Data are presented as mean ± SEM; n = 10–14 for A–D.
Figure 2.

Changes in water intake, food intake, and energy intake in WT and tgsm/p22phox mice fed with control or high-fat diet for 6 weeks. A: Water intake was measured weekly, and there were no significant changes among the four different groups except for weeks 3–5. B: Weekly food intake was decreased in WT mice after high-fat feeding for 2 weeks. C: Energy intake was calculated into kilocalories from grams of food ingested as described in Research Design and Methods. Data are presented as mean ± SEM; n = 7–11 for A–C.
In a subgroup of animals, nuclear magnetic resonance (NMR) analysis of tissue subtype revealed that tgsm/p22phox mice had slightly greater skeletal muscle mass than the WT mice at baseline, and this did not change in either group with fat feeding (Fig. 3C). In contrast, adipose tissue mass markedly increased in the tgsm/p22phox mice compared with the WT mice (Fig. 3B), corresponding to increased body weight, as assessed by NMR as well (Fig. 3A).
Figure 3.

NMR analysis of body weight, fat mass, and muscle mass in WT and tgsm/p22phox mice fed with control or high-fat diet for 6 weeks. A: Body weight was measured weekly. High-fat diet feeding induced an exaggerated body weight gain in tgsm/p22phox mice. B: Total fat mass was measured weekly and found to be substantially more increased by high-fat diet feeding in tgsm/p22phox mice. C: Total muscle mass was monitored weekly and found not to be different either at baseline or at 6 weeks after high-fat diet feeding between WT and tgsm/p22phox mice. Data are presented as mean ± SEM; n = 5 for A–C.
Plasma leptin levels were markedly elevated in high-fat diet–fed tgsm/p22phox mice compared with those of WT mice (Fig. 4A). Given that leptin is a key adipocyte-derived hormone in controlling body weight and energy balance via regulation of food intake, the parallel increase in body weight and plasma leptin levels seems to indicate a leptin-resistant phenotype. Although total cholesterol levels were similar between the groups (Fig. 4B), HDL cholesterol was significantly reduced in high-fat diet–fed tgsm/p22phox mice (Fig. 4C) (66.47 mg/dL ± 19.35 mg/dL to 64.05 mg/dL ± 11.34 mg/dL for WT vs. 88.87 ± 31.06 to 27.18 ± 1.92 mg/dL for tgsm/p22phox respectively). Of note, even at baseline, the 6-month-old tgsm/p22phox mice had modestly increased body weight compared with age-matched WT controls (33.91 ± 0.96 g vs. 30.34 ± 0.58 g for tgsm/p22phox vs. WT, n = 25, P < 0.05). This was not noted before, but the animals studied previously were 6 weeks old (9). In addition, circulating level of monocyte chemoattractant protein (MCP)-1, a marker of inflammation that is often elevated in obesity, was significantly increased in high-fat diet–fed tgsm/p22phox mice (Fig. 4D), which is positively correlated with leptin level (Fig. 4E).
Figure 4.

Leptin resistance and dyslipidemia in high-fat diet–fed tgsm/p22phox mice. A: Plasma leptin levels were measured weekly as described in Research Design and Methods. A remarkable increase in plasma leptin levels was observed in high-fat diet–fed tgsm/p22phox mice, while it did not occur in the WT mice fed with a high-fat diet. These data implicate a leptin resistance phenotype. B: Total cholesterol levels were increased in both WT and tgsm/p22phox mice fed with high-fat diet. C: High-fat diet feeding induced a significant reduction in HDL cholesterol in tgsm/p22phox mice. D: Plasma MCP-1 levels at 6 weeks of high-fat feeding were markedly increased in tgsm/p22phox mice. Data are presented as mean ± SEM; n = 7–11 for A–C, n = 6–7 for D). E: Plasma MCP-1 levels were positively correlated with plasma leptin levels (n = 27 of 4 groups).
Insulin Resistance and Augmented Glucose Intolerance in High-Fat Diet–Fed Tgsm/p22phox Mice
High-fat feeding slightly increased fasting plasma glucose levels in both WT and tgsm/p22phox mice (Fig. 5A). However, plasma insulin levels were elevated in a time-dependent manner in high-fat diet–fed tgsm/p22phox mice (Fig. 5B). As is obvious in Fig. 5A and B, tgsm/p22phox mice developed glucose intolerance as assessed by glucose tolerance tests. Glucose intolerance was observed in high-fat diet–fed tgsm/p22phox mice at week 3 (Fig. 6A), and this was significantly aggravated by high-fat feeding at week 5 in tgsm/p22phox mice (Fig. 6B).
Figure 5.
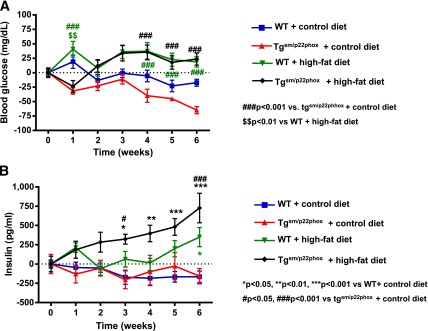
Insulin resistance in high-fat diet–fed tgsm/p22phox mice. A: Fasting glucose levels were measured weekly over 6 weeks. Changes from baseline were presented. B: Weekly circulating insulin levels were determined by ELISA. Insulin levels were elevated in a time-dependent manner in high-fat diet–fed tgsm/p22phox mice. Data are presented as mean ± SEM; n = 7–11 for A and B.
Figure 6.
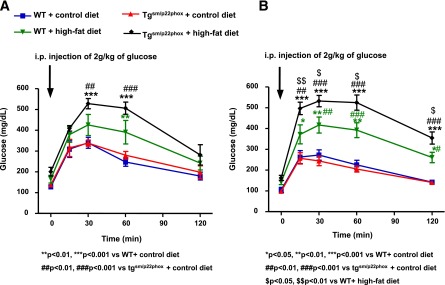
Impaired glucose tolerance in high-fat diet–fed tgsm/p22phox mice. Intraperitoneal glucose tolerance test was performed at weeks 3 and 5. A: Glucose intolerance was observed in high-fat diet–fed tgsm/p22phox mice at week 3. B: Glucose intolerance was aggravated by high-fat feeding at week 5 in tgsm/p22phox mice. Data are presented as mean ± SEM; n = 7–11 for A and B.
Reduced Spontaneous Activity in High-Fat Diet–Fed Tgsm/p22phox Mice
Because tgsm/p22phox and WT mice had similar energy intake during high-fat feeding, we considered the possibility that excessive weight gain in tgsm/p22phox mice is due to alterations in energy utilization. To examine this, we monitored nocturnal spontaneous activity using a video monitoring system. As shown in Fig. 7A, the spontaneous activity was similar between tgsm/p22phox and WT mice before high-fat feeding. Whereas high-fat feeding did not change spontaneous activity in WT mice, it induced a significant and graduate decline in spontaneous activity in high-fat diet–fed tgsm/p22phox animals.
Figure 7.

Decreased spontaneous activity accompanied by mitochondrial dysfunction in skeletal muscle of high-fat–fed tgsm/p22phox mice. A: Spontaneous activity was monitored over 8 weeks of high-fat diet feeding and progressively declined in the tgsm/p22phox mice while remaining constant in the WT mice. B: Mitochondrial fraction from skeletal muscle was prepared as described in Research Design and Methods and subjected to superoxide detection using electron spin resonance. Mitochondrial superoxide production from high-fat diet–fed tgsm/p22phox mice was increased more than threefold compared with WT controls fed high-fat diet. C: Calcium-induced swelling of skeletal muscle mitochondria was significantly augmented in high-fat diet–fed tgsm/p22phox mice compared with WT controls fed high-fat diet. n = 11–13. Data are presented as mean ± SEM.
Mitochondrial Dysfunction and ROS Production in Skeletal Muscle of High-Fat Diet–Fed Tgsm/p22phox Mice
Mitochondrial function is critical for skeletal myocyte ATP supply. We have previously shown that ROS produced by the NOX enzymes can impair mitochondrial function and therefore considered the hypothesis that ROS produced by the vascular NOX might affect skeletal muscle mitochondrial function (11,12). Interestingly, high-fat feeding induced a near threefold increase in mitochondrial superoxide production in tgsm/p22phox mice (Fig. 7B), which was accompanied with markedly impaired mitochondrial function as assessed by calcium-induced swelling assay (Fig. 7C).
Prevention of High Fat–Induced Obesity and Leptin Resistance in p22phox VSMC Conditional KO Mice
For further examination of the role of vascular ROS in the development of obesity and leptin resistance, VSMC p22phox conditional KO mice were made using a Cre-LoxP approach (p22phoxloxp/loxp/tgsmmhc/cre). As is obvious in Fig. 8A, activation of Cre recombinase by tamoxifen injection decreased p22phox protein expression. Importantly, the weight gain caused by fat feeding was virtually absent in mice lacking vascular p22phox (Fig. 8B). Plasma leptin levels were markedly attenuated in these animals in response to a high-fat diet (Fig. 8C). In contrast, leptin levels were elevated in WT animals treated with corn oil as a control.
Figure 8.

Prevention of obesity induction in p22phox knockout mice. p22phoxloxp/loxp crossed with mice expressing Cre recombinase driven by the tamoxifen inducible smooth muscle myosin heavy chain promoter, Tgsmmhc/cre. A: Expression of p22phox was decreased upon tamoxifen introduction. B: High-fat feeding for 6 weeks failed to induce body weight gain in p22phox knockout mice. n = 6. C: Leptin level was attenuated in high-fat diet–fed p22phox knockout mice, while it was increased in vehicle corn oil–treated mice with high-fat diet feeding or cre-negative mice. n = 5–6. Data are presented as mean ± SEM.
Prevention of High Fat–Induced Perivascular Inflammation in p22phox VSMC Conditional KO Mice
In addition to enhanced adipogenesis and exercise intolerance, vascular ROS might induce obesity by augmenting inflammation in perivascular fat tissues. This process has previously been shown to mediate vascular dysfunction in hypertension (13–15). Therefore, we analyzed leukocytes and T-cell subpopulations in perivascular fat of high-fat diet–fed p22phoxloxp/loxp/tgsmmhc/cre mice. As is obvious in Fig. 9, both leukocyte and T-cell subtypes were markedly reduced in the perivascular tissues of high-fat diet–fed p22phoxloxp/loxp/tgsmmhc/cre mice.
Figure 9.

Effect of high-fat feeding on mesenteric fat leukocytes in presence and absence of VSM p22phox. Mice were fed either a control diet or a high-fat diet for 6 weeks. Mice fed a high-fat diet were p22phoxloxp/loxp, and half had the VSMC-specific Cre transgene induced by tamoxifen injection (gray bars). As control, p22phoxloxp/loxp Cre-negative mice were also fed a high-fat diet and were treated with tamoxifen (black bars). The mesenteric vasculature with all adjacent fat was removed en bloc, digested, and subjected to FACS analysis for measurement of total leukocytes and T-cell subtypes. A: Populations of leukocytes were analyzed by FACS. B: T-cell subtypes were also analyzed by FACS. Data are presented as mean ± SEM; n = 4 for A and B.
Discussion
The most significant finding of the current study is that vascular ROS play an important role in the development of obesity and metabolic syndrome as characterized by dyslipidemia, leptin resistance, inflammation, insulin resistance, and glucose intolerance. High-fat feeding of genetically altered mice with elevated vascular ROS resulted in exaggerated obesity and a phenotype characteristic of the metabolic syndrome. Notably, this phenotype is associated with increased fat mass, impaired spontaneous activity, and skeletal muscle mitochondrial dysfunction, as well as enhanced inflammation of perivascular fat. Additional experiments demonstrated that these phenotypes were attenuated in mice lacking vascular p22phox.
Epidemiologically, obesity is commonly associated with diseases like hypertension, hypercholesterolemia, and diabetes (16). Moreover, experimental studies have shown that these diseases promote vascular ROS production (17). It has been thought that obesity is often causal in these conditions (18–20). However, our present study suggests that vascular ROS overproduction might instead precede and predispose to the development of obesity and metabolic syndrome. Fat feeding induced greater weight gain, glucose intolerance, and leptin intolerance in tgsm/p22phox mice than in WT mice. It is important to note that these animals had ingested a similar amount of calculated energy, implicating that weight gain was not caused by increased appetite or energy intake. In additional experiments, we found that these animals had reduced spontaneous activity and skeletal muscle mitochondrial dysfunction, implicating reduced energy expenditure.
Many obese patients habitually consume a high-fat diet. Our data suggest that coexisting conditions associated with increased vascular ROS production, such as hypertension or hypercholesterolemia, might serve as a second stimulus in addition to dietary indiscretion, together contributing to development of obesity and metabolic syndrome. Intriguingly, plasma leptin levels were markedly increased in fat-fed tgsm/p22phox mice, while the body weight was still much elevated. These data establish an important role of vascular ROS in inducing leptin resistance. In normal conditions, insulin stimulates leptin secretion from adipocytes, which in turn inhibits insulin synthesis and secretion from pancreatic β-cells. In leptin resistance, however, this regulation is disrupted, creating a feed-forward cycle leading to further weight gain (21). In fat-fed tgsm/p22phox mice, leptin resistance occurred 2 weeks after initiation of the high-fat diet, and this was followed by the development of glucose intolerance at 3 weeks of fat feeding, implicating a deleterious contribution of vascular ROS to the axis of leptin-insulin regulation.
The impaired spontaneous activity in the fat-fed tgsm/p22phox mice is linked to increased ROS production in the skeletal muscle. Yokota et al. (22) described exercise intolerance and mitochondrial complex I and II deficiencies in fat feeding–induced diabetes, which were improved by administration of apocynin, an inhibitor of flavin-containing oxidases. These findings suggest a role of ROS in regulating skeletal muscle mitochondrial function and exercise capacity (23). Prior studies from our group and others have shown that ROS generated by the NOX enzymes can diffuse to the mitochondria to stimulate ROS production. Based on this concept of ROS-dependent ROS production (24), we hypothesize that vascular ROS is capable of diffusing to adjacent skeletal muscle cells to activate ROS in these cells. Recently, it was also found that angiotensin II–induced oxidative stress in skeletal muscle limits exercise capacity while inducing skeletal muscle mitochondrial dysfunction, both of which were attenuated by apocynin administration (25). Consistent with this, mice deficient in Mn-SOD developed severe exercise disturbance (26). In the current study, we found that Mn-SOD inhabitable superoxide is substantially increased in the skeletal muscle of tgsm/p22phox mice. Taken together, vascular oxidative stress may induce skeletal muscle dysfunction via 1) activation of skeletal muscle ROS production and 2) perturbation of perfusion to skeletal muscle due to ROS scavenging of the vasodilatation factor NO.
Our data also suggest a possible role of inflammation in the modulation of obesity. We found a significant increase in T cells in the mesenteric fat of fat-fed WT mice, and this was prevented in mice lacking the vascular NADPH oxidase. A similar infiltration of T cells to perivascular adipose tissue occurs in angiotensin II–infused mice (13–15). It has been suggested that perivascular adipose tissue functions as an endocrine organ, releasing bioactive factors that regulate vascular function (27). It has been unclear as to whether inflammation of the perivascular adipose tissue contributes to obesity. Our data indicate that in mice deficient in vascular ROS production, T-cell infiltration of perivascular adipose tissue is markedly reduced, likely contributing to the reduction in obesity observed in these animals. Conversely, elevated MCP-1 was found in high-fat diet–fed tgsm/p22phox, which correlated well with an elevation in leptin levels. Given that MCP-1 expression is upregulated in obese patients and that MCP-1 is inducible by leptin (28) or high glucose (29) via an ROS-dependent pathway, our data further demonstrate that vascular ROS may contribute to the development of obesity via regulation of inflammation.
In conclusion, our present study for the first time defines an important causal role of vascular oxidative stress in development of obesity and metabolic syndrome, likely due to exercise intolerance, vascular inflammation, and augmented adipogenesis. These findings may be paradigm shifting in revealing that vascular oxidative stress can be a cause, rather than a mere consequence, of obesity and metabolic syndrome. Thus, targeting vascular dysfunction and oxidative stress might prove to be an effective approach to prevent and/or treat obesity.
Research Design and Methods
Animals and Experimental Model
Male C57BL/6 mice (6 months old) were purchased from Charles River Laboratories (Hollister, CA) to serve as WT control. Age-matched mice overexpressing p22phox in smooth muscle (tgp22smc) have previously been described (30) and were bred in-house at the University of California, Los Angeles, and Vanderbilt University. The p22phoxloxp/loxp/tgsmmhc/cre mice were bred at Vanderbilt University. The transgenic mice with tamoxifen-inducible Cre recombinase driven by the smooth muscle myosin heavy chain (tgsmmhc/cre mice) were generous gifts from Dr. Stephan Offermanns, University of Heidelberg, and were crossed with mice containing loxP sites flanking the coding region of p22phox as previously described (31). For Cre-inducible deletion of p22phox in the vascular smooth muscle, p22phoxloxp/loxp/tgsmmhc/cre mice received tamoxifen injections (3 mg/20 g i.p., every other day for 10 days) prior to high-fat diet feeding for 6 weeks.
Animals were maintained in a temperature-controlled environment (22°C) on a 12-h light-dark cycle. Mice were randomly divided into two dietary groups and were fed either a high-fat diet (42% fat; Harlan Laboratories, Madison, WI) or a standard diet for 6 weeks (Supplementary Table 1). Mice were provided with 200 g food and 400 mL water, and their weekly intake was monitored. Energy intake, calculated as kilocalories per gram of food, was 3.1 kcal/g for the control diet and 4.5 kcal/g for the high-fat diet, based on information provided by the supplier. Activity was monitored using infrared webcams for 8 weeks and analyzed using motion-detection software. The institutional animal care and use committees at University of California, Los Angeles, and Vanderbilt approved all experimental procedures.
Analysis of Fasting Glucose, Insulin, Leptin, MCP-1, and Lipids
Blood glucose was determined at baseline and weekly thereafter using the OneTouch Ultra blood glucose meter (LifeScan). Plasma insulin levels were analyzed using an ELISA for rat insulin (Ultra Sensitive Rat Insulin ELISA; Crystal Chem). Plasma leptin levels were determined using a mouse leptin ELISA kit (Crystal Chem). Quantitative determination of mouse MCP-1 levels in plasma was performed by using an ELISA kit (R&D Systems). Plasma cholesterol was determined using a cholesterol reagent colorimetric assay kit (Roche Diagnostics). For determination of plasma HDL cholesterol levels, plasma was incubated with an HDL cholesterol precipitating reagent (Pointe Scientific, Canton, MI) followed by separation of HDL by centrifugation (2,000g, 10 min). HDL was then quantified using an enzymatic cholesterol detection kit (Roche Diagnostics).
Glucose Tolerance Test
After an 8-h fast, mice were injected with glucose (2 g/kg body wt i.p. in 0.9% saline). Whole-blood samples were collected from the tail vein at baseline and 15, 30, 60, and 120 min after glucose injection.
Mitochondrial Swelling Assay
Mitochondria from skeletal muscle were isolated by differential centrifugation as previously described (32). Freshly isolated mitochondria were incubated with a buffer containing 250 mmol/L sucrose, 10 mmol/L Tris (pH 7.4), and 5 mmol/L succinate for 1 min at room temperature before swelling was initiated by the addition of 250 μmol/L CaCl2. Mitochondrial swelling was measured by monitoring the decrease in absorbance at 540 nm.
Electron Spin Resonance Measurement of Mitochondrial Superoxide Production
Freshly isolated skeletal muscle tissues were grounded with 3 vol mitochondrial isolation buffer I (250 mmol/L sucrose, 10 mmol/L HEPES, 10 mmol/L Tris, 1 mmol/L EGTA, pH 7.4) in a glass tissue grinder by 15 strokes. Homogenates were centrifuged at 800g for 7 min at 4°C. Supernatants were further centrifuged at 4,000g for 15 min at 4°C. Pellet containing mitochondria was rinsed by resuspension with mitochondrial isolation buffer II (250 mmol/L sucrose, 10 mmol/L HEPES, 10 mmol/L Tris, pH 7.4) and centrifugation at 4,000g for 15 min. After centrifugation, pellet was resuspended with 100 µL mitochondrial isolation buffer II and then used for superoxide measurement. Freshly prepared mitochondrial fraction of skeletal muscle was incubated with spin trap solution in the presence and absence of 100 units/mL Mn-SOD for 5 min prior to being loaded into glass capillary (Fisher Scientific) for analysis of O2•− signal using e-scan electron spin resonance spectrometer (Bruker) as we previously published (33–38).
Isolation and Analysis of T-Cell Populations in Perivascular Fat
Mesenteric vascular arcade with its attached perivascular fat was isolated and digested with collagenase and hyaluronidase as previously described (13–15). The single-cell suspensions were subjected to fluorescence-activated cell sorter (FACS) for detection of CD45+ cells (total leukocytes), CD3+ cells (T cells), CD4+ and CD8+ cells, and macrophages (with CD11b and F4/80) in fat (13–15).
Statistical Analysis
Differences among different groups of means were compared with ANOVA for multiple means with a Tukey multiple comparison as a post hoc. For comparisons of mean values among groups over time, two-way ANOVA followed by Bonferroni posttest was performed. Before data analysis, resting levels at baseline were subtracted from the data by using the function of “remove baseline and column math” of GraphPad Prism version 6.0 software. The resting levels were presented in Supplementary Table 2, while the analyzed data after subtraction were presented in Figs. 1–5. Correlation between levels of leptin and MCP-1 was assessed using Pearson correlation analysis. Statistical significance was considered present for P < 0.05. All data are presented as means ± SEM.
Article Information
Funding. The authors’ work was supported by National Heart, Lung, and Blood Institute (NHLBI) grants HL-077440 (to H.C.), HL-088975 (to H.C.), HL-108701 (to H.C. and D.G.H.), and HL-119968 (to H.C.) and American Heart Association Established Investigator Award 12E-IA-8990025 (to H.C.).
Duality of Interest. No potential conflicts of interest relevant to this article were reported.
Author Contributions. J.-Y.Y. researched data and wrote the manuscript. K.L.S., H.E.L., and H.I. researched data. D.G.H. bred the mice, researched study design, and reviewed and edited the manuscript. H.C. researched study design and wrote and edited the manuscript. H.C. is the guarantor of this work and, as such, had full access to all the data in the study and takes responsibility for the integrity of the data and the accuracy of the data analysis.
Footnotes
This article contains Supplementary Data online at http://diabetes.diabetesjournals.org/lookup/suppl/doi:10.2337/db13-0719/-/DC1.
See accompanying article, p. 2216.
References
- 1.Roger VL, Go AS, Lloyd-Jones DM, et al. American Heart Association Statistics Committee and Stroke Statistics Subcommittee Heart disease and stroke statistics—2011 update: a report from the American Heart Association. Circulation 2011;123:e18–e209 [DOI] [PMC free article] [PubMed] [Google Scholar]
- 2.Baron AD, Laakso M, Brechtel G, Edelman SV. Mechanism of insulin resistance in insulin-dependent diabetes mellitus: a major role for reduced skeletal muscle blood flow. J Clin Endocrinol Metab 1991;73:637–643 [DOI] [PubMed] [Google Scholar]
- 3.Vincent HK, Innes KE, Vincent KR. Oxidative stress and potential interventions to reduce oxidative stress in overweight and obesity. Diabetes Obes Metab 2007;9:813–839 [DOI] [PubMed] [Google Scholar]
- 4.Wisse BE, Kim F, Schwartz MW. Physiology. An integrative view of obesity. Science 2007;318:928–929 [DOI] [PubMed] [Google Scholar]
- 5.Lassegue B, San Martin A, Griendling KK. Biochemistry, physiology, and pathophysiology of NADPH oxidases in the cardiovascular system. Circ Res 2012;110:1364–1390 [DOI] [PMC free article] [PubMed]
- 6.Mueller CF, Laude K, McNally JS, Harrison DG. ATVB in focus: redox mechanisms in blood vessels. Arterioscler Thromb Vasc Biol 2005;25:274–278 [DOI] [PubMed] [Google Scholar]
- 7.Barry-Lane PA, Patterson C, van der Merwe M, et al. p47phox is required for atherosclerotic lesion progression in ApoE(-/-) mice. J Clin Invest 2001;108:1513–1522 [DOI] [PMC free article] [PubMed] [Google Scholar]
- 8.Judkins CP, Diep H, Broughton BR, et al. Direct evidence of a role for Nox2 in superoxide production, reduced nitric oxide bioavailability, and early atherosclerotic plaque formation in ApoE-/- mice. Am J Physiol Heart Circ Physiol 2010;298:H24–H32 [DOI] [PubMed] [Google Scholar]
- 9.Laude K, Cai H, Fink B, et al. Hemodynamic and biochemical adaptations to vascular smooth muscle overexpression of p22phox in mice. Am J Physiol Heart Circ Physiol 2005;288:H7–H12 [DOI] [PubMed] [Google Scholar]
- 10.Weber DS, Rocic P, Mellis AM, et al. Angiotensin II-induced hypertrophy is potentiated in mice overexpressing p22phox in vascular smooth muscle. Am J Physiol Heart Circ Physiol 2005;288:H37–H42 [DOI] [PubMed] [Google Scholar]
- 11.Doughan AK, Harrison DG, Dikalov SI. Molecular mechanisms of angiotensin II-mediated mitochondrial dysfunction: linking mitochondrial oxidative damage and vascular endothelial dysfunction. Circ Res 2008;102:488–496 [DOI] [PubMed] [Google Scholar]
- 12.Youn JY, Gao L, Cai H. The p47phox- and NADPH oxidase organiser 1 (NOXO1)-dependent activation of NADPH oxidase 1 (NOX1) mediates endothelial nitric oxide synthase (eNOS) uncoupling and endothelial dysfunction in a streptozotocin-induced murine model of diabetes. Diabetologia 2012;55:2069–2079 [DOI] [PMC free article] [PubMed]
- 13.Guzik TJ, Hoch NE, Brown KA, et al. Role of the T cell in the genesis of angiotensin II induced hypertension and vascular dysfunction. J Exp Med 2007;204:2449–2460 [DOI] [PMC free article] [PubMed] [Google Scholar]
- 14.Madhur MS, Lob HE, McCann LA, et al. Interleukin 17 promotes angiotensin II-induced hypertension and vascular dysfunction. Hypertension 2010;55:500–507 [DOI] [PMC free article] [PubMed] [Google Scholar]
- 15.Marvar PJ, Thabet SR, Guzik TJ, et al. Central and peripheral mechanisms of T-lymphocyte activation and vascular inflammation produced by angiotensin II-induced hypertension. Circ Res 2010;107:263–270 [DOI] [PMC free article] [PubMed] [Google Scholar]
- 16.Poirier P, Giles TD, Bray GA, et al. American Heart Association. Obesity Committee of the Council on Nutrition, Physical Activity, and Metabolism Obesity and cardiovascular disease: pathophysiology, evaluation, and effect of weight loss: an update of the 1997 American Heart Association Scientific Statement on Obesity and Heart Disease from the Obesity Committee of the Council on Nutrition, Physical Activity, and Metabolism. Circulation 2006;113:898–918 [DOI] [PubMed] [Google Scholar]
- 17.Cai H, Harrison DG. Endothelial dysfunction in cardiovascular diseases: the role of oxidant stress. Circ Res 2000;87:840–844 [DOI] [PubMed] [Google Scholar]
- 18.Meyers MR, Gokce N. Endothelial dysfunction in obesity: etiological role in atherosclerosis. Curr Opin Endocrinol Diabetes Obes 2007;14:365–369 [DOI] [PubMed] [Google Scholar]
- 19.Kotsis V, Stabouli S, Papakatsika S, Rizos Z, Parati G. Mechanisms of obesity-induced hypertension. Hypertens Res 2010;33:386–393 [DOI] [PubMed] [Google Scholar]
- 20.Hall JE, da Silva AA, do Carmo JM, et al. Obesity-induced hypertension: role of sympathetic nervous system, leptin, and melanocortins. J Biol Chem 2010;285:17271–17276 [DOI] [PMC free article] [PubMed] [Google Scholar]
- 21.Koh KK, Park SM, Quon MJ. Leptin and cardiovascular disease: response to therapeutic interventions. Circulation 2008;117:3238–3249 [DOI] [PMC free article] [PubMed] [Google Scholar]
- 22.Yokota T, Kinugawa S, Hirabayashi K, et al. Oxidative stress in skeletal muscle impairs mitochondrial respiration and limits exercise capacity in type 2 diabetic mice. Am J Physiol Heart Circ Physiol 2009;297:H1069–H1077 [DOI] [PubMed] [Google Scholar]
- 23.Heumüller S, Wind S, Barbosa-Sicard E, et al. Apocynin is not an inhibitor of vascular NADPH oxidases but an antioxidant. Hypertension 2008;51:211–217 [DOI] [PubMed] [Google Scholar]
- 24.Cai H. NAD(P)H oxidase-dependent self-propagation of hydrogen peroxide and vascular disease. Circ Res 2005;96:818–822 [DOI] [PubMed] [Google Scholar]
- 25.Inoue N, Kinugawa S, Suga T, et al. Angiotensin II-induced reduction in exercise capacity is associated with increased oxidative stress in skeletal muscle. Am J Physiol Heart Circ Physiol 2011;302:H1202–H1210 [DOI] [PubMed]
- 26.Kuwahara H, Horie T, Ishikawa S, et al. Oxidative stress in skeletal muscle causes severe disturbance of exercise activity without muscle atrophy. Free Radic Biol Med 2010;48:1252–1262 [DOI] [PubMed] [Google Scholar]
- 27.Achike FI, To NH, Wang H, Kwan CY. Obesity, metabolic syndrome, adipocytes and vascular function: A holistic viewpoint. Clin Exp Pharmacol Physiol 2011;38:1–10 [DOI] [PubMed] [Google Scholar]
- 28.Bouloumie A, Marumo T, Lafontan M, Busse R. Leptin induces oxidative stress in human endothelial cells. FASEB J 1999;13:1231–1238 [PubMed] [Google Scholar]
- 29.Takaishi H, Taniguchi T, Takahashi A, Ishikawa Y, Yokoyama M. High glucose accelerates MCP-1 production via p38 MAPK in vascular endothelial cells. Biochem Biophys Res Commun 2003;305:122–128 [DOI] [PubMed] [Google Scholar]
- 30.Laude K, Cai H, Fink B, et al. Hemodynamic and biochemical adaptations to vascular smooth muscle overexpression of p22phox in mice. Am J Physiol Heart Circ Physiol 2005;288:H7–H12 [DOI] [PubMed] [Google Scholar]
- 31.Lob HE, Schultz D, Marvar PJ, Davisson RL, Harrison DG. Role of the NADPH oxidases in the subfornical organ in angiotensin II-induced hypertension. Hypertension 2013;61:382–387 [DOI] [PMC free article] [PubMed] [Google Scholar]
- 32.Wang G, Liem DA, Vondriska TM, et al. Nitric oxide donors protect murine myocardium against infarction via modulation of mitochondrial permeability transition. Am J Physiol Heart Circ Physiol 2005;288:H1290–H1295 [DOI] [PubMed] [Google Scholar]
- 33.Oak JH, Cai H. Attenuation of angiotensin II signaling recouples eNOS and inhibits nonendothelial NOX activity in diabetic mice. Diabetes 2007;56:118–126 [DOI] [PubMed] [Google Scholar]
- 34.Chalupsky K, Cai H. Endothelial dihydrofolate reductase: critical for nitric oxide bioavailability and role in angiotensin II uncoupling of endothelial nitric oxide synthase. Proc Natl Acad Sci U S A 2005;102:9056–9061 [DOI] [PMC free article] [PubMed]
- 35.Nguyen A, Cai H. Netrin-1 induces angiogenesis via a DCC-dependent ERK1/2-eNOS feed-forward mechanism. Proc Natl Acad Sci U S A 2006;103:6530–6535 [DOI] [PMC free article] [PubMed] [Google Scholar]
- 36.Gao L, Chalupsky K, Stefani E, Cai H. Mechanistic insights into folic acid-dependent vascular protection: dihydrofolate reductase (DHFR)-mediated reduction in oxidant stress in endothelial cells and angiotensin II-infused mice: a novel HPLC-based fluorescent assay for DHFR activity. J Mol Cell Cardiol 2009;47:752–760 [DOI] [PMC free article] [PubMed] [Google Scholar]
- 37.Gao L, Pung YF, Zhang J, et al. Sepiapterin reductase regulation of endothelial tetrahydrobiopterin and nitric oxide bioavailability. Am J Physiol Heart Circ Physiol 2009;297:H331–H339 [DOI] [PMC free article] [PubMed] [Google Scholar]
- 38.Zhang J, Cai H. Netrin-1 prevents ischemia/reperfusion-induced myocardial infarction via a DCC/ERK1/2/eNOS s1177/NO/DCC feed-forward mechanism. J Mol Cell Cardiol 2010;48:1060–1070 [DOI] [PMC free article] [PubMed] [Google Scholar]