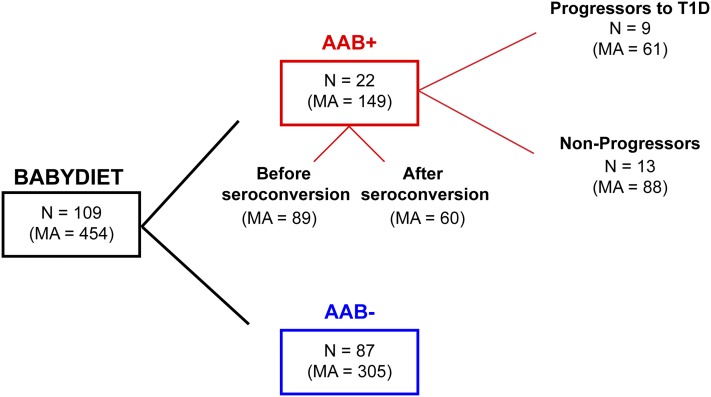
Figure 2.
Summary diagram of the BABYDIET cohort. The diagram represents the division of the 109 BABYDIET children and microarray samples according to seroconversion and progression to T1D. AAB, T1D-specific autoantibodies (see Research Design and Methods for details); MA, number of microarray measurements; N, number of individuals.

