

Abstract
Obesity-induced white adipose tissue (WAT) inflammation and insulin resistance are associated with macrophage (Mф) infiltration and phenotypic shift from “anti-inflammatory” M2-like to predominantly “proinflammatory” M1-like cells. Erythropoietin (EPO), a glycoprotein hormone indispensable for erythropoiesis, has biological activities that extend to nonerythroid tissues, including antiapoptotic and anti-inflammatory effects. Using comprehensive in vivo and in vitro analyses in mice, EPO treatment inhibited WAT inflammation, normalized insulin sensitivity, and reduced glucose intolerance. We investigated EPO receptor (EPO-R) expression in WAT and characterized the role of its signaling during obesity-induced inflammation. Remarkably, and prior to any detectable changes in body weight or composition, EPO treatment reduced M1-like Mф and increased M2-like Mф in WAT, while decreasing inflammatory monocytes. These anti-inflammatory effects were found to be driven, at least in part, by direct EPO-R response in Mф via Stat3 activation, where EPO effects on M2 but not M1 Mф required interleukin-4 receptor/Stat6. Using obese ∆EpoR mice with EPO-R restricted to erythroid cells, we demonstrated an anti-inflammatory role for endogenous EPO. Collectively, our findings identify EPO-R signaling as a novel regulator of WAT inflammation, extending its nonerythroid activity to encompass effects on both Mф infiltration and subset composition in WAT.
Introduction
Macrophage (Mф) infiltration to white adipose tissue (WAT) during obesity marks a state of chronic inflammation, an important cause of obesity-induced insulin resistance and glucose intolerance (1–4). This chronic inflammatory response impacts type 2 diabetes pathogenesis (1,4) and associates with a shift in Mф population from alternatively activated F4/80+MGL-1+ (anti-inflammatory) M2 to predominantly classically activated F4/80+MGL-1− (proinflammatory) M1 (5–8) in association with recruitment from circulating “inflammatory” Ly6ChiCCR2+ monocytes to Mф clusters in WAT via CCL2/CCR2 axis and not to the conversion of resident M2 Mф to M1 (1,3,5,6,8–10).
Mф infiltration and activation state influence inflammation-induced insulin resistance and glucose intolerance during diet-induced obesity (DIO) (11–13). It is suggested that Mф may be an initiator in insulin-resistant states and that, with their precursors, may contribute to propagation of insulin resistance (11–17). Mф infiltration to WAT requires and kinetically follows CD8+ T lymphocytes recruitment (18). Obesity-induced inflammation and immune cell infiltration elevate cytokines and chemokines such as tumor necrosis factor (TNF)-α and CCL2, systemically and locally in WAT, where cells of the stromal vascular fraction (SVF), including Mф, are known to be the main producers, particularly in visceral fat depots (1,3,4,19–21). Signaling of such inflammatory mediators is adversely implicated in the impairment of systemic glucose metabolism (1,5).
Erythropoietin (EPO) is a glycoprotein hormone induced by hypoxia and necessary for erythrocyte production (22–24). EPO is used for treatment of anemia in chronic kidney disease, including type 2 diabetic patients (25). Its biological activity extends beyond regulating erythropoiesis, and the nonerythroid expression of EPO receptor (EPO-R) has been reported (26–31). EPO was reported to reduce Mф infiltration and inhibit inflammation (32). Although, proposed to occur via antiapoptotic rather than “direct” anti-inflammatory effects on cells of the immune system (32), it can also occur directly via inhibiting Mф and/or activating immune suppressive lymphocytes (33,34).
Early treatment of mice with exogenous EPO at the onset of high-fat diet (HFD) feeding or EPO transgenic overexpression halts body weight and fat mass gain and improves glucose tolerance (35–38). Using ∆EpoR mice with EPO-R restricted to erythroid tissue (39), we previously showed EPO-R absence in WAT contributes directly to obesity and glucose intolerance on normal chow (36). EPO protects against diabetes through direct effects on pancreatic β-cells in mouse models of types 1 and 2 diabetes (36,37,40). It remains unknown whether anti-inflammatory EPO effects in WAT contribute to EPO effects on the prediabetic state during obesity.
In this study, we hypothesized that EPO/EPO-R signaling can attenuate obesity-induced WAT inflammation. Our findings identify a novel role for EPO in regulating inflammatory monocyte recruitment and Mф infiltration and activation during DIO.
Research Design and Methods
Animals and Animal Care
Wild-type (WT) male C57BL/6 mice were obtained from National Cancer Institute Animal Production Program (Frederick, MD). Mice with EPO-R expression restricted to hematopoietic tissue (∆EpoR) were provided by Masayuki Yamamoto (Tohoku University, Japan). EPO-R expression in ∆EpoR mice arises from transgene expression of EpoR cDNA driven by the erythroid specific enhancer/promoter of GATA-1 on C57BL/6 EpoR−/− background (29). Male Stat6−/− (Stat6tm1Gru) and interleukin (IL)-4−/− (ll4tm1Nnt) mice on C57BL/6 background and their age-matched WT controls were obtained from The Jackson Laboratory (JAX mice) (Bar Harbor, ME). Mice were fed control diet (10 kcal% fat) or, to induce DIO, HFD containing 60 kcal% fat (high fat, 5,240 kcal/kg, 34.9% crude fat; Research Diets Inc., New Brunswick, NJ) starting at 6–8 weeks of age for 12 weeks. During the last 2 weeks of the study period, obese, insulin-resistant, and glucose-intolerant mice were subcutaneously injected with 1,000 units/kg EPO (EPO dose was chosen based on our previous titration studies [35]) or saline as a vehicle control, every 48 h while continuing HFD feeding. At the end of week 12, the effects of 2 weeks EPO treatment on several metabolic and inflammatory parameters were assessed as described below. Animals were housed under specific pathogen-free conditions and maintained in a thermostated environment under a 12-h light/dark cycle with free access to food and water. All animal protocols were conducted under the National Institutes of Health guidelines and approved by the institute’s Animal Care and Use Committee.
Reagents and Antibodies
Reagents and antibodies include anti-F4/80 and anti-Ly6C antibodies (eBioscience); anti-MGL1/CD301 and anti-CCR2 (R&D Systems); Fc-block and anti-CD11c antibodies (BD Biosciences); rat anti-mouse Ki-67 antibody (BioLegend) used in combination with fluorescein isothiocyanate–conjugated goat anti-rat F(ab)2 (Santa Cruz Biotechnology Inc.); bromodeoxyuridine (BrdU; Sigma-Aldrich) and fluorescein isothiocyanate BrdU flow detection kit (BD Pharmingen); rabbit anti-mouse phospho (p)-Stat5 (Tyr694; C71E5) and p-Stat3 (Tyr705; D3A7) monoclonal antibodies (Cell Signaling Technology); mouse anti-mouse phopho-Stat6 (Tyr641; BD Biosciences); recombinant human Epoetin α or Epogen (EPO) (Amgen); Vectashield mounting media with DAPI (Vector Laboratories); and recombinant mouse cytokines GM-CSF, IL-4, and IL-10 (PeproTech).
Body Weight and Composition Measurements
Body weight was measured weekly from day 0 to week 12. Body composition analysis to determine fat and lean body mass was also performed using EchoMRI-100 system (Echo Medical Systems).
Hematocrit Measurement
Hematocrit was determined for saline- and EPO-treated animals after centrifugation of blood containing heparin coated capillary tubes, using VIN microcapillary tube reader (Veterinary Information Network Bookstore).
Metabolic Evaluation
Glucose tolerance tests (GTTs) were performed upon intraperitoneal injection with 1 g/kg dextrose. Insulin tolerance tests (ITTs) were performed after injection with 1 unit/kg insulin. Total blood and serum glucose measurements were made using AlphaTRAK glucometer (Abbott Animal Health). Serum insulin levels were measured using Sensitive Rat Insulin Radioimmunoassay (Millipore). Serum leptin levels were determined by ELISA (Millipore). Euglycemic–hyperinsulinemic clamp studies were performed in restrained mice fasted for 16 h as described previously (41).
SVF Cell Extraction
SVF cells were extracted as previously described (18). Briefly, perigonadal WAT were digested by collagenase type 2 (Worthington) at 37°C for 50 min. WAT cell suspensions were spun at 500g for 5 min to separate floating adipocytes from SVF pellet.
Gene Expression Analysis
Total RNA was extracted from cells or tissues using TRIzol (Invitrogen) and treated with DNase I (Fermentas) according to manufacturers’ protocols. Two micrograms of total RNA was then reverse transcribed using MultiScribe Reverse Transcriptase for quantitative real-time PCR (qRT-PCR) assays using ABI 7900HT cycler (Applied Biosystems). For EPO-R gene expression analysis, mRNA was quantified using TaqMan qRT-PCR, with 16S and β-actin as controls. Relative changes in gene expression levels of inflammatory cytokines, chemokines, and receptors, in SVF of epididymal adipose tissue, were analyzed using mouse inflammatory cytokines and receptors RT2 profiler PCR (SABiosciences, Qiagen). Briefly, cDNA was synthesized using RT2 first strand reaction, and PCR was performed using RT2 PCR master mix (SABiosciences, Qiagen). Four to six replicate 96-well plates were included per group; data analysis was performed using web-based PCR Array Data Analysis Software version 3.4 (SABiosciences, Qiagen). Changes in Mф subtype signature gene expression levels M1 (inducible nitric oxide synthase [iNOS] and IL-1β) and M2 (Fizz-1, Arg-1, peroxisome proliferator–activated receptor [Ppar]-γ) were assessed in SVF cells using sybergreen gene expression assays (Fermentas). Relative gene expression levels were determined by normalization to β-actin expression levels using the Δ–Δ Ct method. Primer and probe sequences used are listed in Supplementary Table 1.
WAT and Serum Cytokine and Chemokine Protein Measurements
CCL2 levels were analyzed in perigonadal WAT tissue and serum; those for TNF-α, IL-10, and IL-4 were analyzed in serum by ELISA according to the manufacturer’s protocol (PeproTech).
Cell Sorting and Purification
WAT Mф were sorted by separation of F4/80+ (Mф) and F4/80− (non-Mф) fractions of stromal vascular cells using FACSAria fluorescent cell sorter and FACSDiva software (BD Biosciences). Sorted WAT Mф were used for qRT-PCR analysis of EPO-R expression levels or cultured to assess Stat5, Stat3, and Stat6 phosphorylation.
EPO Treatment of Sorted WAT Mф In Vitro
WAT Mф, fluorescence-activated cell sorter (FACS) sorted from SVF of obese mice (after 12 weeks of HFD feeding) was cultured in saline or EPO (5 units/mL)-coated 48-well plates at a density of 2 × 10⁵ per well for 15 min then fixed, permeabilized, and tested for Stat3, Stat5a/b, and Stat6 phosphorylation by phosphoflow. Stimulation for 15 min with GM-CSF, IL-4, and IL-10 were used as positive controls for Stat5, Stat6, and Stat3 phosphorylation, respectively. In some studies, the sorted WAT Mф were cultured with EPO (5 units/mL) for 24 h, after which their TNF-α, iNOS, and IL-10 mRNA levels were quantified using sybergreen qRT-PCR.
Flow Cytometry and Phosphoflow
SVF of perigonadal WAT was analyzed by flow cytometry as previously described (8). Circulating inflammatory monocytes were quantified using Ly6C and CCR2 expression as previously described (42). Phosphoflow and staining for p-Stat3, p-Stat5a/b, and p-Stat6 were performed as previously described (43). Cell proliferation was assessed using Ki-67 detection and BrdU labeling. In vivo labeling with BrdU was achieved by supplementing drinking water with 0.8 mg/mL BrdU, starting 48 h prior to the first EPO injection during weeks 11 and 12 of HFD, for 9 consecutive days followed by a changeover to normal water until the end of week 12. FACSCalibur and CellQuest (BD Biosciences) were used for flow cytometric and phosphoflow analyses.
Histology and Microscopy
Frozen sections of perigonadal fat pads were prepared after dissection and fixation in 10% formalin. Hematoxylin and eosin (H&E)-stained sections were imaged for crown-like structures. Immunofluorescence was performed for Mф detection by incubation en block with directly conjugated primary anti-F4/80 antibodies. All imaging analyses were performed on OLYMPUS IX70 inverted microscope (Optical Elements Corporation). Image capture was performed using SPOTFlex camera and SPOT Basic imaging software (Diagnostic Instruments Inc.), using 15 sections per group (n = 5 mice per group).
Statistical Analysis
Statistical comparisons were performed using Student t test, with P values <0.05 defined as statistically significant. Results are presented as mean ± SEM.
Results
EPO Treatment Regimen Has No Effect on Body Weight or Fat Mass During DIO
EPO treatment of obese mice reduces body weight and fat mass after 3–4 weeks (35). Considering that body weight and fat mass changes influence WAT inflammation and Mф infiltration, affecting glucose tolerance and insulin sensitivity (1,2,44), we chose short-term EPO treatment regimen (<3 weeks) after obesity induction. Obese, insulin-resistant, glucose-intolerant mice, fed an HFD for 12 weeks, were EPO treated during the last 2 weeks of the study with no detectable effects on body weight, body weight gain, fat mass, perigonadal fat weight, or serum leptin levels (Fig. 1A–E). Consistent with previous reports (35), prolonged EPO administration (≥3 weeks) reduced body weight (Fig. 1F). All subsequent studies were conducted using the 2-week regimen of EPO treatment.
Figure 1.

A 2-week EPO treatment regimen does not affect body weight or fat mass. WT C57BL/6 male mice were fed an HFD for 12 weeks and treated with or without EPO (1,000 units/kg) for the final 2 weeks of the study. Lean mice + saline and obese mice + saline were used as negative and vehicle controls, respectively. Final body weight (A), body weight gain (B), fat mass (C), perigonadal fat mass (D), and serum leptin (E) were measured for all three groups at the end of week 12. F: WT C57BL/6 mice with obesity induced by HFD feeding for 13 weeks were treated with or without EPO (1,000 units/kg) every 48 h during the final 3 weeks of the study. Lean mice + saline were used as negative controls. Results are shown as mean ± SEM for n = 8 mice per group, representative of three independent experiments with similar results. *P < 0.05.
EPO Treatment Attenuates Insulin Resistance and Glucose Intolerance During DIO
We investigated whether EPO treatment can ameliorate existent systemic insulin resistance and glucose intolerance associated with DIO using ITT and GTT. EPO improved both (Fig. 2A and B), with striking reduction in fasting blood glucose levels (Fig. 2C) and impressive effects on glucose tolerance (Fig. 2B). EPO increased hematocrit (Fig. 2D); however, serum glucose (Fig. 2E) and serum insulin (Fig. 2F) were also reduced, showing that total blood glucose reduction is not the result of increased packed red cell volume. To examine insulin sensitivity of individual tissues, we performed euglycemic–hyperinsulinemic clamp studies. EPO-treated mice required higher glucose infusion rate (GIR) to maintain blood glucose during insulin infusion and exhibited higher whole body glucose disposal and glycogen synthesis rate compared with controls (Fig. 2G and H). Although these differences have not reached statistical significance, EPO significantly increased 2-deoxyglucose uptake in skeletal muscle but not WAT, brown adipose tissue, or heart (Fig. 2I and J). EPO had no effect on basal or clamp endogenous glucose production (Fig. 2H), suggesting no changes in liver insulin sensitivity. Taken together, these data demonstrate that EPO treatment, which had no effect on body weight, improved whole body insulin sensitivity primarily by enhancing glucose uptake in the skeletal muscles.
Figure 2.

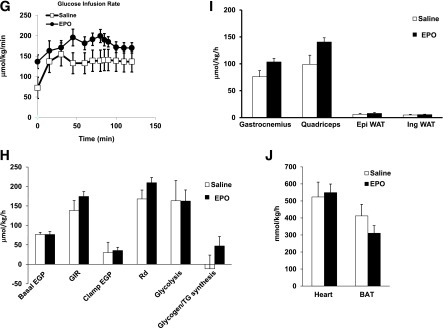
EPO treatment attenuates insulin resistance and glucose intolerance during DIO. WT C57BL/6 mice with obesity induced by HFD feeding for 12 weeks were treated with or without EPO (1,000 units/kg) every 48 h during the final 2 weeks of the study. Lean mice + saline were used as negative controls. A: For ITT, glucose levels were measured after intraperitoneal injection of 1 unit/kg insulin. B: For GTT, glucose levels were measured after intraperitoneal injection of 1 g/kg glucose. Fasting glucose levels (C), percentage hematocrit (D), serum glucose levels (E), and serum insulin levels (F) were measured. All measurements were performed at the end of week 12. Euglycemic–hyperinsulinemic clamps were performed in DIO mice fasted overnight after 2 weeks of EPO treatment (n = 5–8/group). G: GIR. H: Whole-body glucose fluxes, GIR, endogenous glucose production, and glucose disposal. I and J: Tissue 2-deoxyglucose update measured during clamp. Clamp plasma glucose levels were 209 + 39 and 157 + 13 mg/dL in saline- and EPO-treated mice, respectively. Clamp plasma insulin levels were 6.6 + 2.3 ng/mL in saline-treated mice and 5.8 + 0.8 ng/mL EPO-treated mice. Results are shown as mean ± SEM for n = 8 mice per group, representative of three independent experiments with similar results. *P < 0.05. BAT, brown adipose tissue; EGP, endogenous glucose production; Epi, epididymal; Ing, inguinal; Rd, glucose disposal.
EPO Treatment Inhibits WAT Inflammation and Reduces Mф Infiltration
Unlike WAT with high EPO-R expression in both adipocytes and SVF, EPO-R is not detectable in skeletal muscle (Fig. 3A and B), indicating that EPO indirectly stimulates glucose uptake in skeletal muscle. Although EPO had no effect on WAT insulin sensitivity, we noticed that it dramatically improved inflammation within adipose tissue, as indicated by the lack of crown structure around adipocytes in EPO-treated mice (Fig. 3C and D). This novel observation prompted us to study the role of EPO signaling in obesity-induced inflammation. We performed comprehensive gene expression profiling of cytokines and chemokines in SVF. EPO reduced Ccl1, Ccl2, Ccl3, and Ccl22 expression levels but not IL-10 (Fig. 3E). Protein analysis showed that EPO treatment reduced TNF-α—consistent with the role of TNF-α during obesity-induced insulin resistance (45)—increased IL-10 (Fig. 3F), and downregulated CCL1, CCL2, CCL3, and CCL22 levels (data not shown).
Figure 3.


EPO-R expression profiles and the effects of EPO treatment on WAT inflammation and Mф infiltration. A: EPO-R expression in skeletal muscle, liver, and WAT of WT mice on normal chow (lean) was assessed using splenocytes and ∆EpoR WAT as positive and negative controls, respectively. B: EPO-R expression in adipocytes and SVF was assessed in lean versus obese mice. Representative H&E-stained sections from perigonadal adipose tissue (C) and immunofluorescent staining of perigonadal WAT sections for Mф (F4/80-red) and nuclei (DAPI-blue) (D) are shown; similar results are seen in 12 independent samples. E: Expression of inflammatory cytokine and chemokine genes in WAT from perigonadal fat was analyzed by qRT-PCR; expression levels are normalized to β-actin, and fold change in expression are relative to negative control lean + saline. F: Serum TNF-α and IL-10 levels were determined for each group (n = 5 mice per group). G: Comparison of EPO-R levels in Mф (F4/80+) and non-Mф (F4/80−) fractions, sorted by FACS, from stromal vascular cells of lean and obese WAT. Flow cytometry analysis of F4/80 expression in SVF cells of perigonadal WAT depicting total Mф percentage (H) and number per gram of perigonadal WAT (I) are shown. J: EPO-R expression levels in SVF of lean and obese mice treated with and without EPO were determined by qRT-PCR. Expression levels were normalized to β-actin. Data are mean ± SEM for n = 5 mice per group, representative of three independent experiments with similar results. *P < 0.05; **P < 0.01.
Mф are responsible for the majority of EPO-R expression in SVF (Fig. 3G), and EPO treatment reduced total Mф percentage and number by ∼11.2 and ∼30%, respectively (Fig. 3H and I), supporting an inhibitory effect for EPO on WAT inflammation. Mф are the main responders in SVF, as T-cell and B-cell percentage showed no detectable changes after EPO treatment (Supplementary Table 2). Consistent with results showing Mф as predominant EPO-R expressing cells in SVF (Fig. 3G), EPO-treated animals exhibited reduced Mф infiltration associated with decreased EPO-R expression in WAT (Fig. 3J), providing a further link between WAT Mф and EPO/EPO-R response.
EPO/EPO-R Signaling Induces Stat3 Phosphorylation in Mф and Inhibits Their Inflammatory Response In Vitro
To investigate EPO/EPO-R signaling in WAT Mф and its direct effects on their inflammatory responses, Mф sorted from obese SVF were cultured in EPO-coated plates for 15 min, fixed, and analyzed by phosphoflow. Although p-Stat5 and p-Stat6 were not detected in WT Mф upon EPO treatment (Fig. 4A), EPO induced Stat3 phosphorylation (Fig. 4B). These findings were further confirmed by Western blotting (data not shown). EPO-R absence in ∆EpoR Mф prevented their response to EPO as shown by the absence of p-Stat3 (Fig. 4B, top right) compared with WT (Fig. 4B, top left). Moreover, treatment of WAT Mф with EPO (5 units/mL) for 24 h reduced proinflammatory genes expression of TNF-α and iNOS and markedly increased anti-inflammatory cytokine IL-10 expression (Fig. 4C and D), collectively confirming a direct response by WAT Mф to EPO/EPO-R signaling.
Figure 4.

EPO/EPO-R signaling induces Stat3 phosphorylation in Mф and inhibits their inflammatory response in vitro. WAT Mф, purified by FACS from obese mice SVF (after 12 weeks of HFD feeding), were cultured with saline or EPO (5 units/mL) for phosphoflow analysis. Histogram plots of Mф phosphoflow results for p-Stat5a/b (A) and p-Stat3 and p-Stat6 in WT (left two panels) and ∆EpoR (right two panels) (B). In some experiments, Mф sorted from SVF of obese WT mice were cultured with EPO (5 units/mL) for 24 h, after which their TNF-α and iNOS (C) and IL-10 (D) mRNA levels were quantified. Data represent observations from three independent experiments with similar results plotted as mean ± SEM for n = 4 per group. *P < 0.05.
EPO Treatment Reverses Obesity-Induced Shift in Mф Population Subtypes
The effect of EPO administration on Mф population subtypes in WAT was examined. Using flow cytometry, EPO decreased MGL-1− and CD11c+ while increasing MGL-1+ Mф (Fig. 5A and B). qRT-PCR confirmed phenotypic Mф shift (Fig. 5C and D), showing that EPO reduced iNOS and Il-1β and increased Fizz-1, Ppar-γ, and Arg-1. Overall, EPO increased M2-like Mф and reduced M1-like Mф numbers, thus identifying and confirming its role in the regulation of not only Mф infiltration, but also local subtype polarization. Whether or not the conversion of M1- to M2-like Mф, as recently suggested (46), contributes to the observed EPO-mediated increase in MGL-1+ Mф remains unknown. Since M1/M2 nomenclature of Mф is based on in vitro studies, and may not represent in vivo Mф subtypes (17), we use the designation M1- and M2-like Mф to describe F4/80+MGL-1− and MGL-1+ cells, respectively.
Figure 5.

EPO treatment regulates Mф subtype composition in WAT. SVF cells from perigonadal fat were used for flow cytometry and analyses. Dot plots depict flow cytometry analysis of MGL-1+, MGL-1−, and CD11c+ Mф subsets (A), and their numbers per gram of WAT are shown (B). Expression levels of iNOS and IL-1β (C) and Arg-1, Fizz-1, and Ppar-γ (D) relative to β-actin were assessed. Results are shown as mean ± SEM for n = 5 mice per group, representative of three independent experiments with similar results. *P < 0.05; **P < 0.01.
Cellular Responses Drive EPO-Mediated Reversal of Mф Subtype Shift
M1 Mф infiltrating the WAT during DIO originate from circulating Ly6ChiCCR2+ inflammatory monocytes in a CCL2/CCR2-dependent manner (5,6,8). EPO lowers Ccl2 expression levels in WAT (Fig. 3C). We predicted EPO-mediated reduction of M1-like Mф subset (Fig. 5A and B) to be associated with fewer circulating Ly6ChiCCR2+ monocytes and reduced local WAT and serum CCL2 levels. This was confirmed by flow cytometric analysis of whole blood (Fig. 6A and B) and measurement of local WAT and serum CCL2 protein levels (Fig. 6C).
Figure 6.

EPO treatment decreases circulating inflammatory monocytes and promotes WAT M2-like Mф expansion. Dot plots for flow cytometry analysis of circulating blood inflammatory monocytes Ly6ChiCCR2+ (A) and their numbers per milliliter of blood (B) are shown, as well as CCL2 levels in serum and perigonadal WAT lysates (C). D: Flow cytometry results depict the percentage of proliferating MGL-1− versus MGL-1+ Mф in perigonadal SVF, based on Ki-67 staining (left) and BrdU uptake (right). E: Serum and WAT IL-4 levels are shown. F: Numbers of total Mф (bar) and MGL-1+ (top, black) and MGL-1− (bottom, gray) Mф subsets per gram of perigonadal WAT from WT, Stat6−/−, and IL-4−/− mice are shown. Results are presented as mean ± SEM for n = 4–6 mice per group, representative of two or three independent experiments with similar results. *P < 0.05; **P < 0.01.
M2 Mф have been suggested to self-generate via proliferation in the presence of IL-4 in vivo (46,47). To study how the observed EPO-mediated expansion of M2-like Mф may occur (Fig. 5), quantitative comparisons of EPO- and saline-treated obese animals were performed. Ki-67 staining and BrdU uptake showed that EPO promotes MGL-1+ Mф proliferation (Fig. 6D) in association with an increase in serum and WAT IL-4 (Fig. 6E). We confirmed this in obese Stat6−/− and IL-4−/− mice, reported previously to have defective M2-like Mф (48–50). EPO treatment failed to expand M2-like Mф in these animals (Fig. 6F) unlike controls (Figs. 5B and 6F). These findings highlight a previously unrecognized role for EPO/EPO-R in the regulation of Mф polarization in vivo, where IL-4/Stat6 axis is indispensable for EPO-mediated M2-like Mф expansion.
Endogenous EPO/EPO-R Signaling Regulates Mф Infiltration and Subtype Shift
To investigate the role of endogenous EPO/EPO-R signaling during obesity-induced WAT inflammation, we used DIO in ∆EpoR mice (39). The absence of EPO-R expression in ∆EpoR WAT (adipocytes and SVF) and Mф were confirmed (Figs. 3B and 7A). ∆EpoR mice maintained on normal chow become obese and glucose intolerant as they age (36). Baseline measurements prior to the onset of HFD feeding showed ∆EpoR mice (6–8 weeks old) to have slightly higher body weight and fat mass compared with age-matched WT controls (Fig. 7B). However, after 12 weeks of HFD feeding, there was no significant difference in final body weight or fat mass between ∆EpoR and their age-matched WT controls (Fig. 7B).
Figure 7.


Endogenous EPO/EPO-R signaling regulates WAT Mф infiltration and subtype shift. WT C57BL/6 and age-matched ∆EpoR male mice with obesity induced by HFD feeding for 12 weeks were used. A: EPO-R expression levels were determined in SVF relative to β-actin. Shown are body weight and fat mass before and after DIO (B) and EPO-R expression analysis by qRT-PCR in different immune cell subsets (C) from spleens in which Mф were FACS-purified based on F4/80 expression and dendritic cells, B-cells, and T-cells that were purified by magnetic activated cell sorting through positive selection of CD11c+ (dendritic cells), CD19+ (B-cells), and CD3+ (T-cells) cells. Shown are percentage and numbers of circulating blood inflammatory monocytes (D); cytokine and chemokine gene expression profile of perigonadal SVF (E); protein levels of TNF-α, IL-10, and CCL2 (F); percentage and numbers of total Mф (G); and representative H&E-stained histology sections of perigonadal WAT (H). MGL-1+, MGL-1−, and CD11c+ Mф subset percentages (dot plots) and numbers per gram of perigonadal fat tissue (I), gene expression determined relative to β-actin (J), and serum and WAT IL-4 levels (K) are shown. Results are mean ± SEM for n = 5 mice per group, representative of three independent experiments with similar results. *P < 0.05; **P < 0.01 WT vs. ∆EpoR. DC, dendritic cells.
Mф express the highest level of EPO-R mRNA among immune cell subsets profiled here (Fig. 7C) and are the only EPO responsive population of immune cells in WT animals (Supplementary Table 2). ∆EpoR animals with DIO showed higher circulating inflammatory monocyte numbers (Fig. 7D), suggesting a possible direct role for endogenous EPO/EPO-R signaling in the regulation of WAT inflammation independently of its effect on body weight and fat mass. ∆EpoR SVF cell chemokine and cytokine expression profiles showed elevated levels of Ccl1, Ccl2, Ccl12, Ccl17, Ccl19, Ccl22, Cxcl10, and Cxcl11, with unchanged Ccl3, TNF-α, and IL-10 (Fig. 7E). Protein profiling confirmed the upregulation of these chemokines, including CCL3 (data not shown). Despite unchanged TNF-α and IL-10 mRNA levels, we found higher TNF-α and similar IL-10 protein levels in ∆EpoR animals (Fig. 7F).
CCL2 levels in ∆EpoR exceeded those in WT controls (Fig. 7F), where the difference in local WAT CCL2, but not serum, was significant (P ≤ 0.05). Flow cytometry and histology showed increased total Mф, denser inflammatory infiltrates and crown-like–structure formation, and more MGL-1− Mф and fewer MGL-1+ Mф in WAT (Fig. 7G–I). The latter was confirmed via qRT-PCR (Fig. 7J). Despite reduced M2-like Mф numbers in WAT of ∆EpoR (Fig. 7I), serum and WAT IL-4 levels were not lower than WT controls (Fig. 7K). Based on Ki-67 staining the percentage of proliferating MGL-1+ cells in ∆EpoR SVF was lower than their WT counterparts (data not shown).
Endogenous EPO/EPO-R Signaling Regulates Obesity-Induced Insulin Resistance and Glucose Intolerance
To investigate the role of endogenous EPO/EPO-R signaling in regulating glucose metabolism, we compared WT with ∆EpoR mice after 12 weeks of HFD feeding. ∆EpoR mice showed higher insulin resistance, glucose intolerance, fasting blood glucose, and serum insulin (Fig. 8A–D). ∆EpoR mice maintained high insulin resistance after 2 weeks of EPO administration (Fig. 8E and F), and there was no change in the area under the curve and no significant difference in glucose intolerance after EPO treatment (Fig. 8G). Not surprisingly, Mф infiltration and subtype composition in WAT of ∆EpoR mice remained similar after EPO administration (Fig. 8H).
Figure 8.

Endogenous EPO/EPO-R signaling and glucose metabolism during DIO. A: For ITT, glucose levels were measured after intraperitoneal injection of 1 unit/kg insulin. B: For GTT, glucose levels were measured after intraperitoneal injection of 1 g/kg glucose. Fasting glucose (C) and serum insulin (D) levels were determined. ∆EpoR mice with DIO, induced by 12 weeks of HFD feeding, were injected subcutaneously with saline or EPO (1,000 units/kg) every 48 h for the final 2 weeks of HFD feeding, and hematocrit (E), ITT (F), GTT (G), and flow cytometry analysis of perigonadal fat SVF cells (H) were determined. All measurements were performed at the end of week 12. Data presented as mean ± SEM for n = 8 mice per group, representative of three independent experiments with similar results. *P < 0.05.
Discussion
Herein, we characterized the role of EPO/EPO-R during obesity-induced WAT inflammation and insulin resistance. Our observations reveal novel and unexpected role for EPO/EPO-R in regulating M1-like Mф infiltration, M2-like Mф expansion in WAT, and inflammatory monocyte recruitment (Figs. 3 and 5–7) prior to any body weight or fat mass loss (Fig. 1). We propose that the anti-inflammatory effects of EPO in WAT occur in association with its regulation of systemic glucose metabolism and that it is not restricted to exogenous high-dose EPO treatment, as endogenous EPO is sufficient to regulate WAT inflammation.
We and others have reported the reduction in blood glucose with high-dose EPO treatment and transgenic overexpression using mouse models of DIO and insulin resistance (35–38). The improved glucose metabolism is associated with reduced body weight gain and fat mass accumulation, where EPO administration was initiated at the onset of HFD feeding and continued for 3 weeks or longer (35–37). In stark contrast, herein, EPO administration was initiated after DIO, and its associated insulin resistance and glucose intolerance have already been established and followed a 2-week duration regimen. We report improvements in glucose metabolism that precede any detectable reduction in body weight or fat mass (Fig. 1), suggesting the EPO-mediated effects observed here are independent from the role in body weight and fat mass regulation.
The shift to increased fat oxidation in muscle has been shown to contribute to the observed normalization of glucose sensitivity with EPO (38). These studies are consistent with our finding that EPO increased glucose uptake in skeletal muscle. Moreover, EPO was shown to protect against diabetes through direct effects on pancreatic β-cells in mouse models of types 1 and 2 diabetes not including DIO (36,37,40).
Herein, anti-inflammatory effect of EPO is identified and its signaling in Mф and effect on their activation and infiltration are characterized. Indeed, it is known that obesity-induced WAT inflammation is linked to increased systemic inflammation and insulin resistance (1–4). We demonstrate that EPO/EPO-R signaling in WAT Mф promotes Stat3 phosphorylation with clear anti-inflammatory effects (Fig. 4B and C), confirming a direct role in the regulation of Mф response. Interestingly, Stat3 phosphorylation does not appear to be sufficient, in the absence of Stat6, to mediate EPO/EPO-R signaling effect on M2-like Mф, as EPO treatment failed to expand this Mф subset in WAT of obese Stat6−/− mice (Fig. 6F), demonstrating a requirement for IL-4/Stat6 axis during EPO-mediated M2-like Mф expansion. In contrast, EPO treatment markedly reduced total and M1-like WAT Mф populations in obese Stat6−/− mice and IL-4−/− mice (Fig. 6F), indicating that EPO/EPO-R/p-Stat3 axis may be sufficient to inhibit the proinflammatory response. Collectively, we conclude that both direct (Fig. 4B and C) and indirect via IL-4/Stat6 (Fig. 6F) responses of WAT Mф to EPO/EPO-R are involved in mediating the observed anti-inflammatory effects (Figs. 3 and 5–7).
Considering our observations that Mф are EPO responsive, we propose that a direct contribution of their EPO/EPO-R signaling plays a major role in the inhibition of obesity-induced WAT inflammation. However, involvement of indirect EPO/EPO-R signaling in adipocytes on obesity-induced WAT inflammation cannot be entirely excluded, and its further investigation is required. Since EPO/EPO-R signaling appears to regulate TNF-α levels (Figs. 3 and 7), the change in TNF-α may be linked to EPO effects on insulin resistance and glucose intolerance (Figs. 2 and 8). The exact molecular networks driving this link, such as the role of JAK/STAT pathway and Akt activation downstream of EPO-R signaling, including the possibility of insulin sensitivity regulation by directly affecting signaling downstream of insulin receptor, require further studies.
Antiapoptotic and tissue-protective activities have been suggested to drive the anti-inflammatory effects of EPO indirectly rather than via direct modulation of immune cell function/response (32). Evidence in support of direct EPO effects on immune cells also exists (33,34). To this end, we found Mф to display the highest level of EPO-R expression among SVF cells of WAT (Fig. 3E) and among other immune cell subsets (Fig. 7C). Moreover, the percentage of Mф appeared to be the only responder to EPO treatment among SVF leukocytes (Supplementary Table 2), and EPO/EPO-R signaling in Mф was found to directly regulate their response, in agreement with the recently reported anti-inflammatory role of EPO/EPO-R signaling during bacterial infection and experimental colitis (33).
In summary, our studies demonstrate the involvement of EPO/EPO-R signaling in the reversal of insulin resistance and glucose intolerance; uncouple its role in obesity, body weight, and fat mass regulation from its effect on inflammation; and collectively identify and characterize the anti-inflammatory effects of EPO. We reveal a previously unrecognized role for EPO in the expansion of M2-like Mф population via IL-4/Stat6 axis and for Stat3 activation in the anti-inflammatory effects of EPO-R in WAT Mф. These findings highlight a novel EPO/EPO-R signaling-mediated regulation pathway of WAT inflammation in prediabetic condition, thus adding to its reported “anti-diabetic” effects shown to act via cytoprotection of pancreatic islet β-cells (40) or muscle fat oxidation (38) in experimental models of diabetes.
Article Information
Acknowledgments. The authors thank William Jou at the National Institute of Diabetes and Digestive and Kidney Diseases Intramural Program Mouse Metabolism Core Facility for his excellent technical assistance with metabolic studies.
Funding. This work was supported by the Intramural Research Program of the National Institute of Diabetes and Digestive and Kidney Diseases and the National Institutes of Health.
Duality of Interest. No potential conflicts of interest relevant to this article were reported.
Author Contributions. M.A. designed experiments, conducted the studies, analyzed the data, and wrote the manuscript. B.M.R., O.G., R.T., and T.C. contributed to data generation and analysis and reviewed and edited the manuscript. C.T.N. contributed to experiment design and data discussion and reviewed and edited the manuscript. M.A. is the guarantor of this work and, as such, had full access to all the data in the study and takes responsibility for the integrity of the data and the accuracy of the data analysis.
Footnotes
This article contains Supplementary Data online at http://diabetes.diabetesjournals.org/lookup/suppl/doi:10.2337/db13-0883/-/DC1.
M.A. is currently affiliated with the Department of Biological Sciences, Ohio University, Zanesville, OH, and the Diabetes Institute at Ohio University, Athens, OH.
See accompanying article, p. 2229.
References
- 1.Olefsky JM, Glass CK. Macrophages, inflammation, and insulin resistance. Annu Rev Physiol 2010;72:219–246 [DOI] [PubMed] [Google Scholar]
- 2.Zeyda M, Stulnig TM. Obesity, inflammation, and insulin resistance—a mini-review. Gerontology 2009;55:379–386 [DOI] [PubMed] [Google Scholar]
- 3.de Luca C, Olefsky JM. Inflammation and insulin resistance. FEBS Lett 2008;582:97–105 [DOI] [PMC free article] [PubMed] [Google Scholar]
- 4.Lumeng CN, Saltiel AR. Inflammatory links between obesity and metabolic disease. J Clin Invest 2011;121:2111–2117 [DOI] [PMC free article] [PubMed] [Google Scholar]
- 5.Lumeng CN, Bodzin JL, Saltiel AR. Obesity induces a phenotypic switch in adipose tissue macrophage polarization. J Clin Invest 2007;117:175–184 [DOI] [PMC free article] [PubMed] [Google Scholar]
- 6.Lumeng CN, Deyoung SM, Bodzin JL, Saltiel AR. Increased inflammatory properties of adipose tissue macrophages recruited during diet-induced obesity. Diabetes 2007;56:16–23 [DOI] [PubMed] [Google Scholar]
- 7.Wentworth JM, Naselli G, Brown WA, et al. Pro-inflammatory CD11c+CD206+ adipose tissue macrophages are associated with insulin resistance in human obesity. Diabetes 2010;59:1648–1656 [DOI] [PMC free article] [PubMed] [Google Scholar]
- 8.Lumeng CN, DelProposto JB, Westcott DJ, Saltiel AR. Phenotypic switching of adipose tissue macrophages with obesity is generated by spatiotemporal differences in macrophage subtypes. Diabetes 2008;57:3239–3246 [DOI] [PMC free article] [PubMed] [Google Scholar]
- 9.Kanda H, Tateya S, Tamori Y, et al. MCP-1 contributes to macrophage infiltration into adipose tissue, insulin resistance, and hepatic steatosis in obesity. J Clin Invest 2006;116:1494–1505 [DOI] [PMC free article] [PubMed] [Google Scholar]
- 10.Kamei N, Tobe K, Suzuki R, et al. Overexpression of monocyte chemoattractant protein-1 in adipose tissues causes macrophage recruitment and insulin resistance. J Biol Chem 2006;281:26602–26614 [DOI] [PubMed] [Google Scholar]
- 11.Arkan MC, Hevener AL, Greten FR, et al. IKK-beta links inflammation to obesity-induced insulin resistance. Nat Med 2005;11:191–198 [DOI] [PubMed] [Google Scholar]
- 12.Odegaard JI, Ricardo-Gonzalez RR, Goforth MH, et al. Macrophage-specific PPARgamma controls alternative activation and improves insulin resistance. Nature 2007;447:1116–1120 [DOI] [PMC free article] [PubMed] [Google Scholar]
- 13.Hevener AL, Olefsky JM, Reichart D, et al. Macrophage PPAR gamma is required for normal skeletal muscle and hepatic insulin sensitivity and full antidiabetic effects of thiazolidinediones. J Clin Invest 2007;117:1658–1669 [DOI] [PMC free article] [PubMed] [Google Scholar]
- 14.Mauer J, Chaurasia B, Plum L, et al. Myeloid cell-restricted insulin receptor deficiency protects against obesity-induced inflammation and systemic insulin resistance. PLoS Genet 2010;6:e1000938. [DOI] [PMC free article] [PubMed] [Google Scholar]
- 15.Kiefer FW, Zeyda M, Gollinger K, et al. Neutralization of osteopontin inhibits obesity-induced inflammation and insulin resistance. Diabetes 2010;59:935–946 [DOI] [PMC free article] [PubMed] [Google Scholar]
- 16.Féral CC, Neels JG, Kummer C, Slepak M, Olefsky JM, Ginsberg MH. Blockade of alpha4 integrin signaling ameliorates the metabolic consequences of high-fat diet-induced obesity. Diabetes 2008;57:1842–1851 [DOI] [PMC free article] [PubMed] [Google Scholar]
- 17.Westcott DJ, Delproposto JB, Geletka LM, et al. MGL1 promotes adipose tissue inflammation and insulin resistance by regulating 7/4hi monocytes in obesity. J Exp Med 2009;206:3143–3156 [DOI] [PMC free article] [PubMed] [Google Scholar]
- 18.Nishimura S, Manabe I, Nagasaki M, et al. CD8+ effector T cells contribute to macrophage recruitment and adipose tissue inflammation in obesity. Nat Med 2009;15:914–920 [DOI] [PubMed] [Google Scholar]
- 19.Hotamisligil GS, Arner P, Caro JF, Atkinson RL, Spiegelman BM. Increased adipose tissue expression of tumor necrosis factor-α in human obesity and insulin resistance. J Clin Invest 1995;95:2409–2415 [DOI] [PMC free article] [PubMed] [Google Scholar]
- 20.Heilbronn LK, Campbell LV. Adipose tissue macrophages, low grade inflammation and insulin resistance in human obesity. Curr Pharm Des 2008;14:1225–1230 [DOI] [PubMed] [Google Scholar]
- 21.Weisberg SP, McCann D, Desai M, Rosenbaum M, Leibel RL, Ferrante AW., Jr Obesity is associated with macrophage accumulation in adipose tissue. J Clin Invest 2003;112:1796–1808 [DOI] [PMC free article] [PubMed] [Google Scholar]
- 22.Ebert BL, Bunn HF. Regulation of the erythropoietin gene. Blood 1999;94:1864–1877 [PubMed] [Google Scholar]
- 23.Semenza GL, Wang GL. A nuclear factor induced by hypoxia via de novo protein synthesis binds to the human erythropoietin gene enhancer at a site required for transcriptional activation. Mol Cell Biol 1992;12:5447–5454 [DOI] [PMC free article] [PubMed] [Google Scholar]
- 24.Semenza GL. Involvement of oxygen-sensing pathways in physiologic and pathologic erythropoiesis. Blood 2009;114:2015–2019 [DOI] [PubMed] [Google Scholar]
- 25.Sohmiya M, Kakiba T, Kato Y. Therapeutic use of continuous subcutaneous infusion of recombinant human erythropoietin in malnourished predialysis anemic patients with diabetic nephropathy. Eur J Endocrinol 1998;139:367–370 [DOI] [PubMed] [Google Scholar]
- 26.Noguchi CT, Wang L, Rogers HM, Teng R, Jia Y. Survival and proliferative roles of erythropoietin beyond the erythroid lineage. Expert Rev Mol Med 2008;10:e36. [DOI] [PMC free article] [PubMed] [Google Scholar]
- 27.Kertesz N, Wu J, Chen TH, Sucov HM, Wu H. The role of erythropoietin in regulating angiogenesis. Dev Biol 2004;276:101–110 [DOI] [PubMed] [Google Scholar]
- 28.Wu H, Lee SH, Gao J, Liu X, Iruela-Arispe ML. Inactivation of erythropoietin leads to defects in cardiac morphogenesis. Development 1999;126:3597–3605 [DOI] [PubMed] [Google Scholar]
- 29.Yu X, Shacka JJ, Eells JB, et al. Erythropoietin receptor signalling is required for normal brain development. Development 2002;129:505–516 [DOI] [PubMed] [Google Scholar]
- 30.Ueda K, Takano H, Niitsuma Y, et al. Sonic hedgehog is a critical mediator of erythropoietin-induced cardiac protection in mice. J Clin Invest 2010;120:2016–2029 [DOI] [PMC free article] [PubMed] [Google Scholar]
- 31.Bernaudin M, Marti HH, Roussel S, et al. A potential role for erythropoietin in focal permanent cerebral ischemia in mice. J Cereb Blood Flow Metab 1999;19:643–651 [DOI] [PubMed] [Google Scholar]
- 32.Villa P, Bigini P, Mennini T, et al. Erythropoietin selectively attenuates cytokine production and inflammation in cerebral ischemia by targeting neuronal apoptosis. J Exp Med 2003;198:971–975 [DOI] [PMC free article] [PubMed] [Google Scholar]
- 33.Nairz M, Schroll A, Moschen AR, et al. Erythropoietin contrastingly affects bacterial infection and experimental colitis by inhibiting nuclear factor-κB-inducible immune pathways. Immunity 2011;34:61–74 [DOI] [PMC free article] [PubMed] [Google Scholar]
- 34.Yuan R, Maeda Y, Li W, Lu W, Cook S, Dowling P. Erythropoietin: a potent inducer of peripheral immuno/inflammatory modulation in autoimmune EAE. PLoS One 2008;3:e1924 [DOI] [PMC free article] [PubMed]
- 35.Foskett A, Alnaeeli M, Wang L, Teng R, Noguchi CT. The effects of erythropoietin dose titration during high-fat diet-induced obesity. J Biomed Biotechnol 2011;2011:373781 [DOI] [PMC free article] [PubMed]
- 36.Teng R, Gavrilova O, Suzuki N, et al. Disrupted erythropoietin signalling promotes obesity and alters hypothalamus proopiomelanocortin production. Nat Commun 2011;2:520 [DOI] [PMC free article] [PubMed]
- 37.Katz O, Stuible M, Golishevski N, et al. Erythropoietin treatment leads to reduced blood glucose levels and body mass: insights from murine models. J Endocrinol 2010;205:87–95 [DOI] [PubMed] [Google Scholar]
- 38.Hojman P, Brolin C, Gissel H, et al. Erythropoietin over-expression protects against diet-induced obesity in mice through increased fat oxidation in muscles. PLoS ONE 2009;4:e5894. [DOI] [PMC free article] [PubMed] [Google Scholar]
- 39.Suzuki N, Ohneda O, Takahashi S, et al. Erythroid-specific expression of the erythropoietin receptor rescued its null mutant mice from lethality. Blood 2002;100:2279–2288 [DOI] [PubMed] [Google Scholar]
- 40.Choi D, Schroer SA, Lu SY, et al. Erythropoietin protects against diabetes through direct effects on pancreatic beta cells. J Exp Med 2010;207:2831–2842 [DOI] [PMC free article] [PubMed] [Google Scholar]
- 41.Wang R-H, Kim H-S, Xiao C, Xu X, Gavrilova O, Deng CX. Hepatic Sirt1 deficiency in mice impairs mTorc2/Akt signaling and results in hyperglycemia, oxidative damage, and insulin resistance. J Clin Invest 2011;121:4477–4490 [DOI] [PMC free article] [PubMed] [Google Scholar]
- 42.King IL, Dickendesher TL, Segal BM. Circulating Ly-6C+ myeloid precursors migrate to the CNS and play a pathogenic role during autoimmune demyelinating disease. Blood 2009;113:3190–3197 [DOI] [PMC free article] [PubMed] [Google Scholar]
- 43.Krutzik PO, Nolan GP. Intracellular phospho-protein staining techniques for flow cytometry: monitoring single cell signaling events. Cytometry A 2003;55:61–70 [DOI] [PubMed] [Google Scholar]
- 44.Kosteli A, Sugaru E, Haemmerle G, et al. Weight loss and lipolysis promote a dynamic immune response in murine adipose tissue. J Clin Invest 2010;120:3466–3479 [DOI] [PMC free article] [PubMed] [Google Scholar]
- 45.Shoelson SE, Lee J, Goldfine AB. Inflammation and insulin resistance. J Clin Invest 2006;116:1793–1801 [DOI] [PMC free article] [PubMed] [Google Scholar]
- 46.Jenkins SJ, Ruckerl D, Cook PC, et al. Local macrophage proliferation, rather than recruitment from the blood, is a signature of TH2 inflammation. Science 2011;332:1284–1288 [DOI] [PMC free article] [PubMed] [Google Scholar]
- 47.Gordon S, Martinez FO. Alternative activation of macrophages: mechanism and functions. Immunity 2010;32:593–604 [DOI] [PubMed] [Google Scholar]
- 48.Brombacher F, Arendse B, Peterson R, Hölscher A, Hölscher C. Analyzing classical and alternative macrophage activation in macrophage/neutrophil-specific IL-4 receptor-α-deficient mice. Methods Mol Biol 2009;531:225–252 [DOI] [PubMed] [Google Scholar]
- 49.Herbert DR, Hölscher C, Mohrs M, et al. Alternative macrophage activation is essential for survival during schistosomiasis and downmodulates T helper 1 responses and immunopathology. Immunity 2004;20:623–635 [DOI] [PubMed] [Google Scholar]
- 50.Takeda K, Tanaka T, Shi W, et al. Essential role of Stat6 in IL-4 signalling. Nature 1996;380:627–630 [DOI] [PubMed] [Google Scholar]