

Abstract
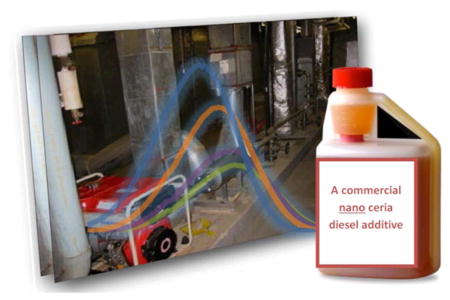
Fuel additives incorporating nanosized ceria have been increasingly used in diesel engines as combustion promoters. However, few studies have assessed the impact of these nanotechnology-based additives on pollutant emissions. Here, we systematically compare emission rates of particulate and gaseous pollutants from a single-cylinder, four-cycle diesel engine using fuel mixes containing nanoceria of varying concentrations. The test fuels were made by adding different amounts of a commercial fuel additive Envirox into an ultralow-sulfur diesel fuel at 0 (base fuel), 0.1-, 1-, and 10-fold the manufacturer-recommended concentration of 0.5 mL Envirox per liter of fuel. The addition of Envirox resulted in ceria-concentration-dependent emission reductions of CO2, CO, total particulate mass, formaldehyde, acetaldehyde, acrolein, and several polycyclic aromatic hydrocarbons. These reductions at the manufacturer-recommended doping concentration, however, were accompanied by a substantial increase of certain other air pollutants, specifically the number of ultrafine particles (+32%), NOx (+9.3%), and the particle-phase benzo[a]pyrene toxic equivalence quotient (+35%). Increasing fuel ceria concentrations also led to decreases in the size of emitted particles. Given health concerns related to ultrafine particles and NOx, our findings call for additional studies to further evaluate health risks associated with the use of nanoceria additives in various engines under various operating conditions.
INTRODUCTION
As a fuel-borne catalyst, ceria (CeO2) nanoparticles have been increasingly used in Europe and elsewhere as a diesel fuel additive.1–3 Although the addition of CeO2 (either in a nanoscale or a microscale form) has been reported to increase fuel combustion efficiency and to decrease soot emissions,4,5 there are major uncertainties about if and how a nano-CeO2-based additive can alter the physical and chemical characteristics of diesel exhaust.6 There are several commercial CeO2-based diesel additives, available mostly in Europe. A case study performed by Park and colleagues7 assessed health risks associated with the use of one of such additives, Envirox (Energenics Europe Ltd., Begbroke, Oxfordshire, U.K.). This study concluded that exposure to CeO2-containing particles in the exhaust from vehicles burning Envirox-spiked fuel poses minimal additional health risk in the U.K. These conclusions were based on the observed negligible increases in ambient concentrations of CeO2 and a comparison of cellular toxicity between aerosols emitted from an engine combusting a regular diesel fuel and aerosols emitted from an engine combusting Envirox-containing fuel.7 However, important questions concerning the potential health and environmental impact of Envirox remain unanswered. For example, does the addition of Envirox to diesel fuel affect the emissions of such commonly regulated pollutants as carbon monoxide (CO), nitrogen dioxide (NO2), and particulate matter (PM), as well as other toxic compounds such as polycyclic aromatic hydrocarbons (PAHs) and aldehydes? Does the fuel additive alter physicochemical properties of diesel exhaust particles (DEPs) such as particle size and chemical composition?
Few studies examined the effects of adding CeO2 to diesel fuel on the exhaust composition. For example, Farfaletti and colleagues8 assessed how doping diesel fuel with a mixture of organometallic compounds based mainly on Ce (used as a combustion improvement catalyst) affected heavy-duty and light-duty engine emissions of PM, CO, nitrogen oxides (NOx), and benzo[a]pyrene toxic equivalence quotient (B[a]P-TEQ). The latter, B[a]P-TEQ, is used to express toxicity of a mix of PAHs through equivalent toxicity of only one compound: benzo[a]pyrene.9 The above-mentioned study by Farfaletti and colleagues 8 found that the Ce catalyst was inefficient in the heavy-duty engine for all emissions except for B[a]P-TEQ (38% reduction), but markedly reduced all emissions except NOx (unchanged) in the light-duty engine. Another study by Jung and colleagues,5 focusing on the kinetics of oxidation and combustion chemistry, reported a substantial increase of ultrafine particles emitted from a diesel engine combusting a fuel doped with a different commercial CeO2-based additive Eolys DPX-9 (Rhodia Electronics & Catalysis, La Rochelle, France).
The goal of the present study was to systematically examine the emissions of several major air pollutants, including gases and particles, as a function of CeO2-nanoparticle doping concentration in a typical diesel fuel. The fuel was doped with Envirox. We used a diesel-powered electrical generator as a model compression ignition engine to estimate emission rates on the basis of fixed energy output, that is, the engine was operated at a constant electrical load. By using an off-the-shelf commercial nano-CeO2 additive used in a contemporary diesel fuel and engine, the present study is expected to generate data useful for future assessments of environmental and health impacts of commercial nano-CeO2 additives.
MATERIALS AND METHODS
Fuel, Ceria Additive, Diesel Engine, and Test System
A standard EPA No. 2 on-road ultralow sulfur diesel fuel (<15 ppm sulfur), purchased at a regular gas station in Edison, New Jersey, U.S.A. in July 2011, was used as base fuel. The lubricating oil used in this study was Premium SAE 10W30 motor oil (XCEL Lubricants, Tampa, FL). Different amounts of a nano-CeO2-based diesel additive, Envirox, purchased in London, U.K., in April 2011, were added to the base fuel to create the following four fuel mixtures: no Envirox added (0× fuel), 0.05 mL Envirox per liter base fuel (0.1× fuel), 0.5 mL Envirox per liter (1× fuel, which was the manufacturer-recommended concentration for extended use at that time), and 5 mL Envirox per liter (10× fuel), respectively. Using an ICP-MS analysis method, we confirmed that the CeO2 content of Envirox was 2.2 ± 0.1% w/w (0.018 ± 0.001 g/L), consistent with a previously reported value.7 Hence, the concentrations of nanosized CeO2 were 0, 0.9, 9, and 90 μg/ mL in the 0×, 0.1×, 1×, and 10× fuels, respectively. We did not examine Envirox for CeO2 size and shape as this analysis had been performed in a previous independent study reporting that ceria in Envirox was in the form of 5–10 nm spherical particles.10 To minimize cross-fuel contamination, we ran the experiments in the following order: 0×, 0.1×, 1×, and 10×. Prior to each measurement session, the engine was operated for 45–60 min to warm up and to achieve a steady exhaust. Before starting a new cycle of experiments, we cleaned the engine by burning off at least a full tank of the 0× base fuel.
The schematic of the test system is shown in Figure S1 in Supporting Information. The test engine was a one-cylinder, four-cycle, 406 cc diesel-powered electric generator (Model YDG 5500EE, Yanmar Inc., Adairsville, GA). During all the experiments, the engine was operated to constantly dissipate 5.5 kW generated electricity (100% load) using four ceramic heaters; and the electricity output was monitored by an ammeter. A portion of hot diesel exhaust was directed into a mixing box (0.5 m × 0.5 m × 0.6 m), where it was mixed and diluted by the HEPA- and charcoal-filtered ambient air; and then the mixture passed through a stainless steel air diffuser into the Controlled Environment Facility (CEF), which is a 25-m3 stainless steel chamber. The degree of dilution was controlled to maintain particle concentration in the CEF at 400 ± 80 μg/m3, as measured by a SidePak photometer (Model AM510, TSI Inc., Shoreview, MN), which measures particle mass in the size range 0.1–10 μm. This mass concentration was higher than ambient PM concentrations in urban areas of developed countries but could be found in tunnels11 and was often measured along roadways in urban areas of some developing countries. Hence, the test atmosphere was still somewhat realistic for near-roadway situations (further lowering PM concentration would have greatly increased experimental difficulties to measure certain exhaust components). Temperature and relative humidity in the CEF were maintained at 22–23 °C and 40–41%, respectively. Air samplers and monitors were placed in the center of the CEF or immediately outside the chamber to measure particulate and gaseous pollutants as described below. For the instruments located outside the chamber, the shortest possible electrically conductive tubing was used to minimize airborne particle losses during the transport from sampling ports to the instruments.
Particle Size Distributions
Aerosol size distributions were measured using a Scanning Mobility Particle Sizer (SMPS) (modules 3080/3786, TSI Inc., Shoreview, MN) and an Aerodynamic Particle Sizer (APS) (Model 3321, TSI Inc.). The SMPS measures particle electrical mobility diameter, while the APS measures particle aerodynamic diameter. These diameters would be identical for spherical particles of 1 g × cm−3 density and carrying a single electrical charge. An aerosol stream was drawn from a single inlet and then split into two using a stainless steel flow splitter (Model 3708, TSI Inc.). The aspiration rate of the SMPS was 0.3 L/min and that of the APS was 1.0 L/min. The SMPS was set up with the 0.0457 cm impactor (D50 = 0.656 μm) and measured particles between 14.1 and 685.4 nm. The system was set to measure the particle size distribution in 200-s intervals with a 15-s retrace. The APS measured particles in the 0.6–19.8 μm size range. Both the SMPS and the APS were set to continuously repeat measurements every 4 min. The measurements were completed over three to four 45- to 60-min measurement sessions for each fuel type. Size distributions were averaged for each session. The measured particle size distributions by number are presented as ΔN/Δlog Dp, cm−3, where ΔN is the number of particles detected in a size channel and Δlog Dp is the difference between the logarithms of the upper and lower channel diameters.
Particle Mass Concentration
Particle mass concentrations were measured using a SidePak (TSI Inc.). Based on the side-by-side comparison of the SidePak readings with the gravimetrically determined concentrations of the same diluted diesel exhaust, we determined a diesel-specific calibration factor of 0.53 (linear regression coefficient >0.99) to compensate for the difference in photometrically and gravimetrically determined mass concentrations. The data logging interval of the SidePak was set at 60 s, from which test session averages were computed.
Total Particle Number Concentration
Total particle number concentrations were determined by combining number concentrations from individual channels of the SMPS measurements (14.3–685.4 nm). The APS measurements were not included in the total particle number concentration, because the APS measured a very small fraction of total particles, that is, 4 orders of magnitude lower that the SMPS concentrations.
CO2, CO, and NO/NO2/NOx
CO2 was monitored using a GE Telaire 7001 standard CO2/temperature monitor (Fotronic Corporation, Melrose, MA) with a measurement range from 0 to 10 000 ppm, a resolution of 1 ppm, repeatability ±20 ppm, and accuracy the greater of ±50 ppm or ±5% of reading. CO was measured using an electrochemical sensor (Model T15n, Langan Products Inc., San Francisco, CA) with a measurement range from 0 to 200 ppm, resolution of ±0.05 ppm, and detection limit of 0.1 ppm. For the measurement of nitrogen oxides, we used a chemiluminescence NO/NO2/NOx Analyzer (Model 42C, Thermo Electron Corporation, Franklin, MA) with a measurement range from 0 to 100 ppm, detection limit of 0.40 ppb, resolution of 0.01 ppb, and repeatability of ±0.4 ppb. All of these monitors were calibrated according to manufacturers’ recommendations using gas standards in our laboratory, in addition to initial and periodical calibrations by the manufacturers.
Aldehydes
Aldehydes were measured using the U.S. EPA Method TO-11A,12 a detailed outline of which is provided in Supporting Information. The following aldehydes were quantified using certified standard solutions of carbonyl-dinitrophenylhydrazine derivatives (Accustandards Inc., New Haven, CT): formaldehyde, acetaldehyde, acrolein, propionaldehyde, crontonaldehyde, butyraldehyde, benzaldehyde, iso-valeraldehyde, valeraldehyde, o-tolualdehyde, sum of m-tolualdehyde and p-tolualdehyde, hexaldehyde, and 2,5-dimethylbenzaldehyde. The precision of the method, measured as relative standard deviation (RSD) from 8 repeated analyses, ranged from 8.5% to 19.2%; and the analytical method accuracy, measured as recovery of spiked carbonyl standards, ranged from 80% to 109%, across these aldehydes.
PAHs
Gas-phase and particle-phase PAHs were collected using a sampling system consisting of a 37-mm Teflon filter (Pall Life Sciences, Ann Arbor, MI) and a tube filled with polyurethane foam (PUF). The sampling flow rate was 4 L/ min. The filter and PUF samples were individually placed in separate Soxhlet extraction apparatuses for at least 16 h of extraction using HPLC-grade dichloromethane (Fisher Scientific, Fair Lawn, NJ), followed by rotary evaporation and purification using solid-phase extraction cartridges. The resulting extracts were “re-dissolved” in 1 mL acetonitrile to obtain final solutions ready for the HPLC-fluorescence analysis conducted according to a method described previously.13 Using a certified standard of PAH mixtures (SN# 47940-U, Supelco Corp, St. Louis, MO), we quantified the following PAHs: naphthalene, acenaphthene, acenaphthrene, fluorene, phenanthrene, anthracene, fluoranthene, pyrene, benzo[a]anthracene, chrysene, benzo[b]fluoranthene, benzo[a]pyrene, dibenzo-[a,h]anthracene, and benzo[g,h,i]perylene. The precision of the analytical method, measured as RSD from 6 repeated analyses, ranged from 2.5% to 21%. The method accuracy (recovery), ranged from 73% to 136%. Because different PAHs have different toxicities, we calculated benzo[a]pyrene toxic equivalence quotient (B[a]P-TEQ), which is commonly used as an indicator of PAH mixture’s toxicity in risk assessment. 8 B[a]P-TEQ is the sum of PAHs weighted by their corresponding toxicity equivalent factors (TEF) in reference to benzo[a]pyrene (see Table 2 footnote).
Table 2.
Emission Rates (μg/h) of Particle- and Gas-Phase Polycyclic Aromatic Hydrocarbons (PAHs) for the Four Diesel Fuels with Varying Envirox Concentrations
| 0× fuel
|
0.1× fuel
|
0.1 × fuel
|
10× fuel
|
|||||||||
|---|---|---|---|---|---|---|---|---|---|---|---|---|
| mean | SD | RSD (%) | mean | SD | RSD (%) | mean | SD | RSD (%) | mean | SD | RSD (%) | |
| particle-phase PAHs (pg/h) | ||||||||||||
| naphthalene | 0.72 | 0.1812 | 25.048 | 2.96a | 0.58 | 20 | 0.91 | 0.14 | 15 | ND | ||
| acenaphthene | ND | 1.16 | 0.11 | 8.9 | 0.28 | 0.06 | 20 | 4.69 | 0.83 | 18 | ||
| fluorene | 5.96 | 3.87 | 64.901 | 6.68 | 0.76 | 11 | 7.58 | 0.48 | 6.4 | 39.8a | 6.89 | 17 |
| phenanthrene | 166 | 60 | 36 | 286a | 38 | 13 | 191 | 1.76 | 1 | 34.8a | 1.55 | 4.5 |
| anthracene | 53.9 | 15.7 | 29 | 44.4 | 11.2 | 25 | 54.1 | 6.71 | 12 | 178a | 17.3 | 10 |
| fluoranthene | 301 | 108 | 36 | 600a | 73 | 12 | 472 | 1.9 | 0.5 | 29.6 | 3.7 | 12 |
| pyrene | 38.4 | 12.5 | 32 | 42.7 | 28.9 | 67 | 47.2 | 5.7 | 12 | 5.49 | 0.68 | 12 |
| benzo(a) anthracene | 8.88 | 2.51 | 28 | 7.17 | 1.71 | 24 | 8.62 | 1.36 | 16 | 4.94 | 0.37 | 7.4 |
| chrysene | 10.4 | 3.52 | 34 | 1.44a | 0.1 | 7 | 1.65a | 0.12 | 7.4 | 0.03a | 0.01 | 31 |
| benzo(b) fluoranthene | 0.51 | 0.13 | 25 | 0.13a | 0.03 | 18 | 0.101a | 0.05 | 46 | 0.009a | 0.0004 | 4.6 |
| benzo(a)pyrene | 0.011 | 0.0045 | 41 | 0.038a | 0.0042 | 11 | 0.0168 | 0.0007 | 4.4 | 0.025a | 0.0047 | 19 |
| dibenzo(a,h) anthracene | 0.053 | 0.022 | 42 | 0.037 | 0.008 | 22 | 0.041 | 0.019 | 46 | 0.44a | 0.019 | 4.2 |
| benzo(ghi) perylene | 0.059 | 0.18 | 30 | 0.477 | 0.072 | 15 | 0.66 | 0.07 | 9.1 | ND | ||
| B(a)P-TEQb | 4.68 | 0.94 | 20 | 7.55 | 1.89 | 25 | 6.34 | 1.46 | 23 | 1.38a | 0.19 | 14 |
| gas-phase PAHs (pg/h) | ||||||||||||
| naphthalene | 165 | 15.5 | 9.4 | 155 | 16.7 | 11 | 100a | 3.86 | 3.8 | 136 | 24.9 | 18 |
| acenaphthylene | ND | 4.36 | 0.23 | 5.3 | 8.04 | 0.28 | 3.5 | 8.82 | 0.83 | 9.4 | ||
| acenaphthene | 7.34 | 0.75 | 10 | 2.96a | 1.73 | 58 | 3.17a | 0.2 | 6.4 | 0.86a | 0.07 | 8.5 |
| fluorene | 36.1 | 3.91 | 11 | 15.3 | 12.8 | 84 | 124a | 4.12 | 3.3 | 90.7a | 16.6 | 18 |
| phenanthrene | 86.2 | 13.2 | 15 | 56.3 | 17.6 | 31 | 74.3 | 7.17 | 9.7 | 36.6a | 5.97 | 16 |
| anthracene | 92 | 7.2 | 7.8 | 93.8 | 3.14 | 3.4 | 71.9 | 2.97 | 4.1 | 66.1 | 21.4 | 32 |
| fluoranthene | 35.5 | 5.14 | 14 | 36.2 | 2.47 | 6.8 | 39.6 | 1.76 | 4.4 | 125a | 14.2 | 11 |
| pyrene | 11.5 | 2.25 | 20 | 12.3 | 3.63 | 30 | 8.57 | 1.07 | 13 | 9.01 | 1.36 | 15 |
| benzo(a) anthracene | 14.9 | 1.09 | 7 | 15.4 | 0.56 | 3.6 | 11.2a | 0.52 | 4.6 | 9.73a | 1.19 | 12 |
| chrysene | 2.39 | 0.5 | 21 | 2.25 | 0.016 | 0.7 | 2.01 | 0.17 | 8.4 | 1.10a | 0.27 | 24 |
| benzo(b) fluoranthene | 0.9 | 0.23 | 25 | 0.68 | 0.36 | 52 | 0.48 | 0.03 | 6.4 | 0.22a | 0.023 | 10 |
| B(a)P-TEQb | 2.19 | 0.5 | 24 | 2.18 | 0.6 | 25 | 1.86 | 0.4 | 21 | 2.48 | 0.5 | 21 |
A significant difference (p < 0.05) relative to the 0× fuel, based on two-tailed student t test, n = 3 for all compounds.
PAH (TEF value): fluorene(0.001), phenanthrene(0.001), fluoranthene(0.01), pyrene(0.01), benzo[a]anthracene(0.1), chrysene(0.01), benzo[b]fluoranthene(0.1), benzo[k]fluoranthene(0.1), benzo[a]pyrene(1), indeno[1,2,3-cd]pyrene(0.1), dibenzo[a,h]anthracene(1), benzo[ghi]perylene(0.01). TEQ = σTEFi(ERi).from diesel fuel with varying concentrations
Calculation of Emission Rates
We determined fuel burn rate (L/h) and the fuel consumption rate (L/kWh) by measuring the time required to combust a known amount of fuel (an approximately full tank), all under a constant 100% load (5.5 kW electric output). Because more than 99% of fuel carbon is converted into CO2 in a typical compression ignition engine, CO2 emission rate can be calculated using the fuel burn rate and a carbon conversion factor for a specific type of fuel. 14 Our results showed that the concentration ratios of the sum of CO-carbon in gaseous phase and total carbon in PM to CO2-carbon ranged from 0.34% to 0.41% for the four fuel types, confirming that more than 99.6% of fuel carbon was emitted by our test engine as CO2. The actual carbon content (86.17 wt %) and the density (0.856 g/mL at 15 °C) of the test diesel fuel were determined by a commercial laboratory (Intertek Lab, Carteret, NJ). We estimate that burning 1 L diesel resulted in emission of 2.694 g-CO2/mL-fuel (0.856 g-fuel/mL-fuel ×0.8617 g-carbon/g-fuel ×0.996 × 44 g-CO2/12 g-carbon). This number is within the range of conversion factors (2.68 – 2.7 kg-CO2/L-fuel) recommended by various governmental agencies.14,15 The fuel burn rate is multiplied by this factor to obtain the CO2 emission rate (kg-CO2/h.).
Given that CO2 and all the other pollutants were measured in the CEF simultaneously, we anticipated that all the pollutants were diluted at equal ratios. Thus the emission rate of a particular pollutant was calculated by multiplying the concentration ratio of a pollutant to CO2 by the CO2 emission rate. Before calculating pollutant/CO2 ratios, concentrations of all the measured species were recalculated to standard temperature and pressure (298 K and 1 atm). Concentrations were averaged over each 45–60-min session for the real-time monitoring data to be consistent with the data derived from integrated sampling for analyses of aldehydes and PAHs.
RESULTS
Effects of Nanoceria Concentration on Fuel Consumption Rate
The impact of Envirox on fuel consumption is shown in Figure 1. Since the output of the diesel engine was kept constant at 5.5 kW, fuel consumption per kWh electricity generated was calculated by dividing the fuel burn rate (L/h.) by 5.5 kW. Results show a decreasing trend in fuel consumption rate with increasing Envirox concentrations in the diesel fuel. Adding Envirox at 0.1 factor of the manufacturer-recommended concentration for extended (regular) use resulted in negligible 0.6% fuel savings, and doping the fuel at the manufacturer-recommended concentration for extended use resulted in 5.6% fuel savings. This finding is consistent with the statement by the manufacturer that “4–11% fuel economy benefits have been demonstrated in independently assessed field trials under commercial operating conditions”,16 although toward the lower values of the indicated range. Interestingly, we also observed that a further increase of Envirox concentration in the fuel (the 10× fuel) resulted in a significantly greater reduction in fuel consumption rate (by 11.3%) compared to the base fuel. Hence, we confirmed that doping the diesel fuel with manufacturer recommended concentrations and higher indeed led to fuel savings.
Figure 1.
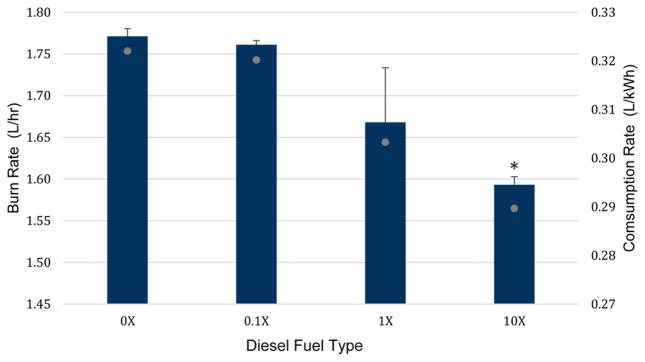
Fuel burn rate (L/h) and consumption rate (L/kWh) for the four diesel fuel types containing varying Envirox concentration. Asterisk (*) denotes a significant difference (p < 0.05) relative to the 0× fuel, based on two-tailed student t test.
Effects of Nanoceria Concentration on CO2, CO, and NOx Emissions
Given that ~99.6% of fuel carbon was converted to CO2, the impact of Envirox concentration on the fuel consumption rate can be directly translated into the impact on CO2 emission rate. This means that the addition of Envirox at the manufacturer-recommended concentration (the 1× fuel) and higher (the 10× fuel) resulted in a 5.6% and 11.3% reduction in CO2 emissions, respectively, for the same amount of electricity generated (Table 1).
Table 1.
Emission Rates of Carbon Dioxide, Carbon Monoxide, Nitrogen Oxides, PM Mass, and PM Number for the Four Diesel Fuels with Varying Envirox Concentrations
| pollutants | 0× fuel
|
0.1× fuel
|
0.1× fuel
|
10× fuel
|
||||||||||||
|---|---|---|---|---|---|---|---|---|---|---|---|---|---|---|---|---|
| N | mean | SD | RSD (%) | N | mean | SD | RSD (%) | N | mean | SD | RSD (%) | N | mean | SD | RSD (%) | |
| CO2(kg/h) | 2 | 4.77 | 0.02 | 0.4 | 2 | 4.74 | 0.01 | 0.2 | 2 | 4.49 | 0.18 | 3.9 | 2 | 4.29a | 0.03 | 0.6 |
| CO (g/h) | 3 | 9.37 | 0.29 | 3.0 | 3 | 9.37 | 0.36 | 3.8 | 3 | 8.37a | 0.24 | 2.9 | 2 | 7.99a | 0.25 | 3.1 |
| NO (g/h) | 3 | 10.85 | 2.25 | 20.7 | 3 | 11.77 | 2.19 | 18.6 | 3 | 11.95 | 2.00 | 16.7 | 2 | 13.92 | 0.02 | 0.1 |
| NO2 (g/h) | 3 | 0.27 | 0.03 | 11.3 | 3 | 0.31 | 0.16 | 52.8 | 3 | 0.185a | 0.02 | 11.9 | 2 | 0.29 | 0.06 | 19.5 |
| NOx (g/h) | 3 | 11.11 | 2.26 | 20.3 | 3 | 12.08 | 2.25 | 18.6 | 3 | 12.14 | 2.02 | 16.6 | 2 | 14.20 | 0.07 | 0.5 |
| PM mass (mg/h) | 3 | 833.4 | 138.1 | 16.6 | 2 | 741.8 | 132.6 | 17.9 | 3 | 630.3 | 153.6 | 24.4 | 2 | 449.1a | 2.7 | 0.6 |
| PM number (1012/h) | 3 | 310.2 | 66.3 | 21.4 | 4 | 334.2 | 50.3 | 15.1 | 4 | 410.7 | 64.3 | 15.7 | 4 | 396.6 | 44.8 | 11.3 |
Significant difference (p < 0.05) relative to the 0× fuel, based on a two-tailed student t test.
The impact of Envirox on CO emission rates followed the same pattern shown for CO2. For the 0.1× fuel, CO emission rate remained unchanged relative to the 0× fuel. For the 1× fuel and the 10× fuel, CO emission rate was reduced by 10.6% and 14.6%, respectively. We observed a small variation (< ± 4% RSD) in CO emission rate for the repeated experimental sessions (Table 1).
In contrast, increasing CeO2 concentrations in the fuel led to increased emission rates of NOx (NOx = NO + NO2). Relative to the 0× fuel, the 0.1×, 1×, and 10× fuel emitted 8.7%, 9.3%, and 27.8% more NOx, respectively. Given that NO/NO2/NOx concentrations were measured within a few seconds after the exhaust exited the engine, a time not long enough to oxidize NO to NO2, we observed that >97% of NOx was in the form of NO. We also observed greater session-to-session NOx concentration variability compared to that for CO or CO2, for each of the 0×, 0.1×, and 1× fuels (Table 1). This may be explained by some factors beyond our experimental control capabilities, including day-to-day variability in engine operation and ambient wind. The wind may have had an effect on the portion of diesel exhaust that was diverted to the CEF (Supporting Information Figure S1) thus affecting the dilution rate. Because NO to NO2 conversion depends on air dilution of the hot exhaust exiting the engine, subtle changes in wind direction and speed may have had a larger impact on NO2 than CO and CO2.
Effects of Nanoceria Concentration on PM Mass and PM Number Emissions
Increasing CeO2 concentrations in the base fuel resulted in decreased emission rates for total particle mass in a concentration-dependent manner. Relative to the 0× fuel, the 0.1× fuel, and 1× fuel had a 11.0% and 24.4% reduction, while the 10× fuel had a significant 46.1% reduction in PM mass (Table 1).
Contrary to the impact on PM mass, adding Envirox to the base fuel at increasing concentrations from 0× to 0.1×, 1×, and 10× fuel led to increased emission rates of total particle number by 7.7%, 32.4%, and 27.9%, respectively.
Effects of Nanoceria Concentration on Particle Size Distribution
Particle size distributions by number are shown in Figure 2. All size distributions were measured for the same mass concentration of 400 ± 80 μg/m3 monitored by SidePak. The data suggest that particle size distributions were approximately log-normal and that the engine released progressively smaller particles as CeO2 concentrations in the fuel increased. We also calculated median, mean and mode particle diameters based on the number and mass concentrations (Figure 3). The mass concentration was calculated based on the number concentration assuming particles were spherical and had density of 1 g/cm3. The mode diameters of the number-based aerosol size distributions for the 0×–1× fuel types were above 100 nm, ~145 nm for 0×, ~140 nm for 0.1×, and ~120 nm for 1×, but decreased to approximately 100 nm for the 10× fuel type. The median and mean particle diameters by number showed a similar decrease and were at or below 100 nm for the 10× fuel. The median, mean, and mode particle diameters by mass were approximately 250 nm for 0× fuel and decreased consistently with increasing concentration of the CeO2 additive to approximately 150 nm for the 10× fuel (Figure 3). The differences between the median, mean and mode diameters for the 1× and 10× fuels were statistically significant relative to those for the 0× fuel with the exception of the number-based mean diameter for the 1× fuel. The same parameters for 0.1× fuel were not statistically different from 0× fuel.
Figure 2.

Particle size distributions based on particle number concentrations measured inside the test chamber.
Figure 3.
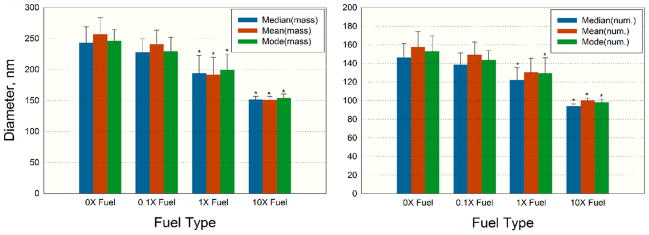
Descriptive statistics for the aerosol size distribution in CEF for the four fuel types: mass-based (left), number-based (right). Asterisk (*) denotes a significant difference (p < 0.05) relative to the 0× fuel, based on the two-tailed student t test.
Effects of Nanoceria Concentration on PAH Emissions
Emission rates of particle-phase PAHs are presented in the upper part of Table 2. As Envirox concentration increased, there were generally no consistent increase or decrease trends for the majority of individual compounds. When comparing B[a]P-TEQ emission rates, we observed that the 10× fuel resulted in a 70% reduction compared to the base fuel. In total contrast, the 0.1× and 1× fuels increased B[a]P-TEQ emission rates by 60% and 35%, respectively. Furthermore, we observed that the emissions from the 10× fuel had less variation (smaller RSDs) between sessions compared to emissions from the other three fuels. As shown in the lower part of Table 2, the impact of Envirox concentration on the gas-phase PAHs was not consistent across different PAHs, resulting in smaller changes in B[a]P-TEQ compared to the CeO2 impact on the particle-phase PAHs.
Effects of Nanoceria Concentration on Emissions of Aldehydes
Increasing CeO2 concentrations in the fuel resulted in decreasing emission rates of formaldehyde, acetaldehyde, and acrolein in a CeO2-concentration-dependent manner (Table 3). Relative to the 0× fuel, the 0.1×, 1×, and 10× fuels resulted in a 6.7%, 8.7%, and 30% reduction in formaldehyde emission rate, 4.4%, 8.7%, and 30% reduction in acetaldehyde emission rate, and 11%, 23%, and 41% reduction in acrolein emission rate, respectively. These three aldehydes were the most abundant aldehydes quantified in the engine exhaust, accounting for 89–92 wt % of the sum of all the aldehydes reported in Table 3. Among the three, formaldehyde was 2.9–3.0 times more abundant than acetaldehyde and 5.9–7.0 times more abundant than acrolein across the four fuel types.
Table 3.
Emission Rates (mg/h) of Gas-Phase Aldehydes for the Four Diesel Fuels with Varying Envirox Concentrations
| 0× fuel
|
0.1× fuel
|
1× fuel
|
10× fuel
|
|||||||||
|---|---|---|---|---|---|---|---|---|---|---|---|---|
| mean | SD | RSD (%) | mean | SD | RSD (%) | mean | SD | RSD (%) | mean | SD | RSD (%) | |
| formaldehyde | 178 | 7.71 | 4.3 | 166 | 2.88 | 1.7 | 162 | 5.39 | 3.3 | 124a | 13 | 11 |
| acetaldehyde | 59.1 | 5.96 | 10 | 56.4 | 1.22 | 2.2 | 53.9 | 1.82 | 3.4 | 41.5a | 4.94 | 12 |
| acrolein | 30.1 | 3.92 | 13 | 26.8 | 5.96 | 22 | 23.3 | 4.41 | 19 | 17.7a | 3.47 | 20 |
| propionaldehyde | 2.38 | 0.86 | 36 | 1.69 | 0.05 | 3.2 | 1.77 | 0.07 | 3.9 | 1.03a | 0.28 | 28 |
| crotonaldehyde | 0.55 | 0.07 | 13 | 0.45 | 0.03 | 5.9 | 0.41 | 0.08 | 18 | 1.23a | 0.09 | 7.2 |
| butyraldehyde | 3.41 | 0.11 | 3.3 | 2.46 | 0.59 | 24 | 1.97a | 0.38 | 19 | 2.28a | 0.55 | 24 |
| benzaldehyde | 2.35 | 0.78 | 33 | 2.05 | 0.50 | 25 | 2.07 | 0.16 | 7.7 | 1.66 | 0.42 | 25 |
| isovaleraldehyde | 3.17 | 0.53 | 17 | 0.77a | 0.05 | 5.9 | 0.91a | 0.27 | 30 | 1.45a | 0.36 | 25 |
| valeraldehyde | 0.68 | 0.10 | 15 | 0.57 | 0.03 | 5.9 | 0.52 | 0.10 | 19 | 1.24a | 0.36 | 29 |
| o-tolualdehyde | 3.83 | 1.47 | 38 | 2.57 | 1.30 | 50 | 3.07 | 0.78 | 25 | 2.00 | 0.23 | 11 |
| m and p-tolualdehyde | 2.42 | 0.33 | 13 | 2.12 | 0.77 | 36 | 3.45a | 0.25 | 7.2 | 2.18 | 0.42 | 19 |
| hexaldehyde | 6.43 | 1.74 | 27 | 4.45 | 0.81 | 18 | 4.80 | 1.17 | 24 | 4.78 | 1.04 | 22 |
| 2,5-dimethylbenzaldehyde | 2.37 | 3.18 | 134 | 4.83 | 0.80 | 17 | 5.39 | 0.45 | 8.3 | 5.02 | 0.52 | 10 |
Significant difference (p < 0.05) relative to the 0× fuel based on two-tailed t test, n = 3 for all compounds.
For the other aldehydes, the impact of Envirox was less clear and not apparently concentration-dependent. For example, although each of the 0.1×, 1×, and 10× fuels had a reduction in the propionaldehyde emission rate, the emission rate for the 0.1× fuel was slightly lower than that for the 1× fuel. The same pattern was observed for benzaldehyde, o-tolualdehyde, and hexaldehyde. For butyraldehyde and iso-valeraldehyde, adding Envirox at each of the three concentrations led to a reduction in emission rate, but the reduction was smaller at the 10× than at the 0.1× and 1×. For 2,5-dimethylbenzaldehyde and the sum of m-tolualdehyde and p-tolualdehyde (coeluted in the HPLC system), adding Envirox to the base fuel seemed to increase the emissions; but the data had large RSDs and had no clear CeO2-dependent trends (Table 3).
DISCUSSION
CeO2 nanoparticles have been commercially used as a diesel fuel additive since 1999. 17 Using a contemporary diesel engine with a well-controlled engine load, we confirmed that the addition of Envirox additive to an ultralow sulfur diesel fuel resulted in a reduction of fuel consumption per unit electricity generated (Figure 1). The fuel savings were at the lower end of the 4–10% savings range stated by the manufacturer when Envirox was added at the manufacturer-recommended concentrations for extended use. These fuel savings directly translate into reductions in CO2 emissions rate, because more than 99% of fuel carbon is typically converted to CO2 during combustion. 14 For our test engine, we estimated that ~99.6% of fuel carbon was converted into CO2. Our findings support the beneficial effect of Envirox in terms of reducing greenhouse gas emissions from diesel engines. To our knowledge, previous studies evaluating the impact of cerium- and ceria-based diesel additives on air pollutant emissions8 have not directly assessed the impact on fuel consumption and CO2 emission. Our study presents an independent evaluation confirming the magnitude of fuel savings falling in the range claimed by the Envirox manufacturer.
The ability of CeO2 nanoparticles to enhance combustion was also reflected in reduced emissions of gaseous products of incomplete combustion. At the manufacturer-recommended concentrations, adding Envirox resulted in reduced emission rates for CO (−10.6%), formaldehyde (−8.7%), acetaldehyde (−8.7%), and acrolein (−23%). Using higher additive concentrations (10× fuel) resulted in further reductions of those emissions. CO is a regulated ambient air pollutant in the United States and many other countries. Formaldehyde is a known or suspected human carcinogen and sensory irritant18,19 and is classified by the U.S. Environmental Protection Agency as a hazardous air pollutant;20 acetaldehyde is a sensory irritant.21 Our results indicate that increasing Envirox concentrations 10-fold (the 10× fuel) caused further reductions in fuel consumption and in emissions of these three aldehydes. Another feature of cerium-based fuel additives is that the presence of cerium/ceria can reduce the ignition (light-off) temperature of the carbonaceous DEPs (soot), thereby facilitating the burnoff of soot in the engine cylinders, which further increases fuel efficiency and, more importantly, reduces particulate emissions from the exhaust.4,5,17,20 In our tests, we observed a 24% reduction in PM mass emission rate at the manufacturer-recommended Envirox concentration and 46% reduction at the 10-fold this concentration. This finding is somewhat consistent with the findings of a previous study, in which a cerium-based additive reduced PM mass emissions by 13% from a light-duty engine but had no changes for a heavy-duty engine.8 This previous study also reported reductions in particle-phase B[a]P-TEQ emissions from both test engines (by 39% for the heavy-duty one and by 25% for the light-duty one).8 Our results suggest that a higher Envirox concentration than recommended by the manufacturer for extended use may be needed to have a reduction in B[a]P-TEQ and individual PAHs. However, the exact concentration of ceria or cerium in the test fuel used in the previous study8 was unknown, limiting the comparability between the previous study and this study.
It has been reported that the soot burnoff effect described above resulted in a decrease in peak number concentrations of accumulation-mode particles (~100 nm) and simultaneously, in a drastic increase in the number concentration of nuclei-mode particles (10–20 nm).20 In the present study, we observed a downward shift in particle sizes with increasing Envirox concentrations in diesel (Figure 2). This was due to the fact that increasing soot oxidative processes can reduce the size of agglomerated particles.22–24 As agglomerated particles break down into single particles or smaller particle agglomerates, the total number of particles would increase. This may explain our finding that the addition of Envirox at the recommended concentration increased the emissions of total particle number by 32%. The “opposite” effects of Envirox on PM mass and PM number add a further challenge to the risk/benefit analysis of this product. Although PM mass concentration (PM10, PM2.5) is currently used for regulatory purposes and in health risk assessment, the mass metric does not always correlate well with ultrafine particle toxicity.25 Instead, the surface area and number of nanoparticles were observed to correlate better with toxic effects for some types of ultrafine particles such as nanosized quartz, metallic cobalt and nickel, and elemental carbon 13C.26,27 However, it is necessary to note that the mass concentration is still the more toxicity-relevant metric for other types of ultrafine particles such as certain nanoparticulate TiO2, carbon black, polystyrene beads, and surface-modified quartz.28–30 For the ultrafine fraction of diesel exhaust particles, health effects research that would provide insights into which metric (mass, number, or surface area) is more relevant is yet to be conducted.
Another observation that complicates the risk/benefit analysis of Envirox is the increased NOx emission rate resulting from the use of the additive. This observation is different from the finding of Farfaletti and colleagues8 that the cerium-based organometallic additive had no effect on NOx emissions from both the heavy-duty and light-duty engines. Given that NO2 is an ambient air pollutant regulated in the U.S and many other countries and that NOx contributes to the formation of ground-level ozone and photochemical smog,31 additional evaluations of NOx emissions resulting from the use of Envirox fuel additive are warranted to understand these different results, albeit for quite different additive formulations. Unfortunately, the exact concentration of cerium/ceria present in the fuel was not reported in the study conducted by Farfaletti and colleagues,8 which precludes a direct comparison of results. Given the potential benefits (e.g., lower fuel consumption and CO2 emissions) and shortcomings (e.g., increased emissions of NOx and total particle number) of nanotechnology-based fuel additives such as Envirox, the few independent evaluations conducted to date appear to be inadequate to answer important questions concerning the environmental and health impact of this technology.7,8,17 Furthermore, changes in physical properties (e.g., size) and chemical compositions (e.g., PAHs) of diesel exhaust particles resulting from the addition of the nano-CeO2 catalyst, as observed in this study, may translate into changes in toxicity of particles associated with different doping concentrations of CeO2, which needs to be investigated in toxicological studies.
Diesel engine emissions of air pollutants can be influenced by many factors, for example, fuel quality, engine type, engine age, operating conditions, and engine load. A distinct contribution of the present study is that it was performed in a regulated laboratory setting permitting fine control of engine operating conditions and other parameters of repeated experiments. This allowed us to compare emissions from diesel fuel with varying concentrations of Envirox. The resulting toxicologically relevant findings of CeO2-concentration-dependent increasing emissions of ultrafine particles and NOx as well as the substantially higher particle-phase B[a]P-TEQ at the manufacturer-recommended concentration of the nano-CeO2 additive call for additional studies to further evaluate the potential health risk associated with the use of nanoceria additives in various applications.
To enhance the “generalizability” of our findings, we used three different doping concentrations of Envirox (0.1×, 1×, and 10× vs 0×), as opposed to just comparing the 1× vs 0×, to examine pollutant emissions as a function of ceria concentration in the fuel. A comparison of our findings to the earlier results of Farfaletti and colleagues8 suggests that nanoceria-induced changes in diesel exhaust composition depend on a particular engine and its exhaust control system. Future studies need to address the transferability of these findings to various diesel engines under various operating conditions. Studies linking combustion mechanisms and pollutant emissions as a function of nanocerium concentration in the fuel will be particularly useful. We also recommend future studies that can shed light on how engines can be tuned to achieve maximal fuel savings while reducing pollutant emissions when combusting nanoceria doped diesel fuels.
Supplementary Material
Acknowledgments
We thank Dr. John Ma and Mr. Mitch Gayer for assistance in conducting the experiments and Ms. Alyse Lin and Mr. Henock Solomon for assistance in preparing the manuscript. The study is jointly funded by the U.S. Environmental Protection Agency (STAR grant 83469302) and the U.K. Natural Environment Research Council (grant NE/H012893). The views expressed in the manuscript are solely of the authors and do not necessarily reflect those of the funding agencies.
Footnotes
Author Contributions
J.Z. and Y.N. contributed equally to this work
The authors declare no competing financial interest.
Additional material as described in the text. This information is available free of charge via the Internet at http://pubs.acs.org/
References
- 1.Gaiser BK, Fernandes TF, Jepson M, Lead JR, Tyler CR, Stone V. Assessing exposure, uptake and toxicity of silver and cerium dioxide nanoparticles from contaminated environments. Environ Health. 2009;8(Suppl 1):S2. doi: 10.1186/1476-069X-8-S1-S2. [DOI] [PMC free article] [PubMed] [Google Scholar]
- 2.Borm PJ, Robbins D, Haubold S, Kuhlbusch T, Fissan H, Donaldson K, Schins R, Stone V, Kreyling W, Lademann J, Krutmann J, Warheit D, Oberdorster E. The potential risks of nanomaterials: A review carried out for ECETOC. Part Fibre Toxicol. 2006;3(11):11. doi: 10.1186/1743-8977-3-11. [DOI] [PMC free article] [PubMed] [Google Scholar]
- 3.Park B, Martin P, Harris C, Guest R, Whittingham A, Jenkinson P, Handley J. Initial in vitro screening approach to investigate the potential health and environmental hazards of Enviroxtrade mark—A nanoparticulate cerium oxide diesel fuel additive. Part Fibre Toxicol. 2007;4(1):12. doi: 10.1186/1743-8977-4-12. [DOI] [PMC free article] [PubMed] [Google Scholar]
- 4.Evaluation of Human Health Risk from Cerium Added to Diesel Fuel, Communication 9. Health Effects Institute; North Andover, MA: 2001. http://pubs.healtheffects.org/getfile.php?u=295. [Google Scholar]
- 5.Jung H, Kittelson DB. Measurement of electrical charge on diesel particles. Aerosol Sci Technol. 2005;39(12):1129–1135. doi: 10.1080/02786820500430357. [DOI] [Google Scholar]
- 6.Cassee FR, van Balen EC, Singh C, Green D, Muijser H, Weinstein J, Dreher K. Exposure, health and ecological effects review of engineered nanoscale cerium and cerium oxide associated with its use as a fuel additive. Crit Rev Toxicol. 2011;41(3):213–229. doi: 10.3109/10408444.2010.529105. [DOI] [PubMed] [Google Scholar]
- 7.Park B, Donaldson K, Duffin R, Tran L, Kelly F, Mudway I, Morin JP, Guest R, Jenkinson P, Samaras Z, Giannouli M, Kouridis H, Martin P. Hazard and risk assessment of a nanoparticulate cerium oxide-based diesel fuel additive—A case study. Inhal Toxicol. 2008;20(6):547–566. doi: 10.1080/08958370801915309. [DOI] [PubMed] [Google Scholar]
- 8.Farfaletti A, Astorga C, Martini G, Manfredi U, Mueller A, Rey M, De Santi G, Krasenbrink A, Larsen BR. Effect of water/ fuel emulsions and a cerium-based combustion improver additive on HD and LD diesel exhaust emissions. Environ Sci Technol. 2005;39(17):6792–6799. doi: 10.1021/es048345v. [DOI] [PubMed] [Google Scholar]
- 9.Human Health Risk Assessment Bulletins, EPA Region 4. U.S. EPA; Washington, DC: 1995. Supplemental Guidance to RAGS: Region 4 Bulletins. http://www.epa.gov/region4/superfund/programs/riskassess/healtbul.html. [Google Scholar]
- 10.Exposure, health and ecological effects review of engineered nanoscale cerium and cerium oxide associated with its use as a fuel additive. Crit Rev Toxicol. 2011;41(3):213–229. doi: 10.3109/10408444.2010.529105. [DOI] [PubMed] [Google Scholar]
- 11.Svartengren M, Strand V, Bylin G, Jarup L, Pershagen G. Short-term exposure to air pollution in a road tunnel enhances the asthmatic response to allergen. Eur Respir J. 2000;15(4):716–724. doi: 10.1034/j.1399-3003.2000.15d15.x. [DOI] [PubMed] [Google Scholar]
- 12.Compendium of Methods for the Determination of Toxic Organic Compounds in Ambient Air. U.S. EPA; Cincinnati, OH: 1999. Determination of Formaldehyde in Ambient Air Using Adsorbent Cartridge Followed by High Performance Liquid Chromatography (HPLC) [Active Sampling Methodology] http://www.epa.gov/ttnamti1/files/ambient/airtox/to-11ar.pdf. [Google Scholar]
- 13.Zhang L, Jiang Z, Tong J, Wang Z, Han Z, Zhang J. Using charcoal as base material reduces mosquito coil emissions of toxins. Indoor Air. 2010;20(2):176–184. doi: 10.1111/j.1600-0668.2009.00639.x. [DOI] [PMC free article] [PubMed] [Google Scholar]
- 14.Average Carbon Dioxide Emissions Resulting from Gasoline and Diesel Fuel. U.S. EPA; Washington, DC: 2005. https://na.chargepoint.com/UI/downloads/help/420f05001.pdf. [Google Scholar]
- 15.Greenhouse Gas Inventory Protocol Core Module Guidance. U.S. EPA; Washington, DC: 2008. Direct Emissions from Stationary Combustion Sources. http://www.epa.gov/climateleadership/documents/resources/stationarycombustionguidance.pdf. [Google Scholar]
- 16.Envirox Product Information. http://www.energenics.co.uk/envirox/envirox-product-information.
- 17.Cassee FR, van Balen EC, Singh C, Green D, Muijser H, Weinstein J, Dreher K. Exposure, health and ecological effects review of engineered nanoscale cerium and cerium oxide associated with its use as a fuel additive. Crit Rev Toxicol. 2011;41(3):213–229. doi: 10.3109/10408444.2010.529105. [DOI] [PubMed] [Google Scholar]
- 18.U.S. DHHS. ATSDR’s Toxicological Profiles. CRC Press; Boca Raton, FL: 2002. [Google Scholar]
- 19.IACR. A Review of Human Carcinogens: Chemical Agents and Related Occupations. World Health Organization; Geneva: 2012. [Google Scholar]
- 20.Control of Emissions of Hazardous Air Pollutants from Motor Vehicles and Motor Vehicle Fuels. U.S. EPA; Washington, DC: 2000. http://www.epa.gov/oms/regs/toxics/r00023.pdf. [Google Scholar]
- 21.Cassee FR, Arts JH, Groten JP, Feron VJ. Sensory irritation to mixtures of formaldehyde, acrolein, and acetaldehyde in rats. Arch Toxicol. 1996;70(6):329–337. doi: 10.1007/s002040050282. [DOI] [PubMed] [Google Scholar]
- 22.Mathis U, Mohr M, Kaegi R, Bertola A, Boulouchos K. Influence of diesel engine combustion parameters on primary soot particle diameter. Environ Sci Technol. 2005;39(6):1887–1892. doi: 10.1021/es049578p. [DOI] [PubMed] [Google Scholar]
- 23.Tree DR, Svensson KI. Soot processes in compression ignition engines. Prog Energy Combust Sci. 2007;33(3):272–309. http://dx.doi.org/10.1016/j.pecs.2006.03.002. [Google Scholar]
- 24.Harris SJ, Maricq MM. Signature size distributions for diesel and gasoline engine exhaust particulate matter. J Aerosol Sci. 2001;32(6):749–764. http://dx.doi.org/10.1016/S0021-8502(00)00111-7. [Google Scholar]
- 25.Dhawan A, Sharma V, Parmar D. Nanomaterials: A challenge for toxicologists. Nanotoxicol. 2009;3(1):1–9. doi: 10.1080/17435390802578595. [DOI] [Google Scholar]
- 26.Oberdorster G, Sharp Z, Atudorei V, Elder A, Gelein R, Kreyling W, Cox C. Translocation of inhaled ultrafine particles to the brain. Inhal Toxicol. 2004;16(6–7):437–445. doi: 10.1080/08958370490439597. [DOI] [PubMed] [Google Scholar]
- 27.Duffin R, Tran CL, Clouter A, Brown DM, MacNee W, Stone V, Donaldson K. The importance of surface area and specific reactivity in the acute pulmonary inflammatory response to particles. Ann Occup Hyg. 2002;46(Suppl 1):242–245. doi: 10.1093/annhyg/46.suppl_1.242. [DOI] [Google Scholar]
- 28.Duffin R, Tran L, Brown D, Stone V, Donaldson K. Proinflammogenic effects of low-toxicity and metal nanoparticles in vivo and in vitro: Highlighting the role of particle surface area and surface reactivity. Inhal Toxicol. 2007;19(10):849–856. doi: 10.1080/08958370701479323. [DOI] [PubMed] [Google Scholar]
- 29.Exposure Factors Handbook. U.S. EPA; Washington, DC: 2011. http://www.epa.gov/ncea/efh/pdfs/efh-complete.pdf. [Google Scholar]
- 30.Wittmaack K. In search of the most relevant parameter for quantifying lung inflammatory response to nanoparticle exposure: Particle number, surface area, or what? Environ Health Perspect. 2007;115(2):187–194. doi: 10.1289/Ehp.9254. [DOI] [PMC free article] [PubMed] [Google Scholar]
- 31.Crutzen PJ. The role of NO and NO2 in the chemistry of the troposphere and stratosphere. Annu Rev Earth Planet Sci. 1979;7:443–472. [Google Scholar]
Associated Data
This section collects any data citations, data availability statements, or supplementary materials included in this article.