Human senses of taste and smell inspired the development of artificial differential receptors for the recognition and identification of a great variety of chemical species.[1] A differential receptor consists of an array of sensors. Each sensor in the array recognizes a series of analytes with different recognition rates. The receptor produces a pattern of the responses. Analysis of the pattern (the fingerprint of the analyte) reveals the presence of a particular analyte in the sample. For example, Anslyn and colleagues designed a differential receptor for the recognition of fatty acids based on serum albumins.[2] Stojanovich et al. used DNA three-way junction sensors to design a differential receptor for steroids.[3] Recently, Chou et al. used nanoscale graphene oxide to design a receptor that differentiated proteins.[4] Here, we adopt this concept for differential analysis of nucleic acid sequences.
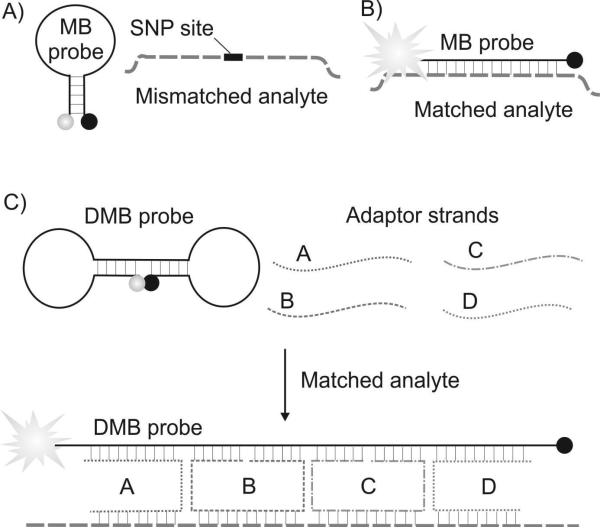
One of the most challenging tasks in nucleic acid analysis is to distinguish two related sequences that differ by a single nucleotide; such as, single nucleotide polymorphisms (SNPs) or point mutations.[5] A conventional approach for SNP analysis takes advantage of a fluorescent sensor called the molecular beacon (MB) probe (Figure 1A).[6] It is a stem-loop folded oligonucleotide conjugated with a fluorophore dye at the 5’ end and with a quencher dye at the 3’ end. The stem brings the fluorophore close to the quencher, while the loop fragment is complementary to an analyzed SNP site. When the MB probe hybridizes with a fully complementary (matched) analyte it undergoes a conformational change to the elongated form, which results in brighter fluorescence (Figure 1B). According to the conventional paradigm, the length of the loop portion and the hybridization conditions are selected to minimize binding of the MB probe to a mismatched analyte, so that fluorescent signal remains at the background level. This approach corresponds to YES/NO digital response. Therefore, analysis of each SNP site requires the synthesis and optimization of two MB probes to report each of two alleles. For genotyping hundreds and thousands of SNP sites double the amount of expensive MB probes are required.
Figure 1.
Comparison of the molecular beacon (MB) probe and differential fluorescent receptor (DFR) approaches for the analysis of SNP containing nucleic acids. A) MB probe does not hybridize to mismatched DNA sequence (the analytes are shown as dashed lines). B) MB probe hybridizes to matched DNA analyte. C) DFR consists of a dumbbell molecular beacon (DMB) probe and four adaptor strands. DFR forms a highly fluorescent complex with a fully matched analyte.
Recently, El-Hajj et al. introduced sloppy MB probes[7a] that are SNP tolerant and can be used for genotyping of SNPs in a differential receptor format.[7] However, this approach requires a number of expensive MB probes, each of which should undergo costly optimization for accurate SNP differentiation. In this study we introduce a differential fluorescent receptor (DFR) that requires only one fluorescent reporter to differentiate at least eight and potentially a greater number of analytes. The overall idea is to create an array of sensors that produce a characteristic SNP-specific signature in the presence of each individual nucleic acid sequence. Each DFR is based on triple-crossover (TX) sensors that use a dumbbell molecular beacon (DMB) probe reported by Lv et al.[8] (Figure 1C, top left). We turned our attention to this MB probe variation, since the DFR concept requires a mutation-tolerant reporter that not only fluoresces in complex with fully matched analyte, but also produces signals of different (presumably lower) intensities in the presence of mismatched sequences. A DMB contains two stem-loops that stabilize the dumbbell shape. Overall this design allows the combination of a relatively long probe sequence with stable secondary structure. In addition, it avoids long stems, which reduce the hybridization rates.[9] Therefore, DMB represents an attractive alternative to the conventional MB probe if a SNP-tolerant nucleic acid recognition is required. Since double-labeled fluorescent probes are relatively expensive, we designed an array of fluorescent sensors that utilizes a single DMB probe as a universal reporter.
Each TX sensor utilizes a universal DMB probe and four target-specific adaptor strands (A, B, C and D), as illustrated in Figure 1C. Each adaptor strand contains a fragment complementary to the analyte and one or two fragments complementary to the DMB probe. The DMB probe and the adaptor strands can form a hexapartite TX complex with the fully complementary analyte (Figure 1C, bottom). In this complex, the fluorophore is separated from the quencher, which enables bright fluorescence. The complex contains three DNA four-way junctions, which resemble the crossover tiles characterized earlier by structural DNA nanotechnology.[10] Presence of mismatches between one of the adaptor strands and the analyte may result in a less stable complex, thus shifting hybridization equilibrium towards free DMB probe. This creates a basis for the differential response to the presence of nucleic acid sequences containing a variety of SNPs. In this proof-of-concept study we demonstrated the feasibility of the aforementioned design.
We chose the sequences of the rpoB gene of Mycobacterium tuberculosis (M.tb) as a clinically relevant analyte. M.tb infects approximately 2 billion people worldwide and is responsible for about 2 million deaths each year.[11] Approximately 10% of all patients are infected with drug-resistant M.tb strains, mainly to the antibiotics rifampin and isoniazid.[12] Rapid and accurate drug susceptibility testing is crucial for the control of active TB with effective drug cocktails. We chose a wild type (WT) and seven sequences of rifampin-resistant strains that have been studied and characterized previously.[13] All the mutations were located in a characteristic 81-bp fragment of the rpoB gene. This fragment is known to contain 95 to 98% of all mutations that impart rifampin resistance to M.tb.[13] We designed three fluorescent sensors, with a single universal MB probe reporter, targeting different segments of the 81-bp fragment of the rpoB gene. Each TX sensor hybridizes to a different region of the analyte due to the unique set of the adaptor stands.
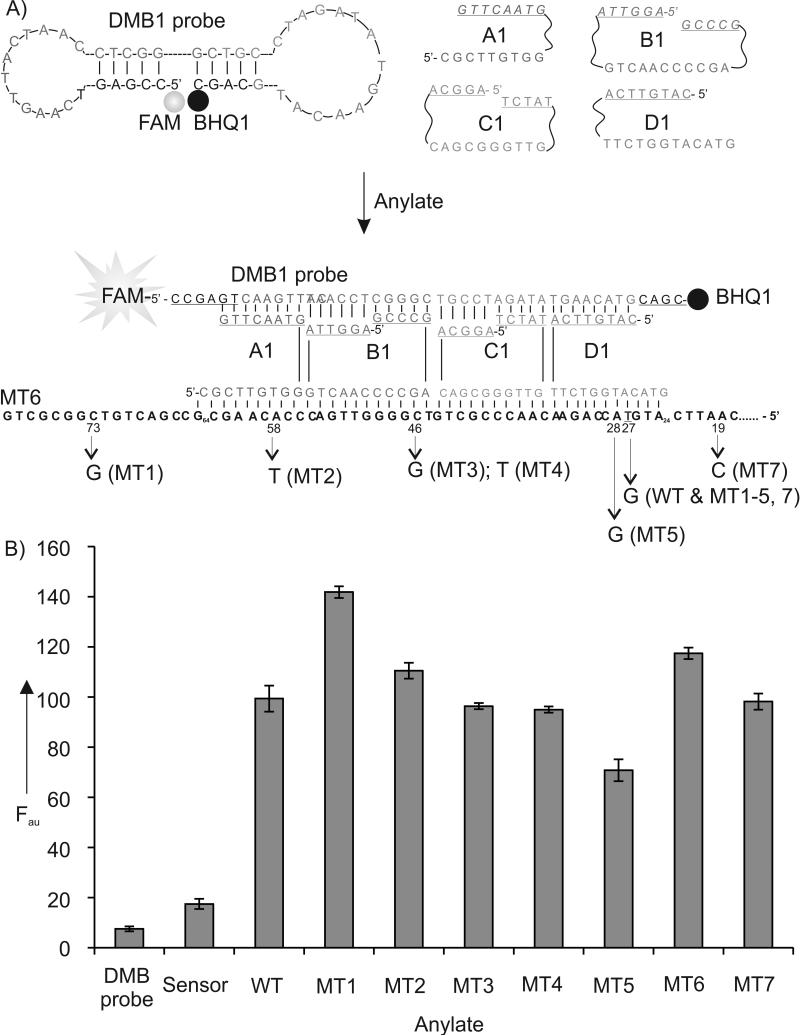
Sensor 1 used adaptor strands A1, B1, C1, and D1 (Figure 2A and S1). The DMB-binding arms of the strands were designed short to minimize interaction with DMB1 probe in the absence of analytes. In particular, strands B1 and C1 contained two pentaor hexa-nucleotide DMB binding arms. In the presence of a cognate DNA analyte, the four adaptor strands and DMB1 probe formed a hexapartite complex with the analyte (Figure 2A, bottom). The fluorophore group is remote from the quencher in this complex, which instigates high fluorescence. Indeed, the complementary DNA analyte, MT6, triggered ~ 7-fold fluorescence increase (Figures 2B and S2). However, when mismatched nucleotides were present, the stability of the complex was decreased for most of the analytes (except MT1) resulting in the reduced fluorescent signal. The higher signal for MT1 analyte can be explained after analysis of secondary structures of the analytes (see SI, Figure S1 and accompanying discussion). Overall, Sensor 1 differentiated WT from MT1, MT5 and MT6. However, in the presence of WT, the sensor signal was statistically indistinguishable from that in the presence of MT2, MT3, MT4 and MT7. To enable differentiation of all analytes, we introduced additional sensors according to the paradigm of differential receptors.[1] The structures and fluorescent responses of Sensors 2 and 3 are presented in Table S1, Figures S3 and S4. The sensors were designed to recognize different fragments of the analytes. Each sensor produced individual pattern of fluorescent responses (Figures S2 and S3). For example, Sensor 2 differentiated WT from MT1, MT2, MT3, and MT4 (Figure S2), while Sensor 3 differentiated WT from MT4, MT5, MT6 and MT7 (Figure S4). Time required for fluorescent responce of the TX sensors was similar to that for a conventional MB probe[6] and other MB probe-based sensors[14] (Figure S5).
Figure 2.
The structure and performance of Sensor 1. A) Schematic diagram of Sensor 1 in the absence and in the presence of MT6 analyte. DMB-binding arms of adaptor strands A1, B1, C1 and D1 are underlined. Single nucleotide differences in DNA analytes are indicated on the bottom. FAM is fluorescein; BHQ1 is Black Hole Quencher-1. B) Fluorescence of Sensor 1 in the presence of different analytes. Samples containing DMB probe (40 nM), A1 (1200 nM), B1, C1, D1 (800 nM each), and analytes (100 nM each) were incubated in the buffer containing 50 mM Tris-HCl, pH 7.4, 50 mM MgCl2 for 25 minutes at 22°C followed by the measurement of FAM fluorescence at 517 nm upon excitation at 485 nm.The data are average values of three independent trials with standard deviations.
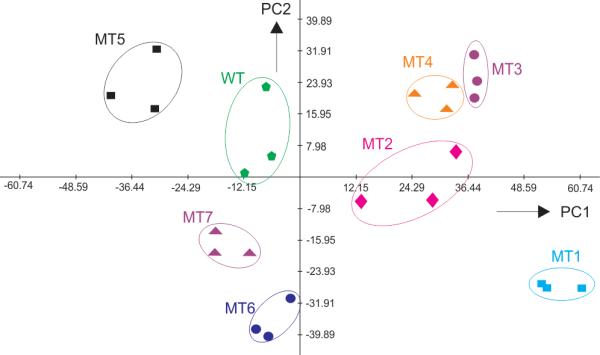
The fluorescent data obtained from the three DFR sensors was analyzed using principal component analysis (PCA),[15] a chemometric technique, that is conventionally used to interpret multidimensional sets of data including those generated by differential receptors.[1] The PCA score plot shown in Figure 3 demonstrates that all eight analytes are distinguished. MT3 and MT4 contained mutations at the same position; therefore, clustering of responses in the close areas was expected for these two analytes. The ability of the sensor to differentiate the analytes at different concentrations was investigated (Figure S6). It was found that DFR was able to distinguish most analytes. The differentiation power of the receptor can be further increased by optimization of individual TX sensors or by introducing additional sensors to the array. However, even with the current differentiation rates the DFR might be useful in practice.
Figure 3.

Principal component analysis (PCA) score plot of the responses from different M.tb analytes in the differential fluorescent receptor (DFR) assay. Clustering of the signals for each analyte in non-overlapping areas indicates the ability of the DFR to differentiate all eight DNA analytes.
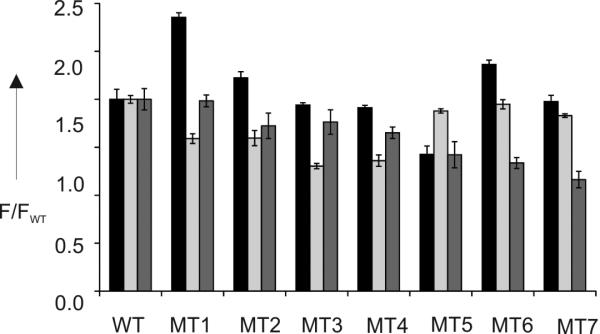
For example, Figure 4 represents an alternative analysis of the data set, in which fluorescent intensities of each series were divided by those of WT (F/FWT). Although each sensor failed to differentiate all eight analytes from WT, an array of only three sensors was sufficient for differentiation of all 8 altered DNA sequences from the WT. In this representation, the signal pattern obtained for WT significantly differed from that of the mutants MT1-7. Therefore, the DMB-based differential receptor is promising for the distinction of drug-susceptible M.tb species from the drug-resistant ones, which is of great practical significance.[12,13]
Figure 4.

Fluorescent signatures of eight M.tb DNA analytes produced by the differential fluorescent receptor (DFR) assay. The black, light grey and dark grey bars represent fluorescent signals of Sensors 1, 2, and 3, respectively, divided by the average florescence produced by WT analyte (F/FWT). The data of three independent measurements are shown with standard deviations.
The differential receptor concept was inspired by the natural senses of smell and taste and has been adopted for sensing of a broad spectrum of biological molecules.[1-4] Here, we propose to use a differential receptor to identify a series of clinically important DNA sequences that differ by a single nucleotide. We demonstrated that an array of three TX sensors that utilize the same DMB fluorescent reporter is sufficient to differentiate eight analytes. The design of the sensors was straightforward; the analyte-binding arms were the only change in the design of each new sensor. The use of non-traditional DMB probe as a fluorescent signal reporter is justified by the need for the increased stability of the folded MB state in the presence of four adaptor strands. The sensor is potentially compatible with such practically significant formats as quantitative real-time PCR (qPCR). Indeed, same as in MB probe-based qPCR, each TX sensor can potentially serve as a real-time hybridization probe. Importantly, the sensor can be adjusted to operate at elevated temperatures (45-55°C) used in qPCR by changing the length of the adaptor strands. We plan to explore this possibility in our future work. An array of several (three) PCR assays utilizing different TX sensor would produce a pattern of fluorescent signals which serve as a unique signature of each analyte. Differential receptors designed against small molecules are typically challenged by the problem of differentiating analytes in complex mixtures of related compounds. This problem is less relevant to qPCR-based analysis of bacterial species in clinical samples, as typically only one type of pathogen is assayed with a given set of PCR primers and the co-infection with two species of bacteria is rear.
In conclusion, we have introduced a fluorescent sensor for the analysis of single nucleotide substitutions in DNA. With this report we hope that the differential receptor concept will find applications in diagnosis of infectious diseases, genetic disorders and in genetic linkage analysis.
Experimental Section
All oligonucleotides were custom-made by Integrated DNA Technologies, Inc (Coralville, IA). The fluorescent assay contained the DMB1 probe (40 nM), each of the four adaptor strands A-D at concentrations 0.4-1.2 μM (see Table S1), and one of the analytes WT, or MT1-MT7 (100 nM). Final sample volumes were 120 μL. All the components of the assay were mixed in the buffer containing 50 mM Tris-HCl, pH 7.4, 50 mM MgCl2 and incubated at 22°C for 25 min. Then, fluorescence of the samples was measured on a Perkin-Elmer (San Jose, CA) LS-55 Luminescence Spectrometer with a Hamamatsu xenon lamp (excitation at 485 nm; emission at 517 nm). The data was analyzed using Microsoft Excel. Principal component analysis was done using MeV v4.8.
Supplementary Material
Acknowledgements
The authors are greatfull to Dr. Vladislav A. Petyuk for the assistance with PCA and Jessica Dorfman for technical support and Dr. Yulia V. Gerasimova for cariful reading of the manuscript. Funding from NIHGRI R21 HG004060, NIAID R15AI10388001A1, NSF CCF 1117205 and the Office of Undergraduate Research at the University of Central Florida is greatly appreciated.
Footnotes
Supporting information for this article is available on the WWW or from the author.
References
- 1.a Liu Y, Ding LP, Cao Y, Fang Y. Prog. Chem. 2012;24:1915–1927. [Google Scholar]; b Wright AT, Anslyn EV. Chem. Soc. Rev. 2006;35:14–28. doi: 10.1039/b505518k. [DOI] [PubMed] [Google Scholar]; b Albert KJ, Lewis NS, Schauer CL, Sotzing GA, Stitzel SE, Vaid TP, Walt DR. Chem. Rev. 2000;100:2595–2626. doi: 10.1021/cr980102w. [DOI] [PubMed] [Google Scholar]; c Lavigne JJ, Anslyn EV. Angew. Chem. Int. Ed. 2001;40:3119–3130. doi: 10.1002/1521-3773(20010903)40:17<3118::AID-ANIE3118>3.0.CO;2-Y. [DOI] [PubMed] [Google Scholar]; j Folmer-Andersen JF, Kitamura M, Anslyn EV. J. Am. Chem. Soc. 2006;128:5652–5653. doi: 10.1021/ja061313i. [DOI] [PubMed] [Google Scholar]; k Scott SM, James D, Ali Z. Microchim. Acta. 2006;156:183–207. [Google Scholar]; m Zhou H, Baldini L, Hong J, Wilson AJ, Hamilton AD. J. Am. Chem. Soc. 2006;128:2421–2425. doi: 10.1021/ja056833c. [DOI] [PubMed] [Google Scholar]; m Collins BE, Wright AT, Anslyn EV. Top. Curr. Chem. 2007;277:181–218. [Google Scholar]; n Palacios MA, Wang Z, Montes VA, Zyryanov GV, Anzenbacher P., Jr. J. Am. Chem. Soc. 2008;130:10307–10314. doi: 10.1021/ja802377k. [DOI] [PubMed] [Google Scholar]; o Röck F, Barsan N, Weimar U. Chem. Rev. 2008;108:705–725. doi: 10.1021/cr068121q. [DOI] [PubMed] [Google Scholar]; p Phaisangittisagula E, Nagle HT, Areekul V. Sens. Actuators B. 2010;145:507–515. [Google Scholar]; q Rochat S, Gao J, Qian X, Zaubitzer F, Severin K. Chem. Eur. J. 2010;16:104–113. doi: 10.1002/chem.200902202. [DOI] [PubMed] [Google Scholar]; r Umali AP, Anslyn EV. Curr. Opin. Chem. Biol. 2010;14:685–692. doi: 10.1016/j.cbpa.2010.07.022. [DOI] [PMC free article] [PubMed] [Google Scholar]; s Carey JR, Suslick KS, Hulkower KI, Imlay JA, Imlay KRC, Ingison CK, Ponder JB, Sen A, Wittrig AE. J. Am. Chem. Soc. 2011;133:7571–7576. doi: 10.1021/ja201634d. [DOI] [PMC free article] [PubMed] [Google Scholar]; t Stewart S, Syrett A, Pothukuchy A, Bhadra S, Ellington A, Anslyn E. ChemBioChem. 2011;12:2021–2024. doi: 10.1002/cbic.201100046. [DOI] [PMC free article] [PubMed] [Google Scholar]
- 2.Kubarych CJ, Adams MM, Anslyn EV. Org Lett. 2010;12:4780–4783. doi: 10.1021/ol101906g. [DOI] [PubMed] [Google Scholar]
- 3.a Stojanović MN, Green EG, Semova S, Nikić DB, Landry DW. J Am. Chem. Soc. 2003;125:6085–6089. doi: 10.1021/ja0289550. [DOI] [PubMed] [Google Scholar]; b Yang KA, Pei R, Stefanovic D, Stojanovic MN. J. Am. Chem. Soc. 2012;134:1642–1647. doi: 10.1021/ja2084256. [DOI] [PubMed] [Google Scholar]; c Green E, Olah MJ, Abramova T, Williams LR, Stefanovic D, Worgall T, Stojanovic MN. J. Am. Chem. Soc. 2006;128:15278–15282. doi: 10.1021/ja0642663. [DOI] [PubMed] [Google Scholar]; d Pei R, Shen A, Olah MJ, Stefanovic D, Worgall T, Stojanovic MN. Chem Commun (Camb) 2009;22:3193–3195. doi: 10.1039/b900001a. [DOI] [PubMed] [Google Scholar]
- 4.Chou SS, De M, Luo J, Rotello VM, Huang J, Dravid VP. J. Am. Chem. Soc. 2012;134:16725–16733. doi: 10.1021/ja306767y. [DOI] [PMC free article] [PubMed] [Google Scholar]
- 5.a Bedeir A, Krasinskas AM. Arch. Pathol. Lab. Med. 2011;135:578–587. doi: 10.5858/2010-0613-RAIR.1. [DOI] [PubMed] [Google Scholar]; b Schumacher JA, Szankasi P, Bahler DW, Ho AK, Kelley TW. J. Clin. Pathol. 2011;64:618–625. doi: 10.1136/jcp.2011.089193. [DOI] [PubMed] [Google Scholar]; c Chiou KR, Charng MJ, Chang HM. Atherosclerosis. 2011;216:383–389. doi: 10.1016/j.atherosclerosis.2011.02.006. [DOI] [PubMed] [Google Scholar]; d Wang Y, Cottman M, Schiffman JD. Cancer Genet. 2012;205:341–355. doi: 10.1016/j.cancergen.2012.06.005. [DOI] [PubMed] [Google Scholar]; e Nepomnyashchaya YN, Artemov AV, Roumiantsev SA, Roumyantsev AG, Zhavoronkov A. Clin. Chem. Lab Med. 2012;29:1–14. doi: 10.1515/cclm-2012-0281. [DOI] [PubMed] [Google Scholar]; f Ahmad A, Iqbal MA. Curr. Med. Chem. 2012;19:3739–3747. doi: 10.2174/092986712801661121. [DOI] [PubMed] [Google Scholar]
- 6.a Tyagi S, Kramer FR. Nature Biotech. 1996;14:303–308. doi: 10.1038/nbt0396-303. [DOI] [PubMed] [Google Scholar]; b Huang K, Martí AA. Anal. Bioanal. Chem. 2012;402:3091–3102. doi: 10.1007/s00216-011-5570-6. [DOI] [PubMed] [Google Scholar]; c Li J, Cao ZC, Tang Z, Wang K, Tan W. Methods Mol Biol. 2008;429:209–224. doi: 10.1007/978-1-60327-040-3_15. [DOI] [PubMed] [Google Scholar]; d Kolpashchikov DM. Scientifica. 2012:ID 928783. doi: 10.6064/2012/928783. 2012. [DOI] [PMC free article] [PubMed] [Google Scholar]
- 7.a El-Hajj HH, Marras SA, Tyagi S, Shashkina E, Kamboj M, Kiehn TE, Glickman MS, Kramer FR, Alland D. J Clin Microbiol. 2009;47:1190–1198. doi: 10.1128/JCM.02043-08. [DOI] [PMC free article] [PubMed] [Google Scholar]; b Chakravorty S, et al. J Clin Microbiol. 2012;50:2194–2202. doi: 10.1128/JCM.00143-12. [DOI] [PMC free article] [PubMed] [Google Scholar]
- 8.Lv C, Yu L, Wang J, Tang X. Bioorg. Med. Chem. Lett. 2010;20:6547–6550. doi: 10.1016/j.bmcl.2010.09.047. [DOI] [PubMed] [Google Scholar]
- 9.a Dirks RM, Pierce NA. Proc. Natl. Acad. Sci. U S A. 2004;101:15275–15278. doi: 10.1073/pnas.0407024101. [DOI] [PMC free article] [PubMed] [Google Scholar]; b Tsourkas A, Behlke MA, Rose SD, Bao G. Nucleic Acids Res. 2003;31:1319–1330. doi: 10.1093/nar/gkg212. [DOI] [PMC free article] [PubMed] [Google Scholar]; d Kolpashchikov DM. Chembiochem. 2009;10:1443–1445. doi: 10.1002/cbic.200900264. [DOI] [PubMed] [Google Scholar]
- 10.a Fu TJ, Seeman NC. Biochemistry. 1993;32:3211–3220. doi: 10.1021/bi00064a003. [DOI] [PubMed] [Google Scholar]; b Kim S, Kim J, Qian P, Shin J, Amin R, Ahn SJ, Labean TH, Kim MK, Park SH. Nanotechnology. 2011;22:245706. doi: 10.1088/0957-4484/22/24/245706. [DOI] [PubMed] [Google Scholar]; c Sa-Ardyen P, Vologodskii AV, Seeman NC. Biophys J. 2003;84:3829–3837. doi: 10.1016/S0006-3495(03)75110-8. [DOI] [PMC free article] [PubMed] [Google Scholar]; d Kolpashchikov DM, Gerasimova YV, Khan MS. Chembiochem. 2011;12:2564–2567. doi: 10.1002/cbic.201100545. [DOI] [PMC free article] [PubMed] [Google Scholar]
- 11.a Pai M, Ramsay A, O'Brien R. PLoS Med. 2008;5:e156. doi: 10.1371/journal.pmed.0050156. [DOI] [PMC free article] [PubMed] [Google Scholar]; b bu-Raddad LJ, Sabatelli L, Achterberg JT, Sugimoto JD, Longini IM, Jr., et al. Proc Natl Acad Sci U S A. 2009;106:13980–13985. doi: 10.1073/pnas.0901720106. [DOI] [PMC free article] [PubMed] [Google Scholar]; c Paramasivan CN, Lee E, Kao K, et al. Int. J. Tuberc. Lung Dis. 2010;14:59–64. [PubMed] [Google Scholar]
- 12.a WHO Anti-Tuberculosis Drug Resistance in the World 2008 [Google Scholar]; b WHO Multidrug and Extensively Drug-Resistant TB (M/XDR-TB) Global Report on Surveillance and Response. 2010 [Google Scholar]
- 13.a Telenti A, Imboden P, Marchesi F, Lowrie D, Cole S, Colston MJ, Matter L, Schopfer K, Bodmer T. Lancet. 1993;341:647–650. doi: 10.1016/0140-6736(93)90417-f. [DOI] [PubMed] [Google Scholar]; b Donnabella V, Martiniuk F, Kinney D, Bacerdo M, Bonk S, Hanna B, Rom WN. Am. J. Respir. Cell Mol. Biol. 1994;11:639–643. doi: 10.1165/ajrcmb.11.6.7946393. [DOI] [PubMed] [Google Scholar]; c Morris S, Bai GH, Suffys P, Portillo-Gomez L, Fairchok M, Rouse D. J. Infect. Dis. 1995;171:954–960. doi: 10.1093/infdis/171.4.954. [DOI] [PubMed] [Google Scholar]; d Helb D, et al. J. Clin. Microbiol. 2010;48:229–237. doi: 10.1128/JCM.01463-09. [DOI] [PMC free article] [PubMed] [Google Scholar]; e El-Hajj HH, Marras SA, Tyagi S, Kramer FR, and D. All. J. Clin. Microbiol. 2001;39:4131–4137. doi: 10.1128/JCM.39.11.4131-4137.2001. [DOI] [PMC free article] [PubMed] [Google Scholar]; f Cooksey RC, Morlock GP, Glickman S, Crawford JT. J. Clin. Microbiol. 1997;35:1281–1283. doi: 10.1128/jcm.35.5.1281-1283.1997. [DOI] [PMC free article] [PubMed] [Google Scholar]; g Troesch A, Nguyen H, Miyada CG. J. Clin. Microbiol. 1999;37:49–55. doi: 10.1128/jcm.37.1.49-55.1999. [DOI] [PMC free article] [PubMed] [Google Scholar]; h Gingeras TR, et al. Genome Res. 1998;8:435–448. doi: 10.1101/gr.8.5.435. [DOI] [PubMed] [Google Scholar]; i Blakemore R, Story E, Helb D, Kop J, Banada P, Owens MR, Chakravorty S, Jones M, Alland D. Clin Microbiol. 2010;48:2495–2501. doi: 10.1128/JCM.00128-10. [DOI] [PMC free article] [PubMed] [Google Scholar]; j Miotto P, Bigoni S, Migliori GB, Matteelli A, Cirillo DM. Eur. Respir. J. 2012;39:1269–1271. doi: 10.1183/09031936.00124711. [DOI] [PubMed] [Google Scholar]; k Armand S, Vanhuls P, Delcroix G, Courcol R, Lemaître N. J. Clin. Microbiol. 2011;49:1772–1776. doi: 10.1128/JCM.02157-10. [DOI] [PMC free article] [PubMed] [Google Scholar]; l Malbruny B, Le Marrec G, Courageux K, Leclercq R, Cattoir V. Int. J. Tuberc. Lung Dis. 2011;15:553–555. doi: 10.5588/ijtld.10.0497. [DOI] [PubMed] [Google Scholar]; m Vadwai V, Boehme C, Nabeta P, Shetty A, Alland D, Rodrigues C. J. Clin. Microbiol. 2011;49:2540–2545. doi: 10.1128/JCM.02319-10. [DOI] [PMC free article] [PubMed] [Google Scholar]; n Gous N, Scott LE, Wong E, Omar T, Venter WD, Stevens W. Clin. Microbiol. 2012;50:2100–2103. doi: 10.1128/JCM.00252-12. [DOI] [PMC free article] [PubMed] [Google Scholar]
- 14.a Cornett EM, O'steen MR, Kolpashchikov DM. PLOS one. 2013;8:e55919. doi: 10.1371/journal.pone.0055919. [DOI] [PMC free article] [PubMed] [Google Scholar]; b Gerasimova YV, Kolpashchikov DM. Biosensors & Bioelectronics. 2013;41:386–390. doi: 10.1016/j.bios.2012.08.058. [DOI] [PMC free article] [PubMed] [Google Scholar]
- 15.a Abdi H, Williams LJ. Wiley Interdisciplinary Reviews: Computational Statistics. 210:2, 433–459. [Google Scholar]; b Shaw PJA. Multivariate statistics for the Environmental Sciences, Hodder-Arnold. 2003 [Google Scholar]
Associated Data
This section collects any data citations, data availability statements, or supplementary materials included in this article.


