

Abstract
It has been suggested that inflammation is important in the aetiology of hypertension and that this may be most relevant among obese persons. To study this, we examined the independent relationships between obesity, inflammation-related proteins (interleukin-6 (IL-6), C-reactive protein (CRP) and fibrinogen) and risk for hypertension in the Multi-Ethnic Study of Atherosclerosis (MESA). Hypertension status, defined as a blood pressure ≥140/90 mm Hg or a history of hypertension and use of blood pressure medications, was determined at baseline and two subsequent exams over 5 years. Among 3543 non-hypertensives at baseline, 714 individuals developed incident hypertension by Exam 3. Cox proportional hazard models were used to determine the relationship between baseline levels of IL-6, CRP and fibrinogen and future risk of hypertension. One s.d. difference in baseline concentration of IL-6, CRP or fibrinogen was associated with 20–40% greater risk of incident hypertension. This risk was attenuated after accounting for other hypertension risk factors (hazard ratio (HR) IL-6: 1.13 (95% CI: 1.04–1.23); CRP: 1.11 (95% CI: 1.02–1.21); fibrinogen 1.0 (95% CI: 0.92–1.08)). Conversely, obesity was an independent risk factor for hypertension risk, minimally impacted by other covariates, including IL-6 and CRP (HR 1.72 (95% CI: 1.36–2.16)). IL-6 and CRP did not modify the relationship between obesity and hypertension, though an adjusted twofold greater risk was observed for obese individuals with a CRP >3 mg l−1 compared with CRP <1 mg l−1. The relationship between inflammation-related proteins and hypertension risk was predominantly explained by other hypertension risk factors. Obesity, independent of inflammation, remained a potent risk factor for future hypertension.
Keywords: inflammation, obesity, blood pressure
Correspondence: Dr SG Lakoski, Department of Internal Medicine/Cardiology, University of Texas Southwestern Medical Center, 5323 Harry Hines Boulevard Dallas, TX 75390, USA. susan.lakoski@utsouthwestern.edu
Introduction
Several studies have documented an independent association between circulating levels of inflammation-related proteins and risk for incident hypertension.1–3 These data have generated important questions about the role of inflammation in the pathogenesis of hypertension and the utility of inflammation-related biomarkers in assessment of hypertension risk. Obesity is also a potent risk factor for hypertension.4–7 However, as obesity is correlated with elevated markers of inflammation,8–10 it remains unclear whether inflammation is a separate and distinct pathophysiological mechanism leading to hypertension or a final common pathway of several antecedent risk factors. A study in younger adults showed that the association between inflammatory biomarker, C-reactive protein (CRP) and hypertension was abolished after adjustment for obesity.11 These results have raised questions as to whether inflammation and obesity reside in the same causal pathway or the association between inflammation and hypertension is simply confounded by obesity. Understanding this relationship between inflammation, obesity and risk for hypertension has great public health importance as it may help clarify the optimal targets to prevent one of the leading causes of death and disability worldwide.
To date, a vast majority of studies have been limited to studying a single inflammatory marker on hypertension risk. In addition, no previous studies have determined the impact of obesity on an inflammation–hypertension relationship among middle-aged and older adults. To this end, we assessed the prospective relationship between well-characterized inflammation-related proteins interleukin-6 (IL-6), CRP and haemostatic factor, fibrinogen, on hypertension risk in middle-aged and older subjects enroled in the Multi-Ethnic Study of Atherosclerosis (MESA), and determined the simultaneous role of obesity and inflammation on hypertension risk.
Methods
MESA is a multi-ethnic longitudinal epidemiological study of 6814 women and men ages 45–84 years initiated in July 2000 to understand the importance of subclinical atherosclerosis measures as well as other factors in individuals without known cardiovascular disease.12 This prospective cohort study includes individuals from six US communities (Baltimore, MD; Chicago, IL; Forsyth County, NC; Los Angeles County, CA; northern Manhattan, NY and St Paul, MN), and consists of 38% White, 28% African-American, 22% Hispanic and 12% Chinese individuals.
Medical history, anthropometric measurements and laboratory data for the present study were taken from the first examination of the MESA cohort (July 2000 to August 2002). Information about age, gender, ethnicity and medical history were obtained by questionnaires. Diabetes was defined as individuals with a fasting glucose of ≥126 mg dl−1 or on prescribed diabetes medication based on 2003 ADA guidelines.13 Smoking history was defined as never, former or current (defined as having smoked a cigarette in the last 30 days). Alcohol use was defined as never, current or former. Medication use was based on clinical staff entry of prescribed medications brought to the visit. Total- and high-density lipoprotein-cholesterol were measured from blood samples obtained after a 12-h fast. Low-density lipoprotein cholesterol was calculated with the Friedewald equation.14
Blood pressure methods and hypertension definition
Resting blood pressure was measured three times in the seated position using a Dinamap model Pro 100 automated oscillometric sphygmomanometer (Critikon, Tampa, Florida) and the average of the second and third readings was recorded. Hypertension was defined as a blood pressure ≥140/90 mm Hg or a history of hypertension and use of blood pressure medications. Participants with hypertension at baseline were excluded from these analyses. Participants with a blood pressure ≥140/90 mm Hg or a history of hypertension and use of blood pressure medications at Exam 2 or Exam 3 were considered to have incident hypertension.
Laboratory methods
Inflammation factor assays were run at the Laboratory for Clinical Biochemistry Research (University of Vermont, Burlington, VT). IL-6 was measured by ultra-sensitive ELISA (Quantikine HS Human IL-6 Immunoassay; R&D Systems, Minneapolis, MN, USA). The lower detection limit was <0.094 pg ml−1 with a detection range of 0.156–10.0 pg ml−1. The coefficient of variation (CV) was 6.3%. CRP and fibrinogen antigen were measured using the BNII nephelometer (N High Sensitivity CRP, N Antiserum to Human Fibrinogen; Dade Behring Inc., Deerfield, IL, USA). CRP intra-assay CVs ranged from 2.3–4.4% and inter-assay CVs ranged from 2.1–5.7%. Fibrinogen intra-assay and inter-assay CVs were 2.7 and 2.6%, respectively.
Statistical analysis
For descriptive analyses across groups, the χ2 test for categorical variables and the t-test or Kruskal–Wallis test (nonparametric measures) for continuous traits were used. Baseline IL-6, CRP and fibrinogen concentrations were analyzed as continuous and categorical variables. The distribution of IL-6, CRP and fibrinogen were skewed, and therefore, log-transformed to fit a normal distribution. Categories for each respective inflammation marker were divided into quartiles based on the distributions at Exam 1.
For the primary analysis we used Cox proportional hazard models to estimate the risk of incident hypertension according to 1–s.d. difference in each respective marker. An adjusted model included age, gender, ethnicity, diabetes, statin therapy, aspirin use, alcohol consumption, smoking history and MESA study site. The final model included body mass index (BMI) or waist circumference (WC) to assess the additional impact of either body composition variable on the overall model estimates. We then determined risk for future hypertension based on quartiles of CRP, IL-6 and fibrinogen. Interaction terms for gender*lnCRP and ethnicity*lnCRP on incident hypertension were assessed in univariate models. Similar interaction terms were used for IL-6 and fibrinogen.
Separate models then determined the independent relationship between BMI or WC on future hypertension risk. As above, Cox proportional hazard modelling was used to estimate the risk of future hypertension according to 1–s.d. difference in BMI or WC. Adjusted models included age, gender, ethnicity, diabetes, statin therapy, aspirin use, alcohol consumption, smoking history and MESA study site. The final model included additional adjustment for both IL-6 and CRP. BMI category defined as normal weight (BMI <25 kg m−2), overweight (25–29 kg m−2) and obese (BMI ≥30 kg m−2) were also utilized.
Last, we explored the joint relationship between BMI and inflammation marker on hypertension risk. As both IL-6 and CRP had similar impact on hypertension, we chose CRP to illustrate this joint relationship. For clinical relevance we chose CRP cut points <1 mg l−1, 1–3 mg l−1 and >3 mg l−1 as categories of interest. Cox proportional hazard modelling was used to estimate the risk of incident hypertension by CRP category within each BMI subgroup (normal, overweight and obese). A statistical interaction between BMI and CRP, assessed as continuous variables, on incident hypertension in univariate models was determined.
Results
Among 3543 non-hypertensives at baseline, 714 individuals (20%) developed incident hypertension by Exam 3. Risk factors for the development of hypertension over a 5-year period included age, diabetes, ethnicity, low high-density lipoprotein cholesterol, high triglycerides, higher BMI and WC (Table 1). In addition, baseline circulating levels of IL-6, CRP and fibrinogen were higher among those who developed hypertension compared with individuals who did not develop hypertension at follow-up.
Table 1.
Baseline characteristics of MESA participants by incident hypertension
| Baseline characteristics |
Incident hypertension
|
P-value | |
|---|---|---|---|
|
No (n=2829) |
Yes (n=714) |
||
| Age (years), n (%) | 58 (10) | 63 (10) | <0.001 |
| Sex, n (%) | 0.40 | ||
| Female | 1439 (51) | 376 (53) | |
| Male | 1390 (49) | 338 (47) | |
| Ethnicity, n (%) | <0.001 | ||
| White | 1281 (45) | 271 (38) | |
| Asian (Chinese descent) | 394 (14) | 76 (11) | |
| African-American | 517 (18) | 196 (27) | |
| Hispanic | 637 (23) | 171 (24) | |
| Diabetes, n (%) | 196 (7) | 96 (13) | <0.001 |
| Smoking, n (%) | 0.30 | ||
| Never | 1439 (51) | 345 (48) | |
| Former | 969 (34) | 268 (38) | |
| Current | 415 (15) | 101 (14) | |
| Statin use, n (%) | 273 (10) | 83 (12) | 0.10 |
| Asprin use, n (%) | 570 (20) | 168 (24) | 0.05 |
| Alcohol use (never), n (%) | 506 (18) | 137 (19) | 0.20 |
| LDL cholesterol (mg dl−1), mean (±s.d.) |
119 (30) | 119 (33) | 0.90 |
| HDL cholesterol (mg dl−1), mean (±s.d.) |
52 (15) | 50 (15) | 0.002 |
| Trigylcerides (mg dl−1), median (IQR) |
105 (79) | 116 (82) | 0.002 |
| Body mass index (kgm−2), mean (±s.d.) |
27 (5) | 29 (6) | <0.001 |
| Waist circumference (cm), median (IQR) |
94 (14) | 100 (14) | <0.001 |
| Interleukin-6 (pg ml−1), median (IQR) |
0.99 (0.9) | 1.24 (1.2) | <0.001 |
| C-reactive protein (mg l−1), median (IQR) |
1.46 (2.7) | 2.2 (4.2) | <0.001 |
| Fibrinogen (mg dl−1), median (IQR) |
325 (86) | 340 (94) | <0.001 |
Abbreviations: HDL, high-density lipoprotein; IQR, interquartile range; LDL, low-density lipoprotein; MESA, Multi-Ethnic Study of Atherosclerosis.
In unadjusted models (Model 1), baseline levels of IL-6, CRP and fibrinogen were associated with a 20–40% higher risk for future hypertension (P<0.001 for all; Figure 1). This risk was attenuated after adjustment for traditional risk factors for hypertension. The addition of BMI into the model further reduced the risk of hypertension for each inflammation marker (hazard ratio (HR) IL-6: 1.13 (95% CI: 1.04–1.23); CRP: 1.11 (95% CI: 1.02–1.21); fibrinogen 1.0 (95% CI: 0.92–1.08)). These results were similar when substituting WC for BMI in these analyses or adjusting for change in BMI.
Figure 1.
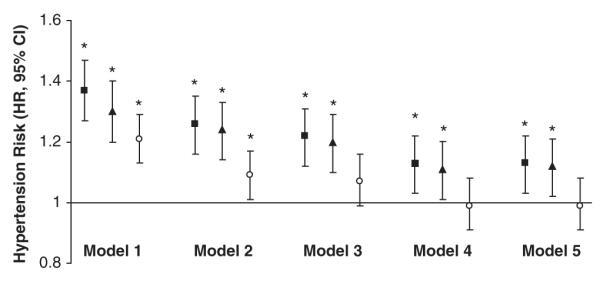
Risk of incident hypertension by baseline circulating levels of interleukin-6, C-reactive protein and fibrinogen. Black square (95% CI)=Risk of incident hypertension comparing 1–s.d. difference (0.67 pg ml−1) in interleukin-6 concentration. Black triangle (95% CI)=Risk of incident hypertension comparing 1–s.d. difference (1.17 mg l−1) in C-reactive protein concentration. White dot (95% CI)=Risk of incident hypertension comparing 1–s.d. difference (0.20 mg dl−1) in fibrinogen concentration. Model 1: unadjusted. Model 2: adjusted for age, gender and ethnicity. Model 3: adjusted for age, gender, ethnicity, smoking, diabetes, statin use, aspirin use, alcohol use and study site. Model 4: Model 3 + body mass index. Model 5: Model 3 + waist circumference. Abbreviations: HR, hazard ratio; CI, confidence interval. *P<0.05.
Next, we assessed the risk of hypertension comparing the highest to lowest quartile of IL-6, CRP and fibrinogen (Table 2). There was a twofold greater incidence of hypertension comparing the highest to lowest quartile of IL-6, with similar odds for CRP and less robust for fibrinogen. This risk was attenuated in adjusted models (HR IL-6 1.49 (95% CI: 1.14–1.95), P=0.01; CRP 1.25 (95% CI: 0.98–1.60), P=0.07); fibrinogen 0.90 (95% CI: 0.92–1.13), P=0.12), with BMI explaining a portion of the risk between inflammation-related proteins and hypertension. The interaction for gender (P=0.84) and ethnicity (P=0.65) between CRP and hypertension risk was not significant and similar for other markers. In addition, inferences were similar by gender and ethnic group when sex and ethnic-specific quartiles of each inflammatory marker were used (data not shown).
Table 2.
Risk of incident hypertension according to quartile of inflammation marker
|
Quartiles of interleukin-6 (IL-6) (pg ml−1)
|
P-value | ||||
|---|---|---|---|---|---|
|
1st (<0.68) N=93 |
2nd (≥0.68<1.05) N=175 |
3rd (≥1.05<1.69) N=197 |
4th (≥1.69) N=225 |
||
| Unadjusted | 1.0 (ref) | 1.89 (1.48–2.44) | 2.31 (1.80–2.95) | 2.69 (2.12–3.43) | <0.001 |
| Adjusted age, gender, ethnicity | 1.0 (ref) | 1.64 (1.27–2.11) | 1.89 (1.47–2.42) | 2.10 (1.64–2.68) | <0.001 |
| Fully adjusted − BMIa | 1.0 (ref) | 1.53 (1.19–1.98) | 1.73 (1.34–2.23) | 1.85 (1.43–2.38) | <0.001 |
| Fully adjusted + BMIa | 1.0 (ref) | 1.44 (1.11–1.86) | 1.54 (1.19–1.99) | 1.49 (1.14–1.95) | 0.01 |
|
Quartiles of C-reactive protein (CRP) (mg l−1)
|
|||||
| 1st (<0.71) | 2nd (≥0.71<1.55) | 3rd (≥1.55<3.69) | 4th (≥3.69) | ||
|
|
|||||
| N=132 | N=162 | N=172 | N=243 | P-value | |
| Unadjusted | 1.0 (ref) | 1.26 (0.99–1.59) | 1.33 (1.06–1.67) | 1.96 (1.58–2.42) | <0.001 |
| Adjusted age, gender, ethnicity | 1.0 (ref) | 1.11 (0.88–1.39) | 1.15 (0.92–1.45) | 1.74 (1.39–2.16) | <0.001 |
| Fully adjusted − BMIa | 1.0 (ref) | 1.06 (0.84–1.34) | 1.09 (0.86–1.38) | 1.55 (1.23–1.94) | <0.001 |
| Fully adjusted + BMIa | 1.0 (ref) | 1.0 (0.79–1.26) | 0.97 (0.77–1.23) | 1.25 (0.98–1.60) | 0.07 |
|
Quartiles of fibrinogen (mg/dl)
|
|||||
| 1st (<294) | 2nd (≥294<337) | 3rd (≥337<388) | 4th (≥388) | ||
|
|
|||||
| N=154 | N=135 | N=205 | N=216 | P-value | |
| Unadjusted | 1.0 (ref) | 0.96 (0.77–1.19) | 1.33 (1.10–1.64) | 1.50 (1.22–1.85) | <0.001 |
| Adjusted age, gender, ethnicity | 1.0 (ref) | 0.84 (0.68–1.05) | 1.14 (0.92–1.40) | 1.13 (0.91–1.40) | 0.02 |
| Fully adjusted − BMIa | 1.0 (ref) | 0.84 (0.67–1.04) | 1.10 (0.90–1.37) | 1.05 (0.85–1.32) | 0.06 |
| Fully adjusted + BMIa | 1.0 (ref) | 0.81 (0.65–1.00) | 1.02 (0.83–1.26) | 0.90 (0.92–1.13) | 0.12 |
Abbreviations: BMI, body mass index; MESA, Multi-Ethnic Study of Atherosclerosis.
Adjusted for age, gender, ethnicity, smoking, diabetes, statin use, aspirin use, alcohol use, MESA study site.
We performed similar analyses when assessing the independent relationship between BMI and WC on future hypertension risk. BMI and WC were associated with a 35–40% higher risk of future hypertension, respectively (P<0.001 for both). Adjusting for age, gender and ethnicity did not alter this risk. Both BMI and WC were independently associated with future hypertension after accounting for standard factors as well as IL-6 and CRP (Table 3). We then assessed the magnitude of the hypertension risk associated among the obese. Obese subjects (BMI≥30 kg m−2) had higher risk of incident hypertension compared with normal weight subjects (HR 1.90 (95% CI: 1.53–2.35), P<0.001) after adjustment for age, gender, ethnicity, diabetes, statin therapy, aspirin use, alcohol consumption, smoking history and MESA study site. The addition of IL-6 and CRP into the fully adjusted model did not significantly alter this relationship (HR 1.72 (95% CI: 1.36–2.16), P<0.001).
Table 3.
Risk of hypertension by baseline measurement of body mass index or waist circumferencea
| Body mass index (kgm−2) | P-value | Waist circumference (cm) | P-value | |
|---|---|---|---|---|
| Unadjusted | 1.34 (1.26–1.43) | <0.001 | 1.39 (1.30–1.49) | <0.001 |
| Adjusted age, gender, ethnicity | 1.36 (1.27–1.46) | <0.001 | 1.36 (1.27–1.46) | <0.001 |
| Fully adjusted−lnIL-6, lnCRPb | 1.30 (1.20–1.39) | <0.001 | 1.29 (1.20–1.39) | <0.001 |
| Fully adjusted+lnIL-6, lnCRPb | 1.24 (1.14–1.34) | <0.001 | 1.23 (1.13–1.33) | <0.001 |
lnIL-6=natural logarithm Interleukin-6.
lnCRP=natural logarithm C-reactive protein.
Per 1–s.d. difference.
Adjusted for age, gender, ethnicity, smoking, diabetes, statin use, aspirin use, alcohol use, Multi-Ethnic Study of Atherosclerosis study site.
From a clinical perspective, we next wanted to assess whether having a high CRP (defined as ≥3 mg l−1) among the obese was associated with greater risk of hypertension compared with obese individuals with low CRP levels. The percentage of subjects who were hypertensive at follow-up was higher among the obese with a CRP >3 mg l−1 (33%) compared with those with CRP 1–3 mg l−1 or CRP <1 mg l−1 at baseline (25% and 17% respectively). In crude models, obese individuals with CRP levels ≥3 mg l−1 had a twofold higher risk compared with obese subjects with a CRP <1 mg l−1 (HR 2.15 (95% CI: 1.33–3.46), P=0.008; Figure 2). This risk was similar after adjustment for age, gender, ethnicity, diabetes, statin therapy, aspirin use, alcohol consumption, smoking history and MESA study site (HR 1.93 (95% CI: 1.18–3.14), P=0.02). A statistical interaction between BMI and CRP in univariable models was not significant (P-value for interaction=0.19).
Figure 2.
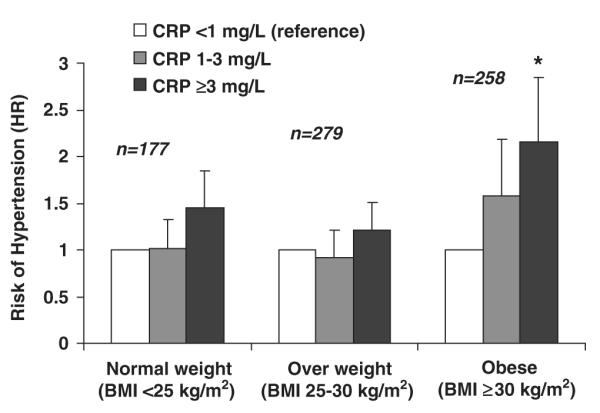
CRP Category among normal, overweight and obese individuals and risk for hypertension in MESA. Abbreviations: HTN, hypertension; BMI, body mass index; CRP, C-reactive protein.
Conclusion
In the present study, we expanded previous findings by measuring baseline concentrations of IL-6, CRP and fibrinogen and assessed the independent and joint relationships between inflammation, obesity and hypertension risk. We saw modest impact of inflammation alone on hypertension risk. As expected, obesity was a powerful driver of hypertension risk independent of other risk factors, including IL-6 and CRP. The combination of being both obese and inflamed (CRP≥3 mg l−1) was associated with higher risk for hypertension compared with being obese and not inflamed (CRP<1 mg l−1), though obesity did not modify the relationship between CRP and hypertension risk.
Associations between CRP and hypertension have been previously reported.1,2,11,15–17 Studies assessing fibrinogen and hypertension risk have also been demonstrated, predominately in men.18,19 One previous study by Sesso et al.16 found two inflammatory markers, IL-6 and CRP, to be associated with a higher risk for hypertension in women. However, no study before the current findings had comprehensively studied inflammatory markers, IL-6 and CRP, and fibrinogen on hypertension risk.
In addition to simultaneously studying several important biomarkers for future hypertension risk, the current study expanded our original findings concerning the impact of obesity on an inflammation–hypertension relationship. In a study of younger adults, we concluded the relationship between CRP and risk for hypertension was attenuated and no longer statistically significant after adjustment for BMI.11 We did not assess other inflammatory or haemostatic factors on hypertension risk nor did we determine the impact of CRP and hypertension risk across clinically important BMI categories. In addition, we were limited in studying young adults, not middle-aged and older adults who are at higher risk for hypertension, and may immediately benefit from biomarker risk assessment.
Previously, we had proposed that an inflammation–hypertension relationship was due to either confounding by BMI or a common pathway between inflammation and BMI leading to hypertension.11 Biologically, the latter is supported in the literature. The renin–angiotensin system is a well-recognized pathway leading to hypertension. Previous studies have demonstrated renin–angiotensin system activity in adipose tissue.20 Renin–angiotensin system can subsequently upregulate inflammatory processes including the nuclear factor-kB pathway, which has a host of functions including inflammatory cytokine release and production of reactive oxygen species.21 In addition, adipocytes secrete inflammatory mediators such as IL-6, which can act as regulators of insulin action,22 another key mechanism for hypertension through increased sympathetic nervous activity and sodium retention.23 Other mediators such as leptin and free fatty acids, related to an obese phenotype, have also been implicated in hypertension through activation of the sympathetic nervous system.24
Although there is support for a biological pathway between inflammation, obesity and hypertension, our epidemiological data did not support a strong role for inflammatory markers IL-6, CRP or fibrinogen in predicting hypertension risk independent of other risk factors. In addition, our data demonstrate that obesity drives hypertension and was minimally impacted by IL-6 or CRP. Of note, the combination of being both obese and inflamed was more strongly associated with hypertension risk. However, although inflammation may be one potential pathway between obesity and hypertension, an obesity–hypertension relationship is clearly influenced by multiple mechanisms.25–27
There are limitations and strengths to the current study. IL-6, CRP and fibrinogen were measured at a single time point, and therefore, associations could be underestimated because of within-individual variability of these measures. In addition, our results are limited to the study of established inflammatory markers IL-6, CRP and fibrinogen. We cannot exclude that other inflammatory markers or haemostatic factors may have a different impact on hypertension risk. A few strengths of the current study include systematic measurement of blood pressure and a robust sample size to assess risk factors related to incident hypertension.
Perspectives
Clinically speaking, should CRP be measured to enhance risk stratification for hypertension among obese individuals? Our data show that an obese, inflamed state is more strongly associated with hypertension risk than the obese, non-inflamed. However, statistically, neither CRP nor IL-6 modified the relationship between obesity and hypertension. In addition, although these results are interesting, the present study was not geared to definitively answer this question. First and foremost, the current study tells us most about the interrelationship and pathway between obesity, inflammation, and risk for hypertension. These findings must be taken to more basic level of science to unravel the true mechanistic relationship and combination of factors most influential in this complex disease.
What is known about topic
Both inflammation and body mass index are related to systolic blood pressure and future hypertension risk.
What this study adds
Body mass index is a stronger predictor of future hypertension risk than inflammation markers C-reactive protein, interleukin-6 or fibrinogen.
Though inflammation and body mass index are interrelated in the disease process, measuring both body mass index and C-reactive protein does not modify risk for hypertension.
Acknowledgements
We thank the other investigators, the staff and the participants of the MESA study for their valuable contributions. A full list of participating MESA investigators and institutions can be found at http://www.mesa-nhlbi.org. Source of Funding: This research was supported by contracts N01-HC-95159 through N01-HC-95166 and Grant NHLBI T32 HL076132-01 from the National Heart, Lung and Blood Institute.
Footnotes
Conflict of interest The authors declare no conflict of interest.
References
- 1.Niskanen L, Laaksonen DE, Nyyssonen K, Punnonen K, Valkonen VP, Fuentes R, et al. Inflammation, abdominal obesity, and smoking as predictors of hypertension. Hypertension. 2004;44(6):859–865. doi: 10.1161/01.HYP.0000146691.51307.84. [DOI] [PubMed] [Google Scholar]
- 2.Sesso HD, Buring JE, Rifai N, Blake GJ, Gaziano JM, Ridker PM. C-reactive protein and the risk of developing hypertension. JAMA. 2003;290(22):2945–2951. doi: 10.1001/jama.290.22.2945. [DOI] [PubMed] [Google Scholar]
- 3.Blake GJ, Rifai N, Buring JE, Ridker PM. Blood pressure, C-reactive protein, and risk of future cardiovascular events. Circulation. 2003;108(24):2993–2999. doi: 10.1161/01.CIR.0000104566.10178.AF. [DOI] [PubMed] [Google Scholar]
- 4.Cassano PA, Segal MR, Vokonas PS, Weiss ST. Body fat distribution, blood pressure, and hypertension. A prospective cohort study of men in the normative aging study. Ann Epidemiol. 1990;1(1):33–48. doi: 10.1016/1047-2797(90)90017-m. [DOI] [PubMed] [Google Scholar]
- 5.Garrison RJ, Kannel WB, Stokes J, III, Castelli WP. Incidence and precursors of hypertension in young adults: the Framingham Offspring Study. Prev Med. 1987;16(2):235–251. doi: 10.1016/0091-7435(87)90087-9. [DOI] [PubMed] [Google Scholar]
- 6.Huang Z, Willett WC, Manson JE, Rosner B, Stampfer MJ, Speizer FE, et al. Body weight, weight change, and risk for hypertension in women. Ann Intern Med. 1998;128(2):81–88. doi: 10.7326/0003-4819-128-2-199801150-00001. [DOI] [PubMed] [Google Scholar]
- 7.Gelber RP, Gaziano JM, Manson JE, Buring JE, Sesso HD. A prospective study of body mass index and the risk of developing hypertension in men. Am J Hypertens. 2007;20(4):370–377. doi: 10.1016/j.amjhyper.2006.10.011. [DOI] [PMC free article] [PubMed] [Google Scholar]
- 8.Visser M, Bouter LM, McQuillan GM, Wener MH, Harris TB. Elevated C-reactive protein levels in overweight and obese adults. JAMA. 1999;282(22):2131–2135. doi: 10.1001/jama.282.22.2131. [DOI] [PubMed] [Google Scholar]
- 9.Greenberg AS, Obin MS. Obesity and the role of adipose tissue in inflammation and metabolism. Am J Clin Nutr. 2006;83(2):461S–465S. doi: 10.1093/ajcn/83.2.461S. [DOI] [PubMed] [Google Scholar]
- 10.Wee CC, Mukamal KJ, Huang A, Davis RB, McCarthy EP, Mittleman MA. Obesity and C-reactive protein levels among white, black, and hispanic US adults. Obesity (Silver Spring) 2008;16(4):875–880. doi: 10.1038/oby.2008.7. [DOI] [PMC free article] [PubMed] [Google Scholar]
- 11.Lakoski SG, Herrington DM, Siscovick DM, Hulley SB. C-reactive protein concentration and incident hypertension in young adults: the CARDIA study. Arch Intern Med. 2006;166(3):345–349. doi: 10.1001/archinte.166.3.345. [DOI] [PubMed] [Google Scholar]
- 12.Bild DE, Bluemke DA, Burke GL, Detrano R, Diez Roux AV, Folsom AR, et al. Multi-ethnic study of atherosclerosis: objectives and design. Am J Epidemiol. 2002;156(9):871–881. doi: 10.1093/aje/kwf113. [DOI] [PubMed] [Google Scholar]
- 13.Genuth S, Alberti KG, Bennett P, Buse J, Defronzo R, Kahn R, et al. Follow-up report on the diagnosis of diabetes mellitus. Diabetes Care. 2003;26(11):3160–3167. doi: 10.2337/diacare.26.11.3160. [DOI] [PubMed] [Google Scholar]
- 14.Friedewald WT, Levy RI, Fredrickson DS. Estimation of the concentration of low-density lipoprotein cholesterol in plasma, without use of the preparative ultracentrifuge. Clin Chem. 1972;18(6):499–502. [PubMed] [Google Scholar]
- 15.Lakoski SG, Cushman M, Palmas W, Blumenthal R, D’Agostino RB., Jr Herrington DM. The relationship between blood pressure and C-reactive protein in the Multi-Ethnic Study of Atherosclerosis (MESA) J Am Coll Cardiol. 2005;46(10):1869–1874. doi: 10.1016/j.jacc.2005.07.050. [DOI] [PubMed] [Google Scholar]
- 16.Sesso HD, Wang L, Buring JE, Ridker PM, Gaziano JM. Comparison of interleukin-6 and C-reactive protein for the risk of developing hypertension in women. Hypertension. 2007;49(2):304–310. doi: 10.1161/01.HYP.0000252664.24294.ff. [DOI] [PubMed] [Google Scholar]
- 17.Bautista LE, Vera LM, Arenas IA, Gamarra G. Independent association between inflammatory markers (C-reactive protein, interleukin-6, and TNF-alpha) and essential hypertension. J Hum Hypertens. 2005;19(2):149–154. doi: 10.1038/sj.jhh.1001785. [DOI] [PubMed] [Google Scholar]
- 18.Folsom AR, Peacock JM, Nieto FJ, Rosamond WD, Eigenbrodt ML, Davis CE, et al. Plasma fibrinogen and incident hypertension in the Atherosclerosis Risk in Communities (ARIC) Study. J Hypertens. 1998;16(11):1579–1583. doi: 10.1097/00004872-199816110-00003. [DOI] [PubMed] [Google Scholar]
- 19.Shankar A, Wang JJ, Rochtchina E, Mitchell P. Positive association between plasma fibrinogen level and incident hypertension among men: population-based cohort study. Hypertension. 2006;48(6):1043–1049. doi: 10.1161/01.HYP.0000245700.13817.3c. [DOI] [PubMed] [Google Scholar]
- 20.Engeli S, Negrel R, Sharma AM. Physiology and pathophysiology of the adipose tissue renin-angiotensin system. Hypertension. 2000;35(6):1270–1277. doi: 10.1161/01.hyp.35.6.1270. [DOI] [PubMed] [Google Scholar]
- 21.Brasier AR, Recinos A, III, Eledrisi MS. Vascular inflammation and the renin-angiotensin system. Arterioscler Thromb Vasc Biol. 2002;22(8):1257–1266. doi: 10.1161/01.atv.0000021412.56621.a2. [DOI] [PubMed] [Google Scholar]
- 22.Yudkin JS. Adipose tissue, insulin action and vascular disease: inflammatory signals. Int J Obes Relat Metab Disord. 2003;27(Suppl 3):S25–S28. doi: 10.1038/sj.ijo.0802496. [DOI] [PubMed] [Google Scholar]
- 23.Kaplan NM. Kaplan’s Clinical Hypertension. 8th edn. Lippincott Williams & Williams; Philadelphia: 2002. [Google Scholar]
- 24.Rahmouni K, Correia ML, Haynes WG, Mark AL. Obesity-associated hypertension: new insights into mechanisms. Hypertension. 2005;45(1):9–14. doi: 10.1161/01.HYP.0000151325.83008.b4. [DOI] [PubMed] [Google Scholar]
- 25.Reaven GM, Lithell H, Landsberg L. Hypertension and associated metabolic abnormalities–the role of insulin resistance and the sympathoadrenal system. N Engl J Med. 1996;334(6):374–381. doi: 10.1056/NEJM199602083340607. [DOI] [PubMed] [Google Scholar]
- 26.Landsberg L. Diet, obesity and hypertension: an hypothesis involving insulin, the sympathetic nervous system, and adaptive thermogenesis. Q J Med. 1986;61(236):1081–1090. [PubMed] [Google Scholar]
- 27.Tuck ML. Obesity, the sympathetic nervous system, and essential hypertension. Hypertension. 1992;19(1 Suppl):I67–I77. doi: 10.1161/01.hyp.19.1_suppl.i67. [DOI] [PubMed] [Google Scholar]