

Abstract
During manufacture, therapeutic proteins may be exposed to ultraviolet (UV) radiation. Such exposure is of concern because UV radiation may cause photooxidative damage to proteins, which in turn could lead to physical changes such as aggregation and enhanced immunogenicity. We exposed murine growth hormone (mGH) to controlled doses of UV radiation, and examined the resulting chemical, physical and immunogenic changes in the protein. mGH chemical structure was analyzed by mass spectrometry after UV irradiation. Photooxidation products detected by mass spectrometry included methionine sulfoxide formed at Met[127] and Met[149] residues, and, tentatively assigned by MS/MS analysis, ether cross-links between original Ser[78] and Cys[188], and Cys[206] and Ser[213], and a thioether cross-link between Cys[17] and Cys[78] residues, transformation of Cys[189] into Ala, and various hydrolytic fragments. Physical damage to UV-irradiated mGH was monitored by infrared spectrometry, chromatographic analyses, and particle counting by microflow imaging. UV radiation caused mGH to aggregate, forming insoluble microparticles containing mGH with non-native secondary structure. When administered subcutaneously to Balb/c or Nude Balb/c mice, UV-irradiated mGH provoked antibodies that cross-reacted with unmodified mGH in a fashion consistent with a T-cell dependent immune response. In wildtype Balb/c mice, titers for anti-mGH IgG1antibodies increased with increasing UV radiation doses.
Keywords: Photoirradiation, immunogenicity, protein aggregation, growth hormone
Introduction
Therapeutic proteins are known to aggregate in response to common stresses that may be encountered throughout their product life cycle. Ultraviolet (UV) light is one such stress to which therapeutic proteins may be exposed during processing, storage and consumer use. In addition, it has been proposed that biotechnology products be exposed to UV irradiation for viral decontamination. [1] UV exposure can also occur during storage and consumer use if products are not completely isolated from light.
Proteins may be chemically damaged when exposed to light (for a review of light-induced chemical damage pathways, see Kerwin et al., 2007) [2]. In turn, chemically damaged protein molecules may have a greater propensity to aggregate. [3, 4] Chemically degraded proteins may be immunogenic [5, 6] and protein impurities at levels < 1% may induce immune responses. [7] Furthermore, aggregated proteins have long been known to be immunogenic in humans [8–11], and more recently aggregation of therapeutic proteins and immunogenicity have been associated in a number of studies conducted in mice. [7, 12, 13] Another recent study [14] showed that exposure of naive human peripheral blood mononuclear cells to aggregated therapeutic antibodies stimulated their innate immune response.
We hypothesize that exposure of therapeutic proteins to UV light could lead not only to their photodegradation, but also to aggregation and concomitant enhancements in their immunogenic potential.
In this study, we exposed murine growth hormone (mGH) to UV light, characterized the products of photodegradation by mass spectroscopy and measured the resulting levels of protein aggregates. In addition, we performed in-vivo testing of the immunogenicity of samples of mGH exposed to UV at λ = 254 nm for various intervals of time by measuring levels of antibodies produced that were cross-reactive against unmodified mGH. To gain insight into the role of T-cells in the immune responses to photodegraded mGH, we tested the immunogenicity in both Balb/c and T-cell deficient Nude Balb/c mice.
Materials and Methods
Materials
mGH was produced recombinantly in E. coli and purified as described previously. [15] Limulus Amebocyte Lysate (LAL) tests were performed to ensure the purified mGH had endotoxin levels below the preclinical USP endotoxin limit of 5 EU/kg. [16] VETone™ saline for injection, lot 7J004 (MWI Veterinary Supply, Meridian, ID) was purchased from the University of Colorado apothecary. 4-hydroxy-3-nitrophenylacetic hapten conjugated to aminoethylcarboxymethyl-Ficoll (NP28-Ficoll) (F1420-10 lot 021292-03), 4-hydroxy-3-nitrophenylacetic hapten conjugated to chicken gamma globulin (NP39-CGG) (N5055-5, lot 028021-06) and 4-hydroxy-3-nitrophenylacetic hapten conjugated to bovine serum albumin (NP14-BSA) (N5050-10, lot 025060-04) were purchased from Biosearch Technologies (Novato, CA). Goat anti-mouse IgG1 (ab9165, lot 862097), goat anti-mouse IgG3 (ab9166, lot 892368), goat anti-mouse IgM (ab9167, lot 815738) and HRP conjugated rabbit anti-goat IgG (ab6741, lot 871673) were purchased from Abcam (Cambridge, MA). 3,3′,5,5′ tetramethylbenzidine was purchased from KPL (Gaithersburg, MD). All other reagents were from Fisher Scientific (Pittsburgh, PA).
Sample Preparation
A stock preparation of mGH (0.26 mg/ml) in acetate buffer pH 4.75 was stored at 4 °C and was used to prepare all samples of mGH. For photo-irradiation, the samples were placed in quartz tubes. The headspaces above the samples were gently flushed with Ar prior to photoirradiation. mGH was exposed to ultraviolet light at λ = 254 nm with a dose rate of 4.93 × 10⁻⁸ einstein s−1 (UVLMS-38 EL Series 3-UV lamps, 8-watt, UVP Upland, CA) for 10, 30 and 60 minute intervals. All samples were kept at 4 °C or aliquoted and stored at −20 °C. The geometry of a representative sample was a cylinder with a diameter of 1 cm and a height of 1 cm. The irradiated surface area (half of the sides + top of the cylinder) was 2.35 cm2. An 8 Watt lamp emits 2.22 × 10¹⁹ photons s−1. Our actinometry measurements show that only 4.93 × 10⁻⁸ einstein s−1 (or 2.97 × 10¹⁶ photons s−1) are going through the solution. Therefore the solution is exposed to 0.012 W per 2.35 cm2, or 51 W m−2. Thus, 10, 30, and 60 minutes of exposure correspond to 8.5 Wh m−2, 25.5 Wh m−2, 51 Wh m−2, respectively. The limit of irradiance in the ICH Q1B is 200 Wh m−2.
Size Exclusion High Performance Liquid Chromatography
Size-exclusion high performance liquid chromatography (SE-HPLC) analysis was conducted using a Superdex™ 75 10/300 GL column on an Agilent 1100 series HPLC system (Agilent Technologies, Inc., Santa Clara, CA, USA). Samples were centrifuged at 1,700 g for 5 minutes prior to injection. Triplicate 100 μl injections of each sample were analyzed. Isocratic chromatography was performed at room temperature with a flow rate of 0.8 ml/min using phosphate buffered saline pH 7.4 as the mobile phase. UV absorbance at 280 nm was monitored using the Agilent UV diode array detector for 50 minutes. The chromatograms were analyzed in Chemstation software (Agilent Technologies, Inc., Santa Clara, CA, USA) by integration to determine areas for respective peaks. Peak area percentages are reported relative to stock sample peak areas as calculated by:
| (1) |
Peak area percentages of insoluble aggregates determined by mass balance:
| (2) |
95 % confidence intervals were calculated from the triplicate injections of each sample on the SE-HPLC. SE-HPLC analysis was performed throughout the course of the study to ensure that aggregate content did not change during intermediate storage before animal studies or further characterization experiments were conducted.
Particle Analysis
Particle analysis was performed using Micro-Flow Imaging™ on a DPA 4100 (Brightwell Technologies, Inc., Ottawa, Ontario, Canada) as described earlier. [7] Briefly, in order to obtain a clean baseline and optimize illumination, water was filtered through a 0.2 micron filter and used to flush the system prior to sample analysis. Three aliquots (0.5 ml) of each preparation were analyzed at a flow rate of 0.1 ml/min through a high magnification flow cell using the “set-point 3” configuration, which allows detection of particles 1–50 μm. Prior to analysis, samples were slowly inverted 10 times to ensure suspension of particles. Negative controls using protein-free buffer were also analyzed to eliminate any buffer influence on particle detection. The data obtained were number counts per volume per 0.25 micron diameter size bins.
Infrared Spectroscopy
Infrared spectra for insoluble aggregates of mGH formed by ultraviolet exposure were acquired using a Bomem™ IR spectrometer (Quebec, Canada) and a deuterized triglycine sulfate KBr detector. A variable path length CaF2 cell was used for all the measurements. Suspensions were centrifuged at 1,700 g for 5 minutes and the supernatant removed. Aggregates were resuspended in buffer to ensure analysis of aggregates only. Buffer corrections were made by subtracting spectra measured on buffer samples. The methods used to obtain and analyze spectra have been described previously. [17] All mathematical manipulations of spectra were performed in GRAMS software (Thermo Electron Corp., Waltham, MA).
Reverse-Phase High Performance Liquid Chromatography
Reverse-phase high performance liquid chromatography (RP-HPLC) experiments were conducted using a Jupiter 300Å 5 μm C4 column (Phenomenex, Torrance, CA) on an Agilent 1100 series HPLC system (Agilent Technologies, Inc., Santa Clara, CA, USA). Samples were centrifuged at 1,700 g for 5 minutes prior to injection. 100 μl injections of each sample were analyzed in triplicate. Mobile phase A was water containing 0.1% trifluoroacetic acid, and mobile phase B was acetonitrile containing 0.1% trifluoroacetic acid. The column was equilibrated for 10 minutes at 100% mobile phase A followed by a linear gradient from 0 to 100% mobile phase B over 45 minutes; followed by 10 minutes of 100% B to wash any remaining protein from the column. UV absorbance at 214 nm was monitored using the Agilent UV diode array detector for 65 minutes. The chromatograms were analyzed in Chemstation software (Agilent Technologies, Inc., Santa Clara, CA, USA) by integration to determine areas for respective peaks.
Sample Preparation for Mass Spectroscopy
After photo-irradiation the samples were diluted (1/10) by mixing 100 μL of each with 900 μL ammonium bicarbonate buffer (50 mM, pH 8.0) containing DTT (500 μM). The samples were incubated at 45°C for 30 min. The final samples were diluted (1/10) in 900 μL of a digestion buffer consisting of 0.1 μg/μL of trypsin in ammonium bicarbonate buffer (50 mM, pH 8.0). The samples were incubated at 37°C overnight.
Mass Spectrometry
Capillary UPLC-ESI-MS data were obtained by means of a UPLC Acquity Chromatographer (Waters, Milford, MA) combined with a Q-TOF-2 (Micromass Ltd., Manchester, U.K.) hybrid mass spectrometer operated in the MS1 mode and acquiring data with the time-of-flight analyzer. The instrument was operated for maximum resolution with all lenses optimized on the [M + 2H]2+ ion from the cyclic peptide Gramicidin S. The cone voltage was 35 V and Ar was admitted to the collision cell at a pressure that attenuates the beam to about 20% and the cell was operated at 12 eV (maximum transmission). Spectra were acquired at 16,129 Hz pusher frequency covering the mass range 350–2000 amu (amu = atomic mass unit) and accumulating data for 3 sec per cycle. Time to mass calibration was made with CsI cluster ions acquired under the same conditions.
On the Q-TOF-2, the samples were injected onto the capillary column (C18, 250 × 0.5 mm, Vydac, Grace, Deerfield, IL), and eluted with a linear gradient delivered at a rate of 50 μL min-1. Mobile phases consisted of water/formic acid at a ratio of 99.9%, 0.1% (v:v) for solvent A and acetonitrile/formic acid at a ratio of 99.9%, 0.1% (v:v) for solvent B. The following gradient was set: 99% of solvent A for 1 min, followed by an increase of solvent B from 1 to 65% within 190 minutes.
MS/MS spectra of peptides were re-analyzed by means of an LTQ-FT hybrid linear quadrupole ion trap Fourier transform ion cyclotron resonance (FT-ICR) mass spectrometer (Thermo-Finnigan, Bremen, Germany) [18]. Peptides were separated on a reverse-phase LC Packings PepMap C18 column (0.300 × 150 mm, Dionex, Thermo Scientific, West Palm Beach, FL) at a flow rate 10 μL/min with a linear gradient rising from 0 to 65% acetonitrile in 0.06% aqueous formic acid over a period of 55 min using LC Packing Ultimate Chromatograph (Dionex, Thermo Scientific, West Palm Beach, FL). LC-MS experiments were performed in a data-dependent acquisition manner using Xcalibur 2.0 software (Thermo Scientific, West Palm Beach, FL). Five most intensive precursor ions in a survey MS1 mass spectrum acquired in the Fourier transform-ion cyclotron resonance over a mass range of 300–2000 m/z were selected and fragmented in the linear ion trap by collision-induced dissociation. The ion selection threshold was 500 counts.
The MS/MS spectra were analyzed with the software MassMatrix. [19–22] MassMatrix was used to generate the theoretical fragment tables of the b and y ions of the different oxidized and cross-linked products. The theoretical fragments were compared to the experimental MS/MS spectra to validate the structures, which were taken into consideration only if the difference between the theoretical and the experimental m/z of the parent ion (and the fragment ions) was strictly below 0.1 Da. Collision-induced dissociation (CID) of the peptide ions was acquired after an attenuation of the parent ion of 35%. The mass window to collect the parent ion was fixed to 0.1 Da.
Immunogenicity testing in animals
All animal experiments were approved by the institutional animal care and use committee (IACUC). The animals were housed in sterile, air-filtered cages with food ad libitum. Four animals were housed per cage and were marked with ear tags.
All samples were tested for immunogenicity in adult (≥ 6 weeks of age) Balb/c or Nude Balb/c mice (Charles River, Wilmington, MA). At the start of the study, Day 1, blood was obtained from the retro-venous orbital from the mice so that each mouse served as its own baseline. For five days a week for three weeks (Days 1–5, Days 8–12, Days 15–19), groups of 8 mice were then given subcutaneous injections of 2 μg of mGH diluted in saline for injection. This dosing schedule was chosen to roughly mimic the typical dosing schedule used in human patients who are injected 6 days per week at a dose of ca. 0.3 mg/kg/week. One group of mice received injections of 5 μg of NP-CGG, an antigen known to provoke T-cell dependent immune responses, [23] and another group received injections of 5 μg NP-Ficoll, an antigen that provokes direct B-cell responses that are T-cell independent. [24–27] Mice were bled through the retro-venous orbit on days 8, 22, 39 and 50.
Antibody Assay
The collected sera were tested for IgG1-, IgG3- and IgM-specific antibody responses using an enzyme-linked immunoassay (ELISA), as described previously7. The wells of Immulon 4 High Binding Affinity plates (ISC Bioexpress, Kaysville, UT) were incubated with 100 μl of diluted stock mGH (10 μg/ml) or 100 μl of NP-BSA standard (10 μg/ml) at lab temperature overnight with gentle agitation. The wells were then drained and washed three times with PBS containing 0.05% polysorbate 20. After the final wash, the wells were tapped dry on a paper towel. The wells were then blocked with 300 μl of 2% bovine serum albumin (BSA) in PBS for 1 hour. After incubation with the blocking solution, the wells were washed three times with a solution of PBS containing 0.05% polysorbate 20. Wells in rows A-H were then loaded with 50 μl of 1 M Tris, pH 9.5. Serum samples were incubated for 1 hr in 300mM acetic acid, and then 50 μl aliquots were diluted 1:50 into the 50 μl of Tris pH9.5 in row A. Using a multichannel pipette, 50 μl of the diluted sera from row A were transferred to the wells in row B. The solution in row B was then mixed by drawing up and expelling 50 μl (5 times) into the wells before transferring 50 μl to wells in row C. The 2X dilutions were continued through row G. The plates were then sealed and allowed to incubate at lab temperature for 60 minutes. Then, the wells were washed five times with a solution of 0.05% polysorbate 20 in PBS and tapped dry on a paper towel. The wells were incubated with 50 μl of a goat polyclonal antibody specific to mouse IgG1 (Abcam, ab9165), mouse IgM (Abcam ab9167) or mouse IgG3 (Abcam, ab9166) diluted 1/5000 in PBS with 0.05% polysorbate 20. After 1 hour, the wells were washed five times with 0.05% polysorbate 20 in PBS and tapped dry on a paper towel. The wells were subsequently incubated with 50 μl of horse radish peroxidase conjugated rabbit polyclonal to goat IgG (Abcam, ab6741) diluted 1/5000 in PBS, 0.05% polysorbate 20 for 60 minutes. The plates were then washed five times with 0.05% polysorbate 20 in PBS and tapped dry, followed by the addition of 50 μl of 3,3′,5,5′ tetramethylbenzidine to each well. After 20 minutes, 30 μl of 0.5 M sulfuric acid was added to the wells to stop the reaction. The absorbance was recorded with a Molecular Devices (Sunnyvale, CA) “V max” kinetic plate reader at a wavelength of 450 nm and a reference wavelength of 595 nm. Sera were determined to be positive for immune response if the absorbance at a dilution of 1/20 was greater than or equal to two times the absorbance readings from 1/20 dilutions of serum taken at day 1 prior to any mGH administration. The ELISA responses for positive sera are reported in titers. Titers were determined by serial dilutions of positive sera until absorbance readings were less than or equal to two times the absorbance reading for initial day 1 values. Non-responders were assigned a titer value of 20 and all values for animals (n=8) were averaged for data analysis. Statistical analysis was performed using a Kruskal-Wallis non-parametric one-way ANOVA test. When comparing means, probabilities of [p] < 0.1 were significant based on the 90 % confidence interval chosen.
Results
Identification of the photoproducts by mass spectrometry
Seven different photoproducts (referred as products 1, 2, 3a, 3b, 4, 5a, 5b) were detected and tentatively characterized by mass spectrometry. The LC-MS analyses of the non-irradiated and the irradiated samples are presented in the Supplementary Information (Figure S1). The mass spectra and the discussion of the fragmentation patterns are presented in the Supplementary Information (Figures S2–S9). The amino acid residues involved in the different photoproducts are labeled in the sequence of mGH (Chart 1). In brief, when mGH was exposed to UV, we observed the formation of methionine sulfoxide at Met[127] (product 1) and at Met[149] (product 2). Our mass spectrometry analysis also suggests that Cys[78] and Ser[188] or Cys[78] and Cys[189] could be connected through an ether or a thioether bond, respectively (products 3a and 3b). The transformation of Cys[189] into Ala[189] was observed (product 4). The residues Cys[206] and Ser[213] or Cys[206] and Cys[214] are probably cross-linked through an ether or a thioether bond (products 5a and 5b). In addition to the modifications observed on the side chains of the Met, Cys and Ser residues, we also observed the hydrolysis of the peptide bonds between residues Asn[124]/Ser[125] and Gln[146]/Ala[147] (Figures S7 and S8).
Chart 1.

Sequence of mGH. The red colored residues indicate modification of the side chain. The green colored residues indicate the site of an hydrolysis of the peptide bond.
SE-HPLC
Soluble aggregates were not detectable by SE-HPLC in any of the mGH preparations, including the untreated mGH control. Insoluble aggregates were removed by centrifugation, and the remaining monomer in the supernatant was quantified by SE-HPLC (Figure 1). Irradiated samples were visually cloudy and pellets were observed upon centrifugation. By mass balance, any loss of monomer was then assigned to insoluble aggregates. The loss of monomeric mGH (and hence the level of insoluble aggregates) increased with exposure time to ultraviolet radiation. The monomer loss after 10 minutes of UV exposure was 12% in comparison to the untreated mGH control. The increased exposure times of 30 and 60 minutes resulted in monomer losses of 50% and 69% respectively. The error of calculated monomer losses from triplicate injections was equal to or less than 3%.
Figure 1.
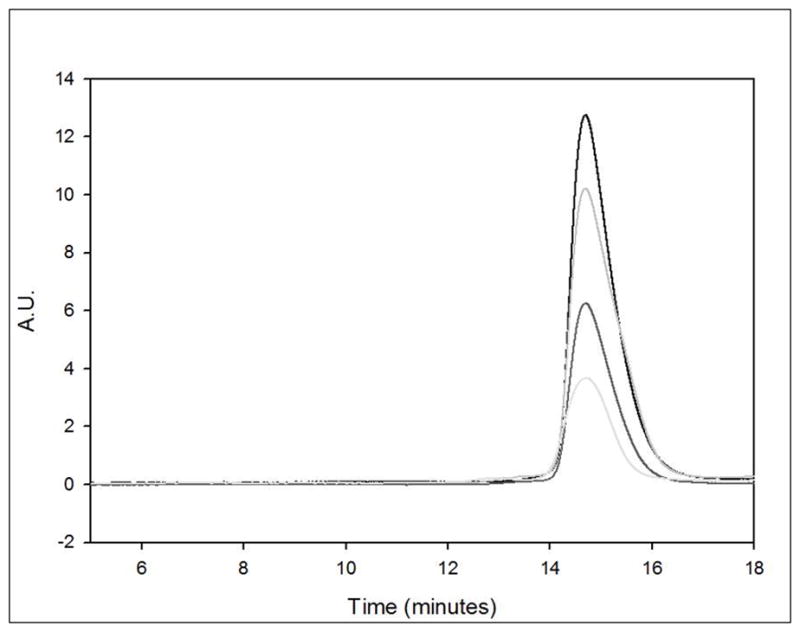
Size exclusion chromatogram for mGH stock and mGH exposed to λ = 254 nm for 10, 30 and 60 minutes represented by black, medium grey, dark grey and light grey lines, respectively.
Particle Analysis
The counts of particles of sizes from 1 to 50 micron were determined for the mGH stock and mGH treated with UV. The total number of particles for the mGH stock was 238 ± 293 particles/ml. Exposure of mGH to UV radiation for 10, 30 and 60 minutes resulted in increases in particle counts per ml to 12,900 ± 200, 20,000 ± 300 and 31,100 ± 700, respectively. The distributions of particle counts for each sample are shown in Figure 2. Before exposure to UV irradiation, only particles ≤ 10 micron in size were detectable in the mGH stock samples. After UV irradiation, the samples had significant increases in the number of particles less than 10 microns in diameter, as well as significant increases in number counts of particles greater than 10 microns in diameter.
Figure 2.

Particle counts for mGH stock (A), and ultraviolet irradiated mGH stock for 10 (B), 30 (C) and 60 (D) minutes.
RP-HPLC
Reverse phase high performance liquid chromatographic (RP-HPLC) analysis of samples after centrifugation to remove insoluble aggregates indicates that the stock mGH contains a small amount (8 ± 2%) of soluble impurities (Figure 3). The amounts of impurities detected by RP-HPLC analysis in each sample were within error of one another. After irradiation, no new peaks were observed in the chromatograms, and the levels of the impurity peaks did not change. Similar to SEC analysis, for irradiated samples we were only able to detect significant changes in native protein peak area After 10 minutes of exposure to UV radiation at 254 nm, SEC analysis of samples showed that the peak area for monomeric mGH decreased by 12 %, whereas the RP-HPLC analysis indicates a native protein peak area loss of 28%. The impurities detected in the sample that was photoirradiated for 10 minutes were still only 9% of the total peak area of the sample. After 30 minutes of UV exposure, RP-HPLC detected a 48% loss of native protein peak area, similar to SEC analysis of 50% monomer loss, but again, no significant increase of degraded soluble species were detected by RP-HPLC. After 60 minutes of UV exposure, a 76% loss of native protein peak area was detected by RP-HPLC analysis, compared to the 69% loss of monomer observed in SEC. Similar to the other UV-exposed samples, this sample also did not exhibit a formation of soluble degraded species detectable by RP-HPLC, with impurities of only 10% of total area. Thus, for all UV exposure times, the level of impurities detected by RP-HPLC in the soluble protein fraction remained essentially constant, in spite of large amounts of insoluble aggregates that were formed.
Figure 3.
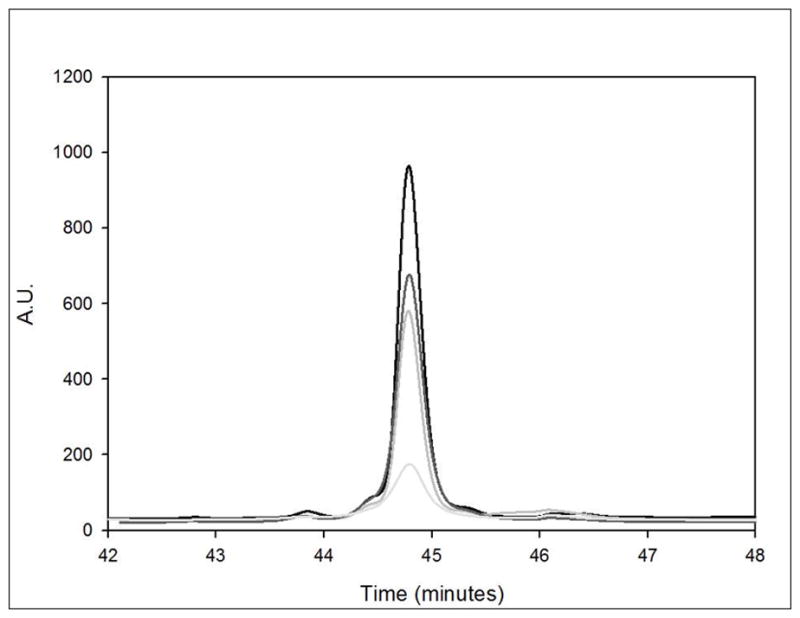
Reverse phase HPLC chromatogram for mGH stock and mGH exposed to λ = 254 nm for 10, 30 and 60 minutes represented by black, dark grey, medium grey and light grey lines, respectively.
Infrared Spectroscopy
The stock mGH used in this study has a relatively low solubility (ca. 1 mg/ml) and therefore could not be concentrated sufficiently to obtain a high quality infrared spectrum of the soluble protein. Because it has been reported that infrared spectra for native mGH can be obtained by IR analysis of mGH adsorbed to alum [7], we first measured the IR spectrum of protein from the stock solution after concentrating it by adsorbing it to alum and collecting the protein-coated particles by centrifugation. The second derivative infrared spectrum for mGH obtained in this fashion shows a strong negative band at 1654 cm−1, consistent with the expected highly α-helical structure of mGH (Figure 4). The UV treated mGH samples had sufficient insoluble protein aggregate present that these samples were simply centrifuged and supernatant removed prior to IR analysis. In the spectra for protein in the insoluble aggregates formed after UV exposure, the intensity of the band at 1654 cm−1 was diminished and the band was broadened, indicating perturbation of mGH secondary structure. (Figure 4)
Figure 4.
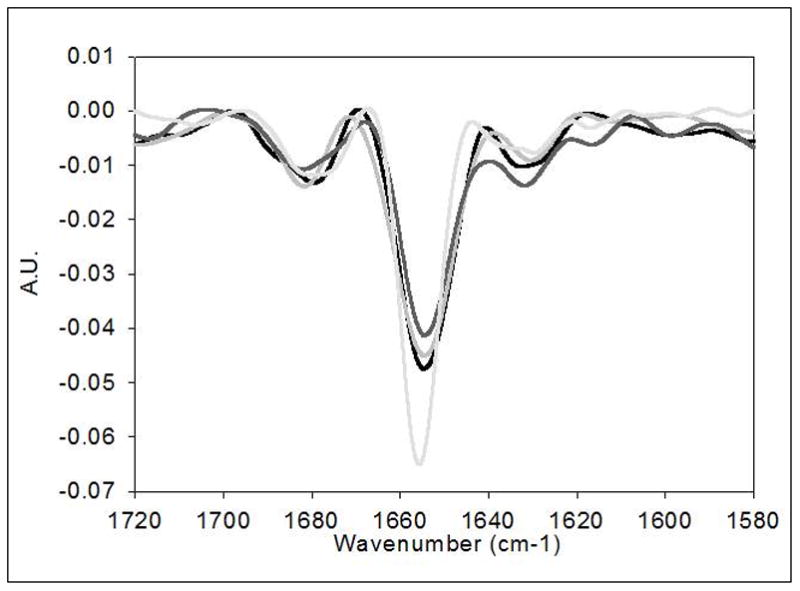
Second derivative infrared spectroscopy for mGH stock and ultraviolet irradiated mGH stock. Spectra for mGH and irradiated protein for 10, 30 and 60 minutes are represented by light grey, black line, medium grey line and dark grey line, respectively.
Antibody Responses to Native and UV-Irradiated mGH
After the first week of injections of native and UV-treated mGH (serum collected at day 8), no significant antibody responses were detected (Figure 5a). Mice injected with NP-Ficoll or NP-CGC produced antibody responses. The Balb/c mice had higher responses than the Nude Balb/c mice and were able to produce robust responses against both NP-Ficoll and NP-CGG. In contrast the Nude Balb/c mice, which lack T-cells and therefore cannot mount T-cell-mediated responses, could only respond significantly to NP-Ficoll.
Figure 5.

Antibody responses from day 8 (14a), 22 (14b), 39 (14c) and 50 (14d) sera samples. Each bar is an average of 8 mice. Error bars shown are 95 percent confidence intervals. Bars marked UV 10, UV 30, and UV 60 represent titer for mice injected with mGH exposed to UV radiation for 10, 30, and 60 minutes, respectively. Bars marked “T-cell +” represent titers from mice injected with NP-CGG; bars marked “B-cell +” represent titers for mice injected with NP-Ficoll.
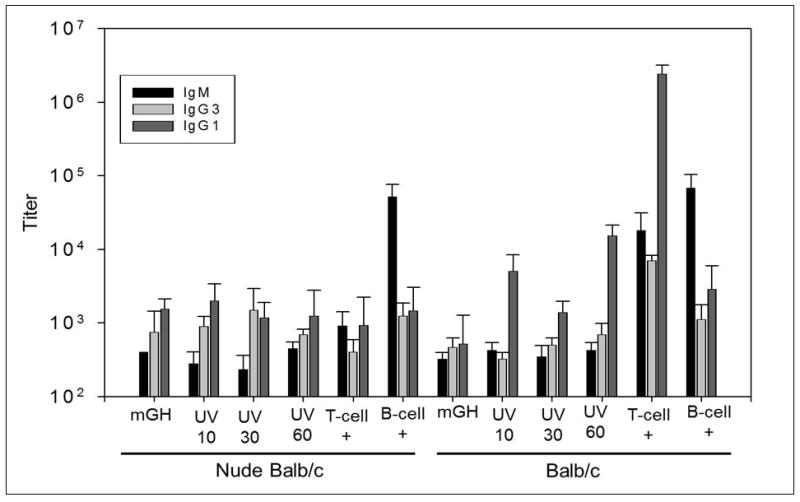
On day 22, immune responses were more prevalent in both mouse strains (Figure 5b). In the Balb/c mice, the IgG1 titers on day 22 for the mGH treated with UV for 10, 30 and 60 minutes are all significantly higher than the titers of IgG1 for mice injected with untreated mGH (p = 0.036, 0.007 and 0.008, respectively). Low levels of immune responses were detected in some of the mice injected with untreated mGH. This is likely due to low levels of undetected impurities (such as nanoparticles that were observed in similar preparations even after centrifugation [34]) and not a consequence of the mice being intolerant to growth hormone, which is produced endogenously in these mice.. If the mice were intolerant to the protein, we would have expected to see antibody produced at day 8 (Figure 5A), similar to that observed in mice treated with the positive controls. The IgG1 titers on day 22 for the mice injected with UV-treated samples of mGH increased with increasing UV exposure time, such that 30 minute exposure time results in higher titers than 10 minutes (p = 0.105) and 60 minute exposure time results in higher titers than 10 and 30 minutes (p = 0.011 and 0.021, respectively). The IgM and IgG3 titers produced by the Balb/c mice against the untreated mGH and mGH treated with UV samples were not statistically different at day 22 (p ≥ 0.12).
The Nude Balb/c mice did not produce statistically different (p ≥ 0.4) IgG1 day 22 titers in response to injections of the untreated mGH and mGH treated with UV. Nude Balb/c mice produce higher titers of IgM when injected with untreated mGH than when injected with mGH treated with UV for 10 or 30 minutes (p = 0.0001 and p = 0.018 respectively). However, the IgM titers produced in Nude Balb/c mice injected with mGH treated with UV for 60 minutes are not statistically different from titers in mice injected with untreated mGH. Similar to IgG1 titers produced in Nude Balb/c mice on day 22, the IgG3 titers were not statistically different among the different mGH sample groups. The lack of statistically significant and/or different immune responses in Nude Balb/s mice injected with mGH samples and NP-CGG suggests that these samples do not induce immune responses via the T-independent pathway.
In Balb/c mice, NP-CGG injections produced antibodies of IgG1, IgM and IgG3 isotypes. Injections of NP-Ficoll produced titers IgG3 that were roughly equivalent to those produced from NP-CGG injection, but IgM titers were higher and IgG1 titers were lower in response to injections of NP-Ficoll versus those resulting from NP-CGG injections.
In contrast, NP-CGG injections in Nude Balb/c mice produced low titers of IgG3 and negligible IgM compared to Balb/c mice. Both mouse strains showed similar IgG1, IgG3 and IgM titers in response to NP-Ficoll injections. The T-independent positive control of NP-Ficoll resulted in immune responses that were predominantly IgM in both Nude Balb/c and Balb/c mice. This antibody profile typical to T-independent immune responses was not observed among any of the groups injected with mGH (treated or untreated).
Serum samples taken on days 39 and 50 showed results for all treatments and both mouse strains (Figures 5C and 5D) that were similar to those described for samples collected on day 22. The antibody responses of mice at day 57, after being subjected to a secondary administration of material are shown in Figure 6. As expected, we observe an increase in antibody titers for the positive control groups in the Balb/c mice. The only significant increase in antibody titers observed in the Nude Balb/c sera were for the mice injected with NP-Ficoll (B-cell +). We did not observe a significant increase in antibody titers for mice injected with mGH (treated or untreated). This could be a consequence of not enough time provided between the secondary administration of material and the blood draw, or it could be indicative in a lack of T-cell memory in the immune response.
Figure 6.
Antibody responses from day 57 sera samples, after secondary administration of antigen. Each bar is an average of 8 mice. Error bars shown are 95 percent confidence intervals. Bars marked UV 10, UV 30, and UV 60 represent titer for mice injected with mGH exposed to UV radiation for 10, 30, and 60 minutes, respectively. Bars marked “T-cell +” represent titers from mice injected with NP-CGG; bars marked “B-cell +” represent titers for mice injected with NP-Ficoll.
Discussion
Exposure of mGH to UV light results in a wide spectrum of chemical modifications. These modifications include formation of MetSO at Met[127] and Met[149], the tentative formation of two new thioether and/or ether crosslinkages (e.g., between Cys[78] and Ser[188], Cys[206] and Ser[213], and between Cys[17] and Cys[78]), and a number of hydrolytic fragments. Due to the large number of UV-induced chemical modifications, we are not able to determine which modification(s) lead to the increased levels of insoluble aggregates and to the cross-reactive immune response seen as a function of increasing UV exposure time.
Before exposure to UV light, mGH samples exhibited ca. 10% levels of chemically modified species, as determined by RP-HPLC. Such levels are consistent with similar levels of chemical modification seen in commercial recombinant human GH preparations [35, 36], and the large heterogeneity of expression forms seen in autologous human growth hormone. [37, 38] Interestingly, although exposure to UV light caused a large fraction of the mGH to aggregate, the level of modified species in the remaining soluble fraction that could be detected by RP-HPLC was essentially unchanged, consistent with the suggestion that degradation products resulting from UV irradiation formed large insoluble aggregates that could not by detected by HPLC methods.
Exposure of mGH to ultraviolet radiation resulted in aggregate levels in the form of insoluble particulates that increased with longer exposure time. Monomer loss from the samples was found to be 12, 50 and 69% with 10, 30 and 60 minute exposure times to UV at 254 nm, respectively. In-vivo testing of the immunogenicity of these samples in Balb/c and Nude Balb/c mice showed that responses to the UV-treated mGH samples were UV dose-dependent, provoking higher antibody titers as aggregation levels (and oxidative damage) increased.
Balb/c and Nude Balb/c mice were both used in this study to determine if immune responses to mGH were T-cell dependent. A T-cell positive control of NP-CGG and a B-cell positive control of NP-Ficoll were both injected into the two strains of mice to determine if differences of antibody types could be observed with the two pathways of immunogenicity. Predominance of IgM and IgG3 isotypes is an indicator of T-cell independent B-cell activation [39–41], whereas a predominant IgG1 antibody response is known to be characteristic of T-cell dependent responses. [42] Our results are in agreement with the literature in that injections of NP-Ficoll, the B-cell positive control, resulted in very high levels of IgM and lower levels of both IgG1 and IgG3 in both strains of mice. Also as expected, minimal IgM responses to injections of the T-cell positive control in the T-cell deficient Nude Balb/c strain were observed. Injections of both untreated and UV-treated mGH produced immune responses characteristic of T-cell dependent antigens, with higher titers of IgG1 in Balb/c mice as compared to Nude Balb/c mice.
The IgG1 response against mGH increased in a dose-dependent fashion with increasing mGH exposure to UV radiation. Because both chemical damage and concomitant microparticle formation resulted from UV irradiation, it cannot be deduced whether the heightened immune response was initiated by chemical damage, the presence of microparticulate aggregates, or both.
This study shows that UV exposure is risk factor that can increase immunogenicity of a therapeutic protein. However, based on the present study, it is not clear what level of UV exposure might be required to significantly alter the immunogenicity of an actual therapeutic protein product. The mGH dosing schedule and dose administered to mice (0.5 mg/kg/week) was roughly equivalent (albeit for a much shorter treatment period) to the typical human therapeutic dosing schedule and human therapeutic dose used for the treatment of growth hormone deficiency with human growth hormone (hGH). Although the maximum irradiation applied to the samples (51 Wh m−2) was lower than the limit of irradiance in the ICH Q1B (200 Wh m−2), the UV irradiation applied to the mGH samples far exceeded UV levels to which bulk hGH might likely be exposed, and as a result both levels of photooxidation and resulting microparticulate aggregate levels were much higher than those that might typically be found in a therapeutic product. However, protein adsorbed on windows of UV-based chromatography column effluent monitors, on the walls of glass containers or on the interior surfaces of glass chromatography columns may well experience much higher doses that those experienced by protein molecules in the bulk [2]. In addition, many factors that may influence the immunogenic potential of aggregates such as the effects of chronic administration of aggregates and size-dependent biodistribution patterns of injected aggregates remain unknown. Prudence thus dictates that exposure of therapeutic proteins to UV radiation should be avoided to minimize potential for unwanted immunogenicity.
Supplementary Material
Highlights.
Murine growth hormone (mGH) was exposed to UV radiation.
Irradiated mGH formed Met-sulfoxides, ether linkages, aggregates, and fragments.
Immunogenicity of irradiated mGH was tested in Balb/c and Nude Balb/c mice.
Irradiated mGH induced antibody production typical of T-cell dependent responses.
Abbreviations
- mGH
Murine growth hormone
- UV
Ultraviolet
- MS
Mass Spectrometry
- Met
Methionine
- Cys
Cysteine
- Ser
Serinine
- Ala
Alanine
- Asn
Asparagine
- Gln
Glutamine
Footnotes
Publisher's Disclaimer: This is a PDF file of an unedited manuscript that has been accepted for publication. As a service to our customers we are providing this early version of the manuscript. The manuscript will undergo copyediting, typesetting, and review of the resulting proof before it is published in its final citable form. Please note that during the production process errors may be discovered which could affect the content, and all legal disclaimers that apply to the journal pertain.
References
- 1.Lorenz CM, Wolk BM, Quan CP, Alcala EW, Eng M, McDonald DJ, Matthews TC. The effect of low intensity ultraviolet-C light on monoclonal antibodies. Biotechnology Progress. 2009;25:476–482. doi: 10.1002/btpr.157. [DOI] [PubMed] [Google Scholar]
- 2.Kerwin BA, Remmele RL. Protect from light: Photodegradation and protein biologics. Journal of Pharmaceutical Sciences. 2007;96:1468–1479. doi: 10.1002/jps.20815. [DOI] [PubMed] [Google Scholar]
- 3.Luo Q, Joubert MK, Stevenson R, Ketchem RR, Narhi LO, Wypych J. Chemical modifications in therapeutic protein aggregates generated under different stress conditions. Journal of Biological Chemistry. 2011 doi: 10.1074/jbc.M110.160440. [DOI] [PMC free article] [PubMed] [Google Scholar]
- 4.Roy S, Mason BD, Schöneich CS, Carpenter JF, Boone TC, Kerwin BA. Light-induced aggregation of type I soluble tumor necrosis factor receptor. Journal of Pharmaceutical Sciences. 2009;98:3182–3199. doi: 10.1002/jps.21750. [DOI] [PubMed] [Google Scholar]
- 5.Mamula MJ, Gee RJ, Elliott JI, Sette A, Southwood S, Jones PJ, Blier PR. Isoaspartyl post-translational modification triggers autoimmune responses to self-proteins. J Biol Chem. 1999;274:22321–22327. doi: 10.1074/jbc.274.32.22321. [DOI] [PubMed] [Google Scholar]
- 6.Hermeling S, Aranha L, Damen JMA, Slijper M, Schellekens H, Crommelin DJA, Jiskoot W. Structural characterization and immunogenicity in wild-type and immune tolerant mice of degraded recombinant human interferon alpha2b. Pharmaceutical Research. 2005;22:1997–2006. doi: 10.1007/s11095-005-8177-9. [DOI] [PubMed] [Google Scholar]
- 7.Fradkin AH, Carpenter JF, Randolph TW. Glass particles as an adjuvant: A model for adverse immunogenicity of therapeutic proteins. Journal of Pharmaceutical Sciences. 2011;100:4953–4964. doi: 10.1002/jps.22683. [DOI] [PubMed] [Google Scholar]
- 8.Ring J, Stephan W, Brendel W. Anaphylactoid reactions to infusions of plasma protein and human serum albumin Role of aggregated proteins and of stabilizers added during production. Clinical & Experimental Allergy. 1979;9:89–97. doi: 10.1111/j.1365-2222.1979.tb01527.x. [DOI] [PubMed] [Google Scholar]
- 9.Christian CL. Studies of Aggregated Gamma-Globulin. 2. Effect Invivo. Journal of Immunology. 1960;84:117–121. [PubMed] [Google Scholar]
- 10.Barandun S, Jeunet F, Kistler P, Isliker H. Intravenous Administration of Human Gamma-Globulin. Vox Sanguinis. 1962;7:157. doi: 10.1111/j.1423-0410.1962.tb03240.x. [DOI] [PubMed] [Google Scholar]
- 11.Ring J, Seifert J, Jesch F, Brendel W. Anaphylactoid reactions Due To Non-Immune Complex Serum Protein Aggregates. Monogr Allergy. 1977;12:27–35. [PubMed] [Google Scholar]
- 12.Fradkin AH, Carpenter JF, Randolph TW. Immunogenicity of Aggregates of Recombinant Human Growth Hormone in Mouse Models. Journal of Pharmaceutical Sciences. 2009;98:3247–3264. doi: 10.1002/jps.21834. [DOI] [PubMed] [Google Scholar]
- 13.van Beers M, Sauerborn M, Gilli F, Brinks V, Schellekens H, Jiskoot W. Aggregated Recombinant Human Interferon Beta Induces Antibodies but No Memory in Immune-Tolerant Transgenic Mice. Pharmaceutical Research. 2010;27:1812–1824. doi: 10.1007/s11095-010-0172-0. [DOI] [PMC free article] [PubMed] [Google Scholar]
- 14.Joubert MK, Hokom M, Eakin C, Zhou L, Deshpande M, Baker MP, Goletz TJ, Kerwin BA, Chirmule N, Narhi LO, Jawa V. Highly Aggregated Antibody Therapeutics Can Enhance the in Vitro Innate and Late-stage T-cell Immune Responses. Journal of Biological Chemistry. 2012;287:25266–25279. doi: 10.1074/jbc.M111.330902. [DOI] [PMC free article] [PubMed] [Google Scholar]
- 15.Fradkin AH, Boand CS, Eisenberg SP, Rosendahl MS, Randolph TW. Recombinant murine growth hormone from E. coli inclusion bodies: Expression, high-pressure solubilization and refolding, and characterization of activity and structure. Biotechnology Progress. 2010;26:743–749. doi: 10.1002/btpr.393. [DOI] [PubMed] [Google Scholar]
- 16.Malyala P, Singh M. Endotoxin limits in formulations for preclinical research. Journal of Pharmaceutical Sciences. 2008;97:2043–2046. doi: 10.1002/jps.21152. [DOI] [PubMed] [Google Scholar]
- 17.Dong A, Huang P, Caughey WS. Protein Secondary Structures in Water from 2nd-Derivative Amide-I Infrared-Spectra. Biochemistry. 1990;29:3303–3308. doi: 10.1021/bi00465a022. [DOI] [PubMed] [Google Scholar]
- 18.Ikehata K, Duzhak TG, Galeva NA, Ji T, Koen YM, Hanzlik RP. Protein Targets of reactive metabolites of thiobenzamide in rat liver in vivo. Chem Res Toxicol. 2008:1432–1442. doi: 10.1021/tx800093k. [DOI] [PMC free article] [PubMed] [Google Scholar]
- 19.HF, Xu MA. MassMatrix: A database search program for rapid characterization of proteins and peptides from tandem mass spectrometry data. Proteomics. 2009;9:1548–1555. doi: 10.1002/pmic.200700322. [DOI] [PMC free article] [PubMed] [Google Scholar]
- 20.HZ, Xu LW, Freitas MA. Identification and characterization of disulfide bonds in proteins and peptides from tandem MS data by use of the MassMatrix MS/MS search engine. Journal of Proteome Research. 2008;7:138–144. doi: 10.1021/pr070363z. [DOI] [PMC free article] [PubMed] [Google Scholar]
- 21.Xu H, Yang L, Freitas M. A robust linear regression based algorithm for automated evaluation of peptide identifications from shotgun proteomics by use of reversed-phase liquid chromatography retention time. BMC Bioinformatics. 2008;9:347. doi: 10.1186/1471-2105-9-347. [DOI] [PMC free article] [PubMed] [Google Scholar]
- 22.Xu H, Freitas M. A mass accuracy sensitive probability based scoring algorithm for database searching of tandem mass spectrometry data. BMC Bioinformatics. 2007;8:133. doi: 10.1186/1471-2105-8-133. [DOI] [PMC free article] [PubMed] [Google Scholar]
- 23.Blier P, Bothwell A. A limited number of B cell lineages generates the heterogeneity of a secondary immune response. The Journal of Immunology. 1987;139:3996–4006. [PubMed] [Google Scholar]
- 24.Pecanha L, Snapper C, Finkelman F, Mond J. Dextran-conjugated anti-Ig antibodies as a model for T cell-independent type 2 antigen-mediated stimulation of Ig secretion in vitro. I. Lymphokine dependence. The Journal of Immunology. 1991;146:833–839. [PubMed] [Google Scholar]
- 25.JJV, Mond Q, Lees A, Snapper CM. T-cell independent antigens. Current Opinion in Immunology. 1995;7:349–354. doi: 10.1016/0952-7915(95)80109-x. [DOI] [PubMed] [Google Scholar]
- 26.Maizels NL, Blier JC, Bothwell PR. A The T-cell independent antigen, NP-Ficoll, Primes for a high-affinity IgM anti-NP response. Molecular Immunology. 1988;25:1277–1282. doi: 10.1016/0161-5890(88)90042-9. [DOI] [PubMed] [Google Scholar]
- 27.Sharon RM, PRB, Kask AM, Owens JD, Paul WE. DNP-LYS-Ficoll - T-Independent antigen which elicits both IgM and IgG anti-DNP antibody-secreting cells. Journal of Immunology. 1975;114:1585–1589. [PubMed] [Google Scholar]
- 28.Naidu BN, Sorenson ME, Connolly TP, Ueda Y. Michael addition of amines and thiols to dehydroalanine amides: A remarkable rate acceleration in water. Journal of Organic Chemistry. 2003;68:10098–10102. doi: 10.1021/jo034762z. [DOI] [PubMed] [Google Scholar]
- 29.Mozziconacci O, Kerwin BA, Schöneich C. Reversible Hydrogen Transfer Reactions of Cysteine Thiyl Radicals in Peptides: the Conversion of Cysteine into Dehydroalanine and Alanine, and of Alanine into Dehydroalanine. J Phys Chem. 2011;115:12287–12305. doi: 10.1021/jp2070453. [DOI] [PMC free article] [PubMed] [Google Scholar]
- 30.Mozziconacci O, Kerwin BA, Schöneich C. Photolysis of an Intrachain Peptide Disulfide Bond: Primary and Secondary Processes, Formation of H2S, and Hydrogen Transfer Reactions. Journal of Physical Chemistry B. 2010;114:3668–3688. doi: 10.1021/jp910789x. [DOI] [PubMed] [Google Scholar]
- 31.Mozziconacci O, Haywood J, Gorman EM, Munson E, Schöneich C. Photolysis of Recombinant Human Insulin in the Solid State: Formation of a Dithiohemiacetal Product at the C-Terminal Disulfide Bond. Pharm Res. 2012;29:121–133. doi: 10.1007/s11095-011-0519-1. [DOI] [PubMed] [Google Scholar]
- 32.Mozziconacci O, Kerwin BA, Schöneich C. Reversible Hydrogen Transfer between Cysteine Thiyl Radical and Glycine and Alanine in Model Peptides: Covalent H/D Exchange, Radical-Radical Reactions, and l- to d-Ala Conversion. The Journal of Physical Chemistry B J Phys Chem B. 2010;114:6751–6762. doi: 10.1021/jp101508b. [DOI] [PubMed] [Google Scholar]
- 33.Mozziconacci O, Kerwin BA, Schöneich C. Exposure of a Monoclonal Antibody, IgG1, to UV-Light Leads to Protein Dithiochemiacetal and Thioether Cross-Links: A Role for Thiyl Radicals. Chem Res Toxicol. 2010;23:1310–1312. doi: 10.1021/tx100193b. [DOI] [PubMed] [Google Scholar]
- 34.Christie M, Torres RM, Kedl RM, Randolph TW, Carpenter JF. Recombinant Murine Growth Hormone Particles are More Immunogenic with Intravenous than Subcutaneous Administration. J Pharm Sci. 2014;103:128–139. doi: 10.1002/jps.23794. [DOI] [PMC free article] [PubMed] [Google Scholar]
- 35.Hepner F, Cszasar E, Roitinger E, Lubec G. Mass spectrometrical analysis of recombinant human growth hormone (Genotropin(R)) reveals amino acid substitutions in 2% of the expressed protein. Proteome Science. 2005;3:1. doi: 10.1186/1477-5956-3-1. [DOI] [PMC free article] [PubMed] [Google Scholar]
- 36.Hepner F, Csaszar E, Roitinger E, Pollak A, Lubec G. Massspectrometrical analysis of recombinant human growth hormone Norditropin (R) reveals amino acid exchange at M14_V14 rhGH. Proteomics. 2006;6:775–784. doi: 10.1002/pmic.200500334. [DOI] [PubMed] [Google Scholar]
- 37.JJaA, Kopchick JM. Growth Hormone (GH), GH Receptor, and Signal Transduction. Molecular Genetics and Metabolism. 2000;71:293–314. doi: 10.1006/mgme.2000.3068. [DOI] [PubMed] [Google Scholar]
- 38.Baumann G. Growth-hormone heterogeneity - genes, isohormones, variants, and binding-proteins. Endocrine Reviews. 1991;12:424–449. doi: 10.1210/edrv-12-4-424. [DOI] [PubMed] [Google Scholar]
- 39.Perlmutter RM, Hansburg D, Briles DE, Nicolotti RA, Davie JM. Subclass Restriction of Murine Anti-Carbohydrate Antibodies. Journal of Immunology. 1978;121:566–572. [PubMed] [Google Scholar]
- 40.Teale JM, Abraham KM. The Regulation of Antibody Class Expression. Immunology Today. 1987;8:122–126. doi: 10.1016/0167-5699(87)90865-6. [DOI] [PubMed] [Google Scholar]
- 41.Snapper CM, McIntyre TM, Mandler R, Pecanha LMT, Finkelman FD, Lees A, Mond JJ. Induction of Igg3 Secretion by Interferon Gamma - a Model for T-Cell Independent Class Switching in Response to T-Cell Independent Type-2 Antigens. Journal of Experimental Medicine. 1992;175:1367–1371. doi: 10.1084/jem.175.5.1367. [DOI] [PMC free article] [PubMed] [Google Scholar]
- 42.Rosenberg YJ. The Ability of Nonspecific T-Cell Stimulators to Induce Helper-Cell-Dependent Increases in Either Polyclonal or Isotype-Restricted Ig Production Invivo. Cellular Immunology. 1981;61:416–424. doi: 10.1016/0008-8749(81)90389-0. [DOI] [PubMed] [Google Scholar]
Associated Data
This section collects any data citations, data availability statements, or supplementary materials included in this article.