


Abstract
The estrogen receptor alpha (ERα) is a ligand-activated transcription factor that possesses two activating domains designated AF-1 and AF-2 that mediate its transcriptional activity. The role of AF-2 is to recruit coregulator protein complexes capable of modifying chromatin condensation status. In contrast, the mechanism responsible for the ligand-independent AF-1 activity and for its synergistic functional interaction with AF-2 is unclear. In this study, we have identified the protein Na+/H+ Exchanger RegulatoryFactor 2 (NHERF2) as an ERα-associated coactivator that interacts predominantly with the AF-1 domain of the nuclear receptor. Overexpression of NHERF2 in breast cancer MCF7 cells produced an increase in ERα transactivation. Interestingly, the presence of SRC-1 in NHERF2 stably overexpressing MCF7 cells produced a synergistic increase in ERα activity. We show further that NHERF2 interacts with ERα and SRC-1 in the promoter region of ERα target genes. The binding of NHERF2 to ERα in MCF7 cells increased cell proliferation and the ability of MCF7 cells to form tumors in a mouse model. We analyzed the expression of NHERF2 in breast cancer tumors finding a 2- to 17-fold increase in its mRNA levels in 50% of the tumor samples compared to normal breast tissue. These results indicate that NHERF2 is a coactivator of ERα that may participate in the development of estrogen-dependent breast cancer tumors.
INTRODUCTION
The hormone estrogen (17β-estradiol, E2) has a key role in cell proliferation and differentiation. The effects of E2 have been widely analyzed in human mammary gland where it is responsible for normal epithelial growth and for the development of 70–80% of human breast cancer tumors (1). The biological effects of E2 on mammary epithelium are mediated by the estrogen receptor α (ERα), a ligand-activated transcription factor. Structurally, ERα is organized in functionally independent domains that include an N-terminal domain, a DNA-binding domain, formed by two cysteine-rich zinc-finger motifs, and a C-terminal ligand-binding domain (LBD) (2). ERα transactivation is mediated by two transcriptional activating domains, designated AF-1 and AF-2. AF-1 is located at the N-terminal region of ERα and is characterized by a ligand-independent transcriptional activity (3,4). AF-2 is located within the LBD domain of ERα and its transcriptional activity shows a strong ligand-dependency.
Structural and functional studies have shown that ligand binding induces a major conformational change in the LBD domain of ERα. The structural rearrangement creates a new docking interphase that allows AF-2 to interact with numerous coregulator proteins (5,6). AF-2-associated coregulators capable of enhancing nuclear receptor transactivation are called coactivators and are characterized by having one or more LXXLL motifs that mediate their interaction with the LBD domain of ERα (7,8). ERα coactivators include SRC-1, SRC-2/GRIP1/TIF2/NCoA2, SRC3/RAC3/p/CIP/ACTR/AIB1, CREB-binding protein (CBP)/p300 and CBP-associated factor (P/CAF). AF-2 coactivators enhance ERα transactivation through different mechanisms. Some coactivators, like TRAP/DRIP, enhance nuclear receptor activity through their interaction with members of the basal transcription machinery (9). Others, like SRC-1 and CBP/p300, modify the condensation status of the chromatin through their intrinsic histone acetyltransferase activity (10,11).
In contrast, the nature of the AF-1 contribution to ERα transcriptional activity is not well understood. Functional and structural analyses of ERα activating domains have shown that AF-1 activity exhibits different promoter and cell specificity from AF-2, indicating that the two transactivating domains function through different mechanisms (12,13). It has been suggested that AF-1 activity is regulated by the recruitment of coactivator proteins that mediate AF-1 transactivation or its direct interaction with the basal transcription machinery (14). The search for AF-1 specific coregulators has identified a number of highly diverse coregulator proteins including the coactivators known as p72/p68 and steroid receptor activator (SRA) (15). These proteins coactivate ERα as part of p72/p68 and p/300 complex (16). The AF-2-associated coactivators SRC-1 and p/300 were also shown to interact with the AF-1 domain of ERα (17,18).
In this work, we sought to identify additional AF-1 coactivators in order to gain better insight into the mechanism responsible for ERα transactivation. We identified a 337 amino acid protein containing two PDZ domains that had been previously identified as a coactivator of nuclear testis differentiation factor SRY (SIP1) (19) and as a regulatory protein of the membrane-bound Na+/H+ Exchanger Regulatory Factor 2 (NHERF2) (20). We show that NHERF2 increases ERα transactivation by interacting predominantly with its AF-1 domain. Our results show that NHERF2 transcriptional activity is mediated through its recruitment to the promoter region of ERα target genes and its interaction with the AF-2-associated coactivator SRC-1. Functionally, NHERF2 overexpression increases transcription of endogenous E2-dependent genes and stimulates cell proliferation and tumor formation in mice. We show further that NHERF2 mRNA is overexpressed (2- to 17-fold) in 50% of breast cancer tumors compared to normal breast tissue. These results indicate that NHERF2 is a coactivator of ERα that may participate in the development of estrogen-dependent breast cancer tumors.
MATERIALS AND METHODS
Reagents and antibodies
Estradiol (17β-estradiol) and geneticin (G418) were from Sigma-Aldrich (St. Louis, MO). Cell-trace CFSE cell proliferation kit was from Invitrogen (Carlsbad, CA). Antibodies: ERα antibody was purchased from Santa Cruz Biotechnology (Santa Cruz, CA), anti-FLAG antibody was from Sigma-Aldrich (St. Louis, MO), SRC-1 antibody was from Pierce, Thermo Scientific and NHERF2 monoclonal antibody was purchased from Cell Signaling Technology. Knockdown assays were performed using NHERF-2 siRNA cocktail and control siRNA from Santa Cruz Biotechnology (Santa Cruz, CA).
Plasmids
pcDNA3.1-ERα and ERE-TK-Luc were kindly provided by Dr W. Lee Kraus, Cornell University, pcDNA-SRC1 was a gift of Dr R. Kurokawa, Saitama Medical University and MMTV-Luc was provided by Joe Torchia, University of Western Ontario. Human full-length NHERF2 cDNA was amplified by polymerase chain reaction (PCR) and cloned into the mammalian expression vector pcDNA3.1 (Invitrogen, Carlsbad, CA) and FLAG-tagged mammalian expression vector pCMV-3Tag-1A (Agilent Technologies, Santa Clara, CA). Glutathione S-transferase (GST)-NHERF2 full-length and deletion constructs were generated by subcloning into GST pGEX-4T-1 (Amersham Pharmacia Biotech, Piscataway, NJ). The sequences of all constructs were verified by DNA sequencing at LARAGEN Inc. (Culver City, CA).
Yeast two-hybrid screening
A yeast two-hybrid screen was performed using the matchmaker two-hybrid system kit (CLONTECH). Briefly, a cDNA fragment encoding the AF-1 domain (amino acids 1–180) of ERα was subcloned into the pAS2.1 vector. A human mammary gland cDNA library in pACT2 plasmid was screened with bait construct pAS2.1/AF1 using sequential polyethylene glycol/lithium acetate transformation, according to the manufacturer's instructions. Y190 yeast cells harboring pAS2-1/AF1 and transformed with the cDNA library were plated on medium lacking tryptophan, leucine and histidine (SD/-Leu -Trp -His) containing 25 mM 3-amino-1,2,4-triazole(3-AT) and incubated for 2–4 days at 30°C. Resulting colonies were assayed for β-galactosidase activity. The positive AD plasmids were transformed into Escherichia coli DH5α cells for DNA sequencing and identification using Basic Local Alignment Search Tool (BLAST) analysis.
Immunofluorescence and confocal microscopy studies
The cellular location of ERα and NHERF2 was determined by indirect immunofluorescence. Briefly, HepG2 cells were grown on glass coverslips and fixed with freshly prepared 3% paraformaldehyde solution. The cells were incubated first with primary antibodies and then with secondary antibodies conjugated with Alexa-546 (red) and Alexa-488 (green; both from Molecular Probes, Eugene, OR). Prolong-Gold Antifade reagent with DAPI (blue; Invitrogen) was used to counterstain the DNA. Confocal scanning analysis was done using an MRC600 laser-scanning confocal microscope (Bio-Rad, Hercules, CA). Each slide was examined for each stain at three excitation wavelengths (488, 546 and 633 nm).
Cell culture and transfection assays
HepG2, MCF7, ZR-75-1, CV-1 and AD293 cells were obtained from American Type Culture Collection (Manassas, VA) and maintained in α-MEM supplemented with 5% FBS (Fetal Bovine Serum), 100 U/mL penicillin and 100 μg/mL streptomycin in a humidified atmosphere containing 5% CO2 at 37°C. Cells were seeded into tissue culture dishes containing phenol red-free Dulbecco's modified Eagle's medium (DMEM) supplemented with 5% charcoal/dextran-treated FBS and cultured for 24 h before all experimental treatments with hormone. Cells were transfected using the calcium phosphate-DNA coprecipitation method, which typically included 500 ng of ERE-TK-Luc, 200 ng of pCMVβGal (transfection control), 250 ng of pcDNA3.1-ERα, and 100–500 ng of pcDNA3.1-NHERF2 or other test vector. After 12 h, the cells were washed twice with phosphate-buffered saline (PBS) and treated with either 100 nM E2 or carrier (ethanol) for 24 h in phenol red-free DMEM supplemented with 5% stripped FBS. Cells were then washed and harvested in potassium phosphate lysis buffer containing 1% Triton X-100. Luciferase and β-galactosidase activities were measured using a monolight 3010 luminometer (Pharmingen). Cell lines stably overexpressing NHERF2 were generated by transfecting MCF7 cells with pCMV-3Tag-NHERF2 using Superfect (Qiagen, Valencia, CA) and, after 48 h, selected in medium containing G418 (500 μg/mL). For NHERF-2 knockdown assays, siRNA specific cocktail and siRNA control duplexes were purchased from Santa Cruz Biotechnology (Santa Cruz, CA) and transfected using X-tremeGENE siRNA Transfection Reagent (Roche). Reduction in NHERF2 expression was determined by western blot (WB) using specific anti-NHERF2 antibody.
GST pull-down assay
In vitro transcription and translation of the NHERF2 and ERα proteins were done using the TNT transcription/translation system (Promega) in the presence of [35S]-methionine. The GST pull-down assays were done by incubating equal amounts of GST, GST-NHERF2 or GST-ERα-domains immobilized on GST beads (Amersham Pharmacia Biotech, Piscataway, NJ) with in vitro-translated recombinant protein. Bound proteins were isolated by incubating the mixture for 3 h at 4°C and then washing five times with NP40 lysis buffer (20 mmol/l Hepes pH 7.9, 100 mmol/l NaCl, 1 mmol/l ethylenediaminetetraacetic acid (EDTA) pH 8.0, 4 mmol/l MgCl2, 1 mmol/l DTT, 0.02% NP40, 10% glycerol and 0.5 mmol/l PMSF). For endogenous ERα pull-down assay, the GST bound proteins were incubated with a whole cell extract of MCF7 cells, resuspended in TBS-0.2% triton X-100 and sonicated. The proteins were eluted with a 2x Laemmli sample buffer, separated by sodium dodecyl sulphate-polyacrylamide gel electrophoresis (SDS-PAGE), and visualized by autoradiography or immunoblot.
Immunoprecipitation and western blot
ZR-75-1 cells were lysed with TNTE buffer (50 mM Tris-HCl, pH 7.4, 150 mM NaCl, 5 mM EDTA containing 0.5% Triton X-100 plus a mixture of protease and phosphatase inhibitors). MCF7 cells were lysed with RIPA buffer (Tris-HCl pH 7.4, 50 mM, NaCl 150 mM, 1 mM EDTA, 0.5% DOC (deoxycholic acid, sodium salt), 1% NP-40, 0.1% SDS). Proteins were immunoprecipitated with mouse monoclonal anti-ERα (D-12) or mouse monoclonal anti-SRC-1 (MA1-840, 1135/H4) (Pierce, Thermo Scientific). Immunoprecipitated proteins were separated by PAGE and detected by WB with rabbit monoclonal anti-NHERF2 (D3A5) antibody or rabbit polyclonal anti-ER (HC-20) antibody. Proteins were visualized by incubation with anti-rabbit secondary horseradish-peroxidase-conjugated antibody (Pierce, Thermo Fisher Scientific Inc.) and using an enhanced chemiluminescence assay (SuperSignal West Pico Chemiluminescent Sustrate, Thermo Scientific).
Chromatin immunoprecipitation and sequential ChIP (Re-ChIP) assays
Chromatin immunoprecipitation (ChIP) assays were performed as previously described (21). Before immunoprecipitation, 10% of each chromatin preparation was set aside for use as a control DNA in polymerase chain reaction (PCR) amplification (input). ChIP was carried out at 4°C overnight with 2 μg of specific antibody. For re-ChIP, the DNA-protein complexes immunoprecipitated with the indicated antibodies were eluted with 10 mM dithiothreitol, diluted 20× in re-ChIP buffer (1% Triton X-100, 2 mM EDTA, 150 mM NaCl, 20 mM Tris-HCl, pH 8.0), and then reimmunoprecipitated with the indicated antibodies. The pS2 gene promoter region (ERE, −355 to −192) or DNA region located 3 kb upstream of the pS2 promoter (negative control, −3947 to −3639) was amplified by PCR. PCR analysis was also performed for Cathepsin-D (CSTD) promoter region (−568 to −416). PCR products were resolved on a 2% agarose gel and visualized with ethidium bromide. PCR bands were subjected to densitometry analysis using Molecular Imager FX and Quantity One software (Bio-Rad). The sequences of the primers used are as follows: pS2 promoter: sense 5′-ccggccatctctcactatgaa-3′, antisense 5′-agatccctcagccaagatgacc-3′; pS2 upstream control region: sense 5′-agctgggtgtccttgtaaag-3′, antisense 5′-gatccacttcctcccaaac-3′; CSTD promoter: sense 5′-GGTTTCTCTGGAAGCCCTGTAG-3′, antisense 5′-TCCTGCACCTGCTCCTCC-3′.
RT-PCR assay
The mRNAs encoding CTSD, CXCR4, pS2, ERα, NHERF2, HPRT and β-actin were amplified by rtPCR. Total RNA was isolated from MCF7, MCF7-FLAG-NHERF2 or MCF7 NHERF2-siRNA cells using TRIzol (Invitrogen) following the manufacturer instructions. Total RNA (2 μg) was used for cDNA synthesis using oligo (dT) primer and SuperScript II (Invitrogen). PCR amplification was carried out using Taq PCR master mix kit (Amplificase-BioTecMol) using the following primers: CTSD sense 5′-CGAGGTGCTCAAGAACTACATGGAC-3′, antisense 5′-ATCTGGGTCCCTGCTCAGGTAGAAG-3′; CXCR4 sense 5′-GCAATGGATTGGTCATCCTGGTCATGG-3, antisense 5′-GCCAACCATGATGTGCTGAAACTGG-3′; ERα sense 5′-CTGAACCGTCC GCAGCTCAAGATC-3′, antisense 5′-GTCTCCTTGGCAGATTCCATAGCC-3′; pS2 sense 5′ATGGCCACCATGGAGAACAAGG-3′, antisense 5′-CTAAAATTCACACTCCTCTTCTGG-3′; NHERF2 sense 5′-CGAAGCTGGCAAGAAGGATGTCAGTG-3′, antisense 5′-ATCCTCAGTGTCCTTGTC GGAACCAG-3′; HPRT sense 5′-GGCGTCGTGATTAGTGATGATGAACC-3, antisense 5′CTGGCTTATATCCAACACTTCGTGGG-3′; β-actin sense 5′-GGGTCAGAAGGATTCCTATG-3′, antisense 5′-GGTCTCAAACATGATCTGGG-3′. PCR products were separated by PAGE and visualized with ethidium bromide. Estrogen-dependent genes' mRNA levels were normalized with respect to HPRT and β-actin mRNA levels.
CFSE labeling and proliferation assay
MCF7 and MCF7-NHERF2 cells were incubated in serum-free medium for 24 h, and 6 × 10⁵ cells were stained with CSFE reagent (5 mM stock) using the CellTrace™ CFSE cell proliferation kit (Molecular Probes, Eugene, OR, USA) in a solution of PBS supplemented with 0.1% FBS for 30 min at 37°C. After treatment, cells were washed twice with PBS/0.1% FBS, incubated in MEM/5% FBS for 30 min at 37°C and washed twice more with PBS/1% FBS. The CSFE fluorescence intensity was measured at 24 and 48 h by fluorescence-activated cell sorting (FACS) analysis in a FACSCalibur (Becton-Dickinson, USA). Acquired data were analyzed using the FlowJo software (8.7v, Tree Star, Inc., Ashland, OR). The reduction in fluorescence per unit cell is taken as an indicator of the number of intervening cell divisions.
Mouse xenotransplantation experiments
Two groups of nude mice (age 5–6 weeks, 9 mice/group) (Instituto Nacional de Nutrición y Ciencias Médicas) were implanted with 3×10⁶ control MCF7 cells or with 3×10⁶ MCF7-NHERF2 cells suspended in 50% matrigel. All animals were subdermally stimulated with estradiol (30 μg/week) for the duration of the experiment. After 7 weeks the animals were sacrificed and the tumors were extracted and weighted. All animal procedures were done in compliance with the Canadian Council on Animal Care and the guidelines for the ethical treatment of laboratory animals of Instituto de Investigaciones Biomédicas, Universidad Nacional Autónoma de México (UNAM).
NHERF2 mRNA expression in breast cancer tumor samples
The total RNA from fragments of breast cancer tumor biopsies obtained at the Instituto Nacional de Cancerología was isolated using Trizol. The samples were from ERα positive/progesterone receptor (PR) positive breast cancer tumors stages IIA and IIB for which neoplasia-free tissue was also collected during biopsies. None of the patients included in this study received medical treatment before the biopsy was obtained and confirmation of the histological type of cancer and immune-histochemistry pattern was defined. This part of the study was approved by the Ethical and Scientific Research Committees of the Instituto Nacional de Cancerología and Instituto de Investigaciones Biomédicas, UNAM. The levels of NHERF2 and β-actin mRNA were determined using a Lightcycler 480 real-time PCR system (Roche) and optimized specific primers and probes (TaqMan Gene Expression Assays, Applied Biosystems) and TaqMan Universal PCR Master Mix reagents (Applied Biosystems) according to the manufacturer's directions. The assay ID numbers of the TaqMan Gene Expression probes were (for NHERF2) Hs00191186_m1 and (for β-actin) Hs99999903_m1. The mRNA levels were calculated using the comparative CT method and expressed as fold increase relative to normal tissue after normalization using β-actin gene expression level (22,23).
Analysis of NHERF mRNA expression using a cancer microarray database
To validate the relation between NHERF2 mRNA expression levels and breast cancer, we consulted the Oncomine microarray database (www.oncomine.org) for analysis and visualization of the Cancer Genome Atlas (TCGA). The NHEREF2 mRNA expression levels were displayed using log2 median-centered ratio boxplots for breast carcinoma versus normal tissue, and for estrogen receptor negative (ERα−) versus estrogen receptor positive (ERα+).
Statistical analysis
Each transfection and ChIP assay was performed in triplicate in three different experiments using different cell cultures and chromatin preparations, respectively. Data are presented as mean ± S.E. Statistical significance was analyzed at 0.05 levels of significance using Student's t-test.
RESULTS
Identification of NHERF2 as an AF-1 interacting protein
To identify novel coregulators that recognize the activation function AF-1 of ERα, we used this region (amino acids 1–180) as bait in a yeast two-hybrid screen of 5 × 10⁶ independent clones of a human mammary gland cDNA library. Eleven cDNA clones were isolated and sequenced. Two showed almost identical sequences encoding a 337 amino acid protein containing two PDZ domains (Figure 1A). Sequence analysis using the BLAST program of the National Center for Biotechnology Information revealed that the candidate protein had been previously described as the human testis determining factor SRY-interacting protein (SIP-1) and as the regulatory factor of the small intestine brush-border membrane Na+/H+ exchanger, NHERF2.
Figure 1.
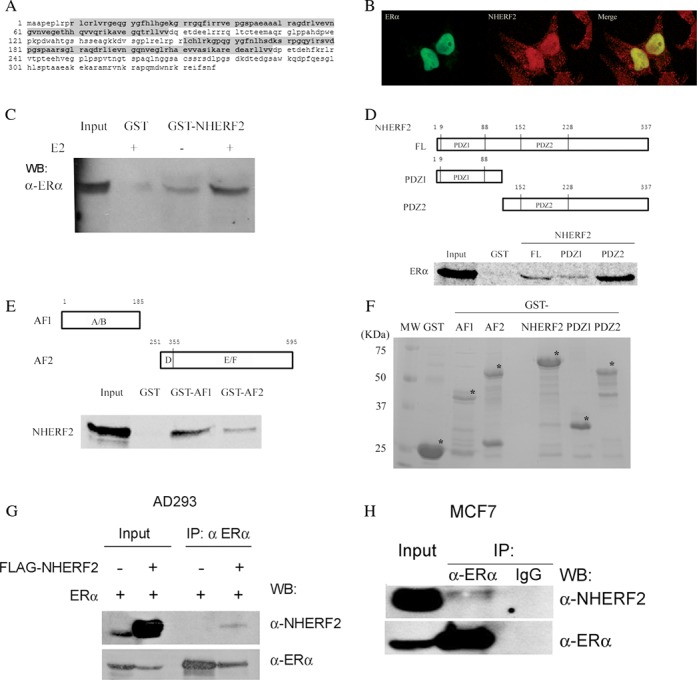
NHERF2 is an ERα associated protein. (A) NHERF2 protein sequence obtained from cDNA clones isolated by yeast two-hybrid screening. The PDZ domain1 (PDZ1, amino acids 10–88) and PDZ domain 2 (PDZ2, amino acids 152–238) are highlighted in gray. (B) Subcellular localization of NHERF2 and ERα NHERF2 (left panel, green) and ERα (middle panel, red) were visualized using specific antibodies as described in Materials and Methods. Cellular colocalization is shown by merging NHERF2 and ERα images (right panel, yellow). (C) Estradiol (E2) enhances NHERF2 binding to ERα. Nuclear protein extracts from MCF7 cells were incubated with a GST-NHERF2 fusion protein or a GST control protein. Proteins captured in the presence (E2) or absence (E2−) of estradiol were resolved by PAGE and the presence of ERα was visualized by western blot (WB). Input lane represents 10% of the nuclear extract used in the capture assays. (D) In vitro interaction between NHERF2 and ERα schematic representation of N-terminal (PDZ1), C-terminal (PDZ2) and full-length NHERF2 GST-fusion proteins used in pull-down assays is shown in the top panel. The bottom image shows [35S]methionine-labeled-ERα resolved by PAGE following capture by GST-NHERF2 full length (FL) or protein fragments (PDZ1, PDZ2) or GST control. Input represents 10% of the labeled ERα used in the assay. (E) NHERF2 interacts predominantly with the AF-1 domain of ERα. Schematic representation of N-terminal (AF-1) and C-terminal AF-2 fragments of ERα used in pull-down assays is shown at the top. The bottom image shows [35S]methionine-labeled-NHERF2 resolved by PAGE following capture by GST-AF1 or GST-AF2 ERα fragments or GST control. (F) Coomassie Brilliant Blue staining showed that equimolar amounts of GST proteins were used for the pull-down assay. (G) NHERF2 interacts with ERα in vivo. AD293 cells were transiently transfected with ERα with or without 3× FLAG-NHERF2. AD293 protein extracts were immunoprecipitated with anti-ERα followed by WB to detect FLAG-NHERF2 and ERα. (E) Endogenous NHERF2 interacts with ERα in the MCF7 breast cancer cell line. MCF7 cells were incubated for 45 min with 100 nM E2. Total cell lysates were subjected to immunoprecipitation with anti-ERα or IgG (as negative control) followed by WB with anti-ERα or anti-NHERF2.
NHERF2 colocalize in the cell nucleus with estrogen receptor α
Immunostaining of E2-stimulated HepG2 cells with anti-ERα antibody (green) showed ERα predominantly localized in the cell nucleus (left panel, Figure 1B). Incubation of HepG2 cells with anti-NHERF2 antibody (red, center panel) demonstrated the presence of NHERF2 in the cytoplasm and nucleus but in greater abundance in the nucleus where it colocalizes (yellow, right panel) with ERα (Figure 1B).
E2 enhances the interaction between NHERF2 and ERα
We made use of GST pull-down assays to assess the ability of E2 to influence the interaction between immobilized GST-NHERF2 fusion protein and ERα present in nuclear protein extracts from MCF7 cells. The captured proteins were resolved by PAGE and the presence of ERα was determined by WB analysis using an anti-ERα antibody. Our results showed that GST-NHERF2 was able to bind ERα in the absence of E2 (Figure 1C, E2−). However, addition of E2 to the protein extracts augmented substantially the amount of ERα captured by GST-NHERF2 (Figure 1C, E2+). Binding was absent with GST alone suggesting that the interaction between NHERF2 and ERα is specific (Figure 1C, GST).
We next examined the involvement of the N-terminal (PDZ1, amino acids 9–98, M.W. = 35 KDa) and C-terminal (PDZ2, amino acids 107–337, M.W. = 55 KDa) domains of NHERF2 on binding to ERα. Fusions made between GST and full-length NHERF2 or the PDZ1 or PDZ2 fragments were evaluated in GST pull-down assays for the ability to bind [35S]-methionine-labeled ERα (Figure 1D). The experiment showed that ERα interacts with both the PDZ1 and PDZ2 fragments, but the interaction with PDZ2 was better than with PDZ1 or full-length NHERF2. To identify the domains of ERα that interact with NHERF2, GST fusions were made with the AF-1 domain (amino acids 1–202, M.W. = 43 KDa) and with the carboxyl terminal fragment containing the AF-2 domain (amino acids 263–595, ER-AF2, M.W. = 62 KDa). The experiment revealed a greater interaction of the full-length NHERF2 with AF-1 than with AF-2 (Figure 1E). Together, these experiments suggest that NHERF2-ERα interaction may be mediated by the C-terminal PDZ2 domain of NHERF2 and the N-terminal AF-1 domain of ERα. In neither case was there interaction with the GST component of the fusion proteins, confirming the specificity of both binding experiments. As a control, GST-ERα and GST-NHERF2 fusion proteins were separated by PAGE and visualized by Coomassie blue staining to verify their purity and confirm that similar amounts of proteins were used in the pull-down assays (Figure 1F). Although the identity and integrity of all constructs was verified by DNA sequencing, the mobility of the GST-AF2 band was greater than expected (∼55 KDa instead of the predicted 62 KDa) and likely represents some structural integrity to the protein despite the presence of SDS.
NHERF2 interacts with ERα in vivo
The potential interaction between NHERF2 and ERα was examined by coimmunoprecipitation assays using two different experimental strategies. First, AD293 cells were transiently transfected with pCDNA3.1-ERα (ERα) in the presence or absence of pCMV-3Tag-NHERF2 (FLAG-NHERF2). The cells were stimulated with E2 and immunoprecipitated with anti-ERα antibody. NHERF2 was detected in the ERα pull-down in cells transfected with FLAG-NHEF2 but not in untransfected cells (Figure 1G). The input levels of NHERF2 and ERα were examined by WB, revealing a low level of endogenous NHERF2 and a substantial increase after transfection (Figure 1G, Input). The relatively faint band corresponding to NHEF2 in the ERα pull-down suggests that the interaction between the two proteins is relatively weak or that the transfected level of expressed ERα was limiting in the experiment, but shows nevertheless that the two proteins interact in AD293 cells. We therefore sought to determine if endogenous NHERF2 and ERα interact in cells. For this experiment, we examined interaction in MCF7 cells stimulated with E2. The immunoprecipitation was conducted with anti-ERα or IgG as control and the blots were probed with anti-NHERF2 or anti-ERα. Our results confirmed that endogenously expressed NHERF2 interacts with ERα in MCF7 cells treated with E2 (Figure 1H). Again the NHERF2 band was faint, despite a high level of endogenous NHERF2 assessed by WB of 10% of the protein extract used in the assay (Figure 1H, Input). While both experiments demonstrate ERα-NHERF2 interaction, together the experiments suggest the interaction is weak or that other components may be required.
NHERF2 enhances ERα transcriptional activity
To test whether NHERF2 affects ERα transactivating activity, we performed transient transfection assays in two ERα-expressing cell lines (MCF7 and HepG2) and in ERα-negative CV-1 cells. In these transfection assays, pcDNA3.1-NHERF2 was the source of NHERF2 overexpression and the vector ERE-TK-LUC was used as the indicator of ERα transcriptional activity. CV-1 cells were also cotransfected with pcDNA3.1-ERα. All three cell lines showed baseline luciferase activity that could be stimulated by the addition of E2 (Figure 2, Control, panels A–C). With overexpression of NHERF2, all three cell lines showed significant E2-dependent stimulation of ERα transactivation activity (Figure 2).
Figure 2.
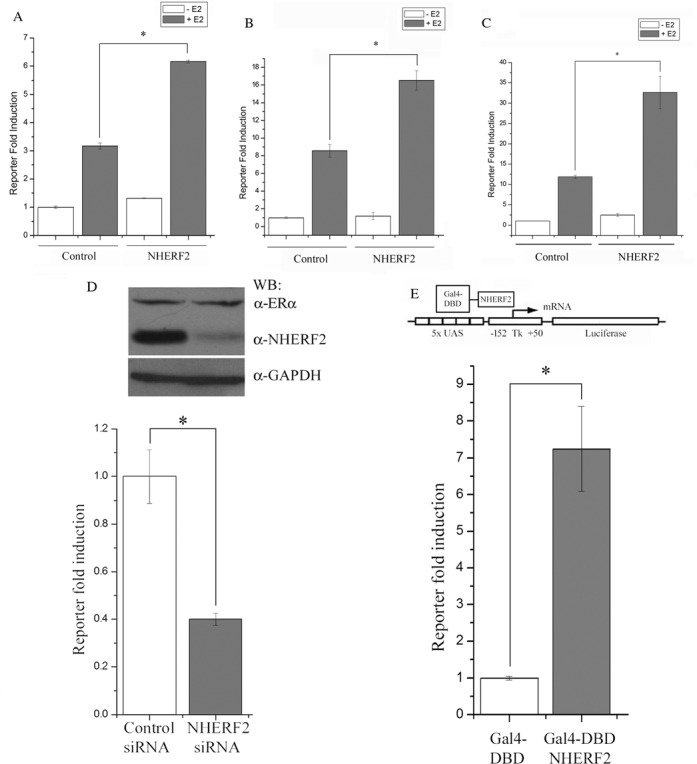
NHERF2 overexpression enhances ERα transactivation. Three cell lines, CV-1 (A), MCF7 (B) and HepG2 (C), were transiently transfected with empty pcDNA vector (‘Control’) or pcDNA3.1-NHERF2 (‘NHERF2’) along with ERE-TK-Luc in each case, and the effect on ERα transactivation was determined by assay of luciferase activity, as described in Materials and Methods. Assays were performed in triplicate in three independent experiments in the presence (gray bars) or absence (white bars) of E2 and the results are represented as mean ± S.E. (D) NHERF2 knockdown impairs ERα transactivation. MCF7 cells were transfected with NHERF2-specific siRNA or with an unrelated siRNA (control), along with ERE-TK-Luc, in the presence of E2. The effect on endogenous NHERF2 protein levels was visualized after 48 h by WB (Top panel), and the effect on ERα transactivation was determined by luciferase assay. Results, in triplicate in three independent experiments, are represented as mean ± S.E. (E) NHERF2 exhibits intrinsic transcriptional activity. NHERF2 transcriptional activity was assayed using the GAL4-UAS system. MCF7 cells were transfected with Gal4-DBD-NHERF2 (gray bar) or the Gal4-DBD alone (white bar), as the control, and a luciferase reporter containing a promoter with five UAS elements in tandem (5× UAS-luciferase, top panel). Luciferase activity, from three experiments assayed in triplicate, was normalized with respect to cells expressing Gal4-DBD and represented as mean ± S.E.
To determine the biological relevance of NHERF2 as a coactivator of ERα, we used siRNA knockdown assays in MCF7 cells to test the effects of reducing endogenous NHERF2 protein expression on E2-dependent transcriptional activation. First, we determined the efficiency of siRNA to reduce NHERF2 protein levels by WB analysis of protein extracts prepared from MCF7 cells transfected with NHERF2-siRNA or with an unrelated control siRNA. Our results showed a significant reduction in NHERF2 protein levels in cells transfected with NHERF2-siRNA compared to MCF7 cells transfected with the control siRNA (Figure 2D, upper panel, α-NHERF2) suggesting that the siRNA-mediated knockdown of NHERF2 expression is specific. ERα protein levels in MCF7 cells were not affected by transfection of control siRNA or siRNA-NHERF2 (Figure 2D, upper panel, α-ERα). In this experiment, the levels of GADPH were used as loading control (Figure 2D, upper panel, GADPH). Next, we determined the activity of ERα in E2-stimulated MCF7 cells transfected with NHERF2-siRNA or the control siRNA. These experiments demonstrated that siRNA-mediated knockdown of NHERF2 expression produced a 60% reduction in the ERα activity compared to control cells (Figure 2D, lower panel).
NHERF2 exhibits intrinsic transcriptional activity
To explore the mechanism by which NHERF2 acts as a coactivator of ERα, we tested whether this protein has intrinsic transcriptional activity. NHERF2 was expressed as a fusion protein with the DNA binding domain of the yeast transcription factor GAL4 (GAL4-NHERF2) and cotransfected into MCF7 cells with a vector containing the luciferase reporter gene under the control of five GAL4 responsive elements (Figure 2E, top panel). The luciferase activity of GAL4-DBD-NHERF2 expressing cells was compared to the activity observed in MCF7 cells transfected with the GAL4-DNA-binding domain alone. The expression of GAL4-DBD-NHERF2 fusion protein increased the luciferase activity by about 7-fold with respect to the control GAL4-DNA binding domain (Figure 2E).
NHERF2 is recruited to the promoter of the estradiol-dependent pS2 gene in MCF7 cells
To assess the role of NHERF2, we performed ChIP to identify whether endogenous NHERF2 is recruited to estrogen response element (ERE) at the core promoter of the pS2 gene in MCF7 cells stimulated with 100 nM E2 at 45 min. After ChIP analysis using anti-ERα antibody to enrich for target sequences, a fragment of 163 bp (−355 to −192) of the pS2 promoter could be amplified by PCR from MCF7 cells even before E2 stimulation (Figure 3A, ERE, α-ERα panel). However, the PCR product obtained increased after E2 stimulation indicating, as expected, that occupation of the pS2 promoter by ERα was hormone-dependent (Figure 3A, ERE, α-ERα panel). ChIP analysis of MCF7 cells using anti-NHERF2 antibody showed that this protein was also recruited to the pS2 promoter both in the absence and presence of E2. However, in the presence of E2, recruitment of NHERF2 to ERE was also enhanced (Figure 3A, ERE, α-NHERF2 panel). The specificity of ERα and NHERF2 binding to the pS2 promoter was confirmed when a pair of primers complementary to a DNA region localized upstream of the ERE (−3947 to −3639), failed to produce a PCR product after ChIP using either anti-NHERF2 or anti-ERα antibodies (Figure 3A, control region).
Figure 3.
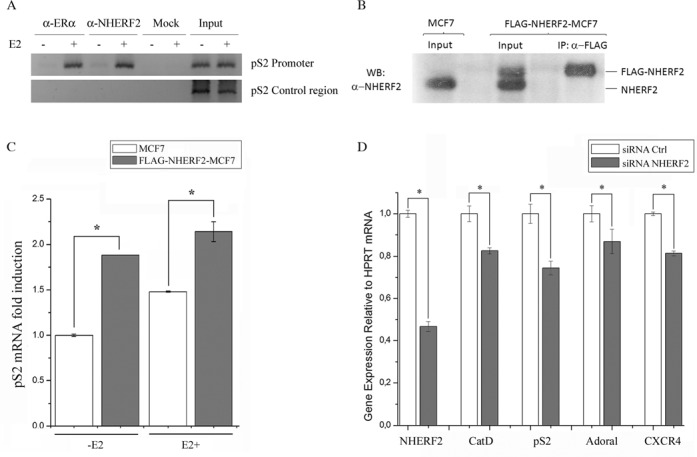
NHERF2 and ERα bind to estrogen response elements (EREs) in target gene promoters to induce transcription. (A) MCF7 cells were treated without or with 100 nM E2 for 45 min. ChIP assay were carried out using anti-ERα, anti-NHERF2 or without antibody (Mock). PCRs were done with primers spanning the ERE region from the endogenous pS2 promoter (pS2 ERE region, 163 bp) or a region 4 kb upstream of pS2 (pS2 Control Region, 358 bp), as negative control. (B) Stable NHERF2 overexpression in MCF7 breast cancer cells line. MCF7 cells were transfected with pCMV-3Tag-NHERF2 and selected using geneticin as described in Materials and Methods. Whole cell protein extracts of MCF7 or FLAG-NHERF2-MCF7 cells were subjected to WB or Immunoprecipitation (IP) with anti-FLAG specific antibody followed by WB with anti-NHERF2. (C) NHERF2 overexpression increases pS2 gene transcription. Total RNA isolated from control MCF7 cells (white bars) or stably transfected FLAG-NHERF2 MCF7 cells (gray bars) was used to determine pS2 mRNA levels by rt-PCR using β-actin mRNA levels to normalize the results. PCR products were resolved in agarose gels and densitometry analysis under UV light was performed. Results are represented as mean ± S.E. of three different experiments done in triplicate. (D) NHERF2 down-regulation by siRNA reduced the expression of ERα target genes. Total RNA isolated from MCF7 cells treated with siCtrl (white bars) or with siNHERF2 (gray bars) was used to determine mRNA levels of NHERF2, CTSD, pS2, Adora1 and CXCR4 by RT-PCR using HPRT mRNA levels to normalize the results. PCR products were resolved in agarose gels and densitometry analysis under UV light was performed.
NHERF2 affects pS2 mRNA levels
The effect of NHERF2 on pS2 transcription was explored by determining pS2 mRNA levels in control MCF7 cells and in MCF7 cells that stably overexpress NHERF2. MCF7 cells were transfected with a pCMV-3TAG-NHERF2 construct that directed the expression of NHERF2 containing three FLAG epitopes at its amino-terminus (FLAG-NHERF2). MCF7 were selected in the presence of geneticin as described in Materials and Methods. NHERF2 overexpression was confirmed by immunoblot using anti-NHERF2 antibody (Figure 3B). Control MCF7 cells exhibited one NHERF2 protein band compared to FLAG-NHERF2-MCF7 cells that showed two protein bands corresponding to endogenous NHERF2 (lower band) and FLAG-NHERF2 (upper band) (Figure 3B, input lanes). Immunoprecipitation using anti-FLAG antibody followed by WB using anti-NHERF2 antibody confirmed the expression of FLAG-NHERF2 (Figure 3B, IP: α-FLAG lane). Next, the effect of NHERF2 on pS2 transcription was explored by determining pS2 mRNA levels in control MCF7 cells and in FLAG-NHERF2-MCF7 before and after E2 stimulation. In the absence of E2, the level of pS2 mRNA in FLAG-NHERF2-MCF7 cells was 90% higher than in control MCF7 cells (Figure 3C, E2−). After E2 treatment, the mRNA levels increased in both control MCF7 and FLAG-NHERF2-MCF7 cells (Figure 3C, E2+). However, the level of pS2 mRNA in FLAG-NHERF2-MCF7 cells was 46% higher than in control MCF7 cells following E2 treatment (Figure 3C).
To assess the relevance of NHERF2 in ERα-mediated transcriptional regulation, we evaluated the effect of siRNA-mediated reduction of NHERF2 expression in the mRNA levels of E2 responsive CTSD, pS2, Adora1 and CXCR4 genes by rt-PCR. Our results showed that transfection of siRNA-NHERF2 into MCF7 cells reduced NHERF2 mRNA by 55% compared to MCF7 transfected with control siRNA (Figure 3D). Further, the presence of siRNA-NHERF2 in MCF7 cells reduced the mRNA levels of the endogenous ER target genes CTSD, pS2, Adora1 and CXCR4 by 22%, 25%, 16% and 22%, respectively (Figure 3D).
NHERF2 enhances the activity of the steroid receptor coactivator 1 (SRC-1)
To further elucidate the molecular mechanism of the NHERF2 coactivator on ERα activity, we evaluated the possibility that NHERF2 affects the activity of AF-2 recruited coactivators such as SRC-1. We compared the effect of transient expression of SRC-1 on ERα transactivation in control MCF7 and FLAG-NHERF2-MCF7 cells. E2 stimulation of control MCF7 cells transfected with an empty pcDNA vector produced a 3-fold increase in ERα activity (Figure 4A, control). Transfection of SRC-1 into control MCF7 cells in the presence of E2 produced a 7-fold increase in ERα transactivation (Figure 4A, SRC-1). In contrast, the presence of SRC-1 in NHERF2 stably overexpressing cells increased both the basal and E2-dependent ERα activity by 30-fold and 90-fold, respectively (Figure 4A, FLAG-NHERF2-MCF7 cells).
Figure 4.
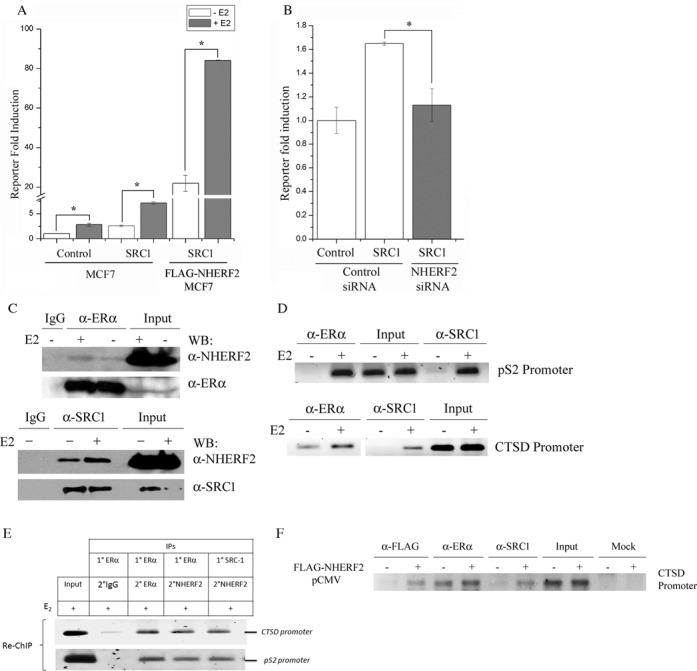
NHERF2 and SRC-1 form a complex to enhance ERα transactivation. (A) NHERF2 enhances the activity of the steroid receptor coactivator 1 (SRC-1). Control MCF7 cells and FLAG-NHERF2-MCF7 cells were transfected with pcDNA-SRC1 vector and ERα activity was determined by luciferase assay using the ERE-TK-Luc reporter. The cells were grown in the absence (white bars) or presence (gray bars) of E2 for 48 h. All results were normalized to luciferase activity observed in control MCF7 cells transfected with empty pcDNA vector (‘Control’). Results were expressed as mean relative luciferase activity ± S.E. (B) NHERF2 knockdown impairs SRC1 coactivator activity on ERα transactivation. MCF7 cells were transfected with pcDNA-SRC1 in the presence of an NHERF2-specific siRNA (gray bar) or an unrelated control siRNA (white bars) as described in Materials and Methods. ERα activity was determined using the ERE-luciferase reporter in the presence of 100 nM E2. The results were normalized to luciferase activity of control MCF7 cells transfected with empty pcDNA vector and the unrelated control siRNA. (C) NHERF2 interacts with ERα and SRC-1 in ZR-75-1 breast cancer cells. Whole cell protein extracts were subjected to IP using anti-ERα (upper panel), anti-SRC-1 (lower panel) followed by immunoblot using anti-NHERF2, anti-ER or anti-SRC-1 antibodies. As a negative control immunoprecipitation was performed using anti-IgG (IgG, upper and lower panels). (D) ERα and SRC-1 are recruited to CTSD and pS2 promoters in E2-stimulated MCF7 cells. MCF7 cells were treated without or with100 nM E2 for 45 min. ChIP assays were carried out using anti-ERα or anti-NHERF2 antibodies. PCRs were done with primers spanning the ERE region from the endogenous pS2 promoter (163 bp) or CTSD (152 bp). (E) Presence of a NHERF2/ERα/SRC-1 complex on the pS2 and CTSD promoters. MCF7 cells were treated with E2 for 45 min, and a Re-ChIP assay was carried out using anti-ERα or anti-SRC-1 antibodies for the first IP, and anti-ER, anti-NHERF2 or IgG (as negative control) for the second IP. PCRs were done with primers spanning the ERE region from the endogenous pS2 promoter (163 bp) or CTSD (152 bp). (F) FLAG-NHERF2 overexpression affects the recruitment of SRC-1 to CTSD promoter. MCF-7 were transiently transfected with (+) or without (−) FLAG-NHERF2. ChIP assays were performed using anti-FLAG, anti-ERα, anti-SRC-1 or without antibody (mock). PCR amplifications were done with primers spanning the ERE region from the endogenous CTSD (152 bp).
To confirm the functional interaction between NHERF2 and SRC-1, we examined the effect of reducing the endogenous NHERF2 protein levels on SRC-1 coactivator activity acting on ERα. MCF7 cells were transiently cotransfected with SRC-1 and either the control siRNA or the specific NHERF2 siRNA. The ERα activity of MCF7 control cells transfected with empty pcDNA vector was used to normalize the results (Figure 4B). The results showed that MCF7 cells transfected with SRC-1 and the control siRNA exhibited a 65% increase in ERα activity compared with MCF7 cells transfected with the empty pcDNA vector and the control siRNA (Figure 4B, control siRNA). In contrast, transfection of SRC-1 in the presence of the specific NHERF2 siRNA almost completely abolished the coactivating effect of SRC-1 on ERα, producing only a 10% increase in luciferase activity (Figure 4B, NHERF2-siRNA). These results suggest that reduction of NHERF2 expression attenuates the SRC-1 effect on ERα transactivation in breast cancer cells.
NHERF2 interacts with ERα and SRC-1 in breast cancer cells
To investigate the mechanism responsible for the functional cooperation between NHERF2 and SRC-1, we explored the possibility that both proteins are physically associated in vivo. Whole protein extracts from ERα-expressing ZR-75-1 breast cancer cells were immunoprecipitated using anti-ERα (Figure 4C, upper panel) or anti-SRC-1 (Figure 4C, lower panel) antibodies followed by immunoblotting using anti-NHERF2 antibody. Our results showed that in ZR-75-1 cells, NHERF2 is associated with ERα (Figure 4C, upper panel) and SRC-1 (Figure 4C, lower panel). These results suggested the possibility that NHERF2 enhances ERα transactivation through its binding to the AF1 domain of the nuclear receptor and its interaction with AF2-associated coactivators like SRC-1. As a control, IP membranes were subjected to immunoblotting using anti-ERα or anti-SRC-1 to evaluate the immunoprecipitation efficiency of the studied proteins (Figure 4C).
The formation of a NHERF2/SRC1/ERα complex on the E2-activated promoters was tested using sequential ChIP assays (Re-ChIP). First, the recruitment of ERα and SRC-1 to the ERE region in the promoters of pS2 and CTSD genes was analyzed by ChIP. These experiments were performed using anti-ERα and anti-SRC-1 antibodies in MCF7 cells before and after 45 min of E2 stimulation. Our results showed that ERα and SRC-1 recruitment to the ERE region of pS2 and CTSD promoters is enriched after E2 stimulation (Figure 4D). Next, the ChIP assay was repeated under the same experimental conditions but this time the DNA-protein complexes, immunoprecipitated with anti-ERα or anti-SRC-1 antibodies, were subjected to a second round of immunoprecipitation using anti-NHERF2 antibody (Figure 4E). This experiment showed that NHERF2 can be detected in the protein complexes associated to the ERE of pS2 and CTSD promoters (Figure 4E). Our ChIP/Re-ChIP experiment suggests that E2 stimulates the assembly of an ERα-NHERF2-SRC-1 complex on the promoter of ERα target genes.
To explore whether NHERF2 affects the recruitment of ERα and SRC-1 to the promoter of E2 responsive genes, we performed ChIP assays in E2-stimulated MCF-7 cells transiently transfected with pCMV-3Tag-NHERF2 or empty pCMV-3Tag vector. The experiments were carried out using anti-FLAG, anti-ERα or anti-SRC-1 antibodies. The presence of FLAG-NHERF2 in the CTSD promoter of MCF-7 cells was confirmed in a control ChIP using anti-FLAG antibody (Figure 4F, Flag-NHERF2+). Our results showed that ERα recruitment to the CTSD promoter was not affected by FLAG-NHERF2. In contrast, the presence of FLAG-NHERF2 enhanced the SRC-1 recruitment to the CTSD promoter (Figure 4F). These results suggest that NHERF2 may facilitate the recruitment of SRC-1 to ERα during the transcriptional activation of E2 responsive genes.
NHERF2 overexpression enhances proliferation of MCF7 cells
In human breast cancer cells the activity of ERα is associated with cell proliferation. To test whether NHERF2 overexpressing cells proliferate at a different rate than control MCF7 cells, we used a cell tracing assay in which cells treated with CFSE are allowed to divide in culture for 24 h or 48 h. After labeling, all cells were uniformly stained with CFSE. However, after 24 h and 48 h in culture NHERF2-MCF7 cells retained less CFSE than control MCF7 cells (Figure 5A–C), indicating a slower rate of cell division by the control cells.
Figure 5.

NHERF2 enhances proliferation and tumorigenic potential of MCF7 cells. The effect of NHERF2 overexpression on MCF7 cells proliferation was analyzed using the CFSE assay as described in Materials and Methods. Control MCF7 and FLAG-NHERF2-MCF7 cells were analyzed every 24 h after CFSE labeling by FACS. Representative histograms showing the fluorescence intensity distribution of MCF7 and FLAG-NHERF2-MCF7 transfected cells at 24 h (A) and 48 h (B) after CFSE labeling compared with MCF7 control (time 0) cells. (C) Representative histogram displaying CFSE fold reduction of FLAG-NHERF2-MCF7 cells (gray bars) compared to control MCF7 cells (white bars) at 24 and 48 h after CFSE labeling. (D) NHERF2 overexpression increases the tumorigenic potential of MCF7 cells in a nu/nu mouse model. Two groups of 8 nu/nu mice were injected with 3×10⁶ control MCF7 cells or 3×10⁶ FLAG-NHERF2-MCF7 cells as described in Materials and Methods. After 30 days the animals were sacrificed and the tumors were isolated and weighted. Tumor weight is represented as mean ± S.E.
NHERF2 overexpression induces tumor growth in nude mice
Given the stimulatory effect of NHERF2 on MCF7 cell proliferation, we explored whether NHERF2 could also influence tumor growth by comparing the tumorigenic potential of FLAG-NHERF2-MCF7 cells and control MCF7 cells injected subcutaneously in a nude mouse model as described in Materials and Methods. Our results showed NHERF2-overexpressing MCF7 cells produced tumors in seven out of eight mice injected with these cells. In comparison, only three out of eight mice injected with control MCF7 cells were found to have tumors at the end of the experiment (Figure 5D). When the tumors were removed, we found that most of tumors produced by FLAG-NHERF2-MCF7 cells exhibited a larger weight compared to tumors produced by control MCF7 cells (Figure 5D).
NHERF2 mRNA expression levels in breast cancer tumors
In recent years numerous studies have associated changes in the expression levels of different ERα coregulators with cancer progression, invasiveness, poor prognosis or resistance to hormonal treatment (24–28). In order to explore whether changes in NHERF2 expression could be associated with breast cancer, we determined NHERF2 mRNA expression levels in tumor and cancer-free mammary gland tissue samples from 20 patients diagnosed with stages IIA and IIB of ERα positive breast cancer. Our results showed that in 50% of the breast tumors analyzed (10 patients) NHERF2 mRNA was overexpressed 2- to 17-fold compared to cancer-free tissue mRNA levels (Figure 6). The remaining tumors (10 patients) showed normal or slightly below normal NHERF2 mRNA levels.
Figure 6.
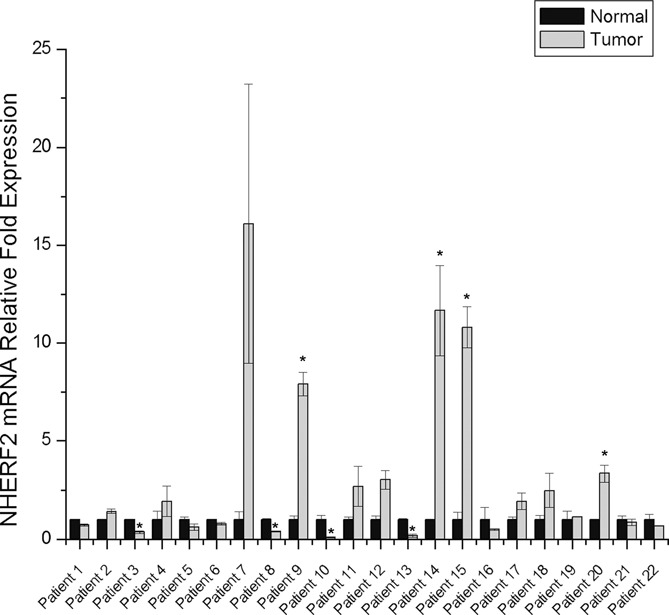
NHERF2 mRNA expression in breast cancer tumors. Total RNA was isolated from breast cancer tumor samples and cancer-free mammary tissue obtained during biopsies of 22 patients diagnosed with ERα+ breast cancer. NHERF2 mRNA was amplified by RT- real time quantitative PCR and its relative expression levels were calculated by the 2−ΔΔCT method using β-actin as a reference gene as described in Materials and Methods. NHERF2 mRNA levels in tumor samples were normalized with respect to NHERF2 mRNA levels in normal tissue and represented as mean ± S.E.
Correlation between NHERF2 mRNA expression levels and breast carcinoma using the Oncomine cancer microarray database
To confirm the relationship between NHERF2 expression levels with breast cancer tumorigenesis, we compared the expression levels of NHERF2 in normal tissues and breast carcinomas using the Oncomine database. Our results showed that 6 of the 12 data sets, which contain gene chip profiles classified as normal or breast carcinoma tissues, showed that NHERF2 mRNA expression levels are moderately higher in breast carcinomas than in normal tissue. Representative results of two independent data sets are shown in Figure 7A (29,30). Further analysis of the database showed that in seven of nine data sets NHERF2 expression is modestly elevated in ERα+ breast cancer tumors compared to ERα− breast cancer tumors. Two representative results of two independent data sets (31,32) are shown in Figure 7B.
Figure 7.
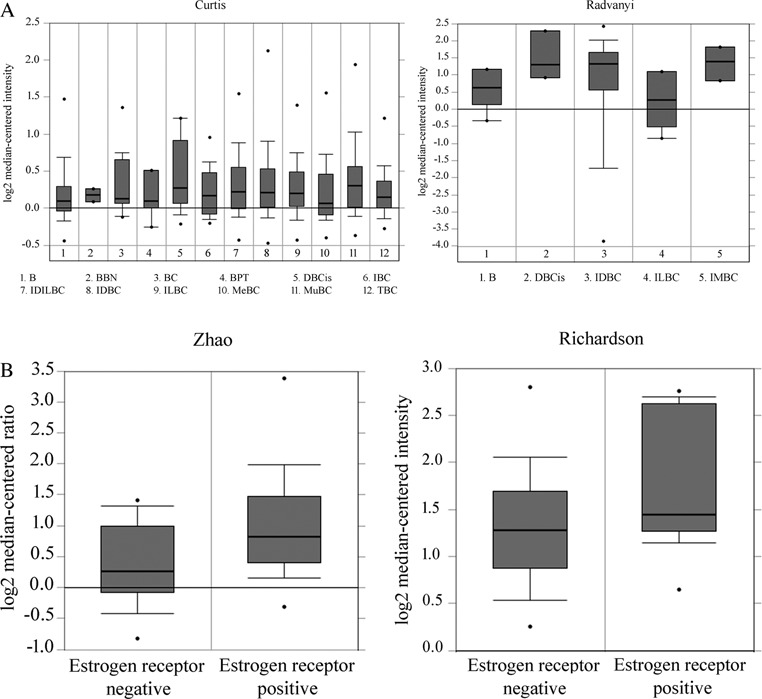
NHERF2 mRNA expression in a breast cancer microarray database. (A) NHERF2 mRNA expression in normal and breast carcinoma tissues was analyzed in 12 different data sets using the Oncomine database. Two representative results obtained from independent data sets (Curtis et al. (29) and Radvanyi et al. (30)) are shown. The tissues analyzed in Curtis data set are breast (NB), benign breast neoplasm (BBN), breast carcinoma (BC), breast phyllodes tumor (BPT), ductal breast carcinoma in situ (DBCis), invasive breast carcinoma (IBC), invasive ductal and invasive lobular breast carcinoma (IDILBC), invasive ductal breast carcinoma (IDBC), invasive lobular breast carcinoma (ILBC), medullary breast carcinoma (MeBC), mucinous breast carcinoma (MuBC) and tubular breast carcinoma (TBC). The tissues analyzed in Radvanyi data set are breast (NB), ductal breast carcinoma in situ (DBCis), invasive ductal breast carcinoma (IDBC), invasive lobular breast carcinoma (ILBC) and invasive mixed breast carcinoma (IMBC). (B) NHERF2 mRNA expression in ERα− and ERα+ breast carcinomas was compared using nine data sets from the Oncomine database. Two representative results obtained from independent data sets (Zhao et al. (31) and Richardson et al. (32)) are shown.
DISCUSSION
In this report we have identified human NHERF2 as an ERα-associated protein in a yeast two-hybrid assay. Previous studies had described NHERF2 as a coregulator of the testis determining factor SRY and as a regulatory protein of different membrane-associated receptors and transporter proteins (33). Structurally, NHERF2 belongs to a class of multiple PDZ domain-containing proteins that function as scaffolds for the formation of multi-protein complexes in cells (34). PDZ domains function as protein–protein interaction modules that recognize specific C-terminal sequences in their target proteins. However, a small group of PDZ proteins has been shown to mediate the recognition of non C- terminal motifs (35–37). NHERF2, in its association with ERα, fits in this latter, less common group of PDZ proteins by using its PDZ2 domain to interact with the N-terminal AF-1 domain of this nuclear receptor. The binding of NHERF2 to ERα is also atypical if we compare it with the binding mechanism used by other coregulators to interact with nuclear receptors. For example, members of the p160 family of coactivators SRC-1, GRIP1/TIF2 and SRC-3/AIB1 possess several LXXLL motifs that mediate their ligand-dependent interaction with the AF-2 region of nuclear receptors. The preferential binding of NHERF2 to AF-1 is consistent with the absence of LXXLL motifs in the sequence of this protein. The association of NHERF2 to ERα in vivo was confirmed using different experimental approaches. First exogenously expressed FLAG-NHERF2 and ERα were coimmunoprecipitated from AD293 cells. Second, interaction between endogenous ERα and endogenous NHERF2 was demonstrated by coimmunoprecipitation assays using two different ERα-expressing breast cancer cell lines (MCF7 and ZR-75-1).
Transient transfection assays showed that NHERF2 overexpression produced a significant increase in ERα transactivation in all cell lines tested. In contrast, siRNA-mediated reduction of endogenous NHERF2 protein levels impaired ERα transactivation and the expression of estrogen target genes (pS2, CTSD, Adora1 and CXCR4) in MCF7 cells, suggesting this protein participates in the regulation of ERα transcriptional activity in breast cancer cells. These results and the recruitment of both NHERF2 and ERα to the promoters of pS2 and CTSD genes after E2 stimulation in ZR-75-1 and MCF7 cells lines confirm the role of NHERF2 as a bona fide ERα coactivator.
Molecular and functional characterization of different nuclear receptors has shown that full nuclear receptor transcriptional activity is the result of the synergistic functional interaction between the AF-1 and AF-2 protein regions. This process is mediated at least in part by SRC-1 and p300 acting as bridge molecules between the two activating functions of ERα. It is conceivable that AF-1 associated proteins, such as NHERF2, may functionally interact with SRC-1 and other AF-2 associated coregulators. In this work we tested this hypothesis studying the effect of NHERF2 on the coactivator activity of SRC-1. Our results show that when SRC-1 was transiently transfected into stably NHERF2 overexpressing breast cancer MCF7 cells it synergistically augmented ERα transactivation 10-fold compared to the effect of SRC-1 transfected in control MCF7 cells. Furthermore, the selective knockdown of NHERF2 expression resulted in a significant reduction in the ability of SRC-1 to increase E2-dependent ERα transactivation in these cells. These results suggest the possibility that these coactivators may function through a common or complementary pathway. To investigate the mechanism responsible for the functional interaction of NHERF2 and SRC-1, we performed coimmunoprecipitation experiments in different cells lines. These experiments demonstrated that NHERF2 interacts with SRC-1 in ERα+ breast cancer cells in vivo. Further, ChIP and reChIP assays show that NHERF2 participates in the assembly of a protein complex including ERα and SRC-1 that is recruited to the promoter region of the E2-responsive genes pS2 and CTSD.
NHERF2 was shown to possess an intrinsic ERα-independent transcriptional activity capable of activating the transcription of a luciferase reporter when expressed as a GAL4-DBD fusion protein. Unlike other coactivator proteins, NHERF2 does not have a histone acetyltransferase domain that could suggest that its activity is achieved via direct chromatin modification. Instead, we propose that the function of NHERF2 as an ERα coactivator is mediated by its binding to AF-1 and by facilitating the recruitment of SRC-1, a coactivator with histone acetyltransferase activity, to promoters of E2-activated genes. The role of NHERF2 as a facilitator of SRC-1 is supported by ChIP assays that showed that NHERF2-expressing MCF-7 cells exhibit an increased occupancy of the CTSD promoter by SRC-1 compared to control MCF7 cells.
The enhancement of ERα transactivation through its direct interaction with SRC-1 is a mechanism that NHERF2 seems to share with other AF-1-associated coactivators like the RNA binding proteins p72/p68. These factors were recently identified as a novel class of ERα coactivators that interact with AF-1 and form a complex with the steroid receptor RNA activator (SRA) and members of the p160 family of proteins including SRC-1 (16). We suggest that NHERF2 binding to AF-1 and its functional and physical interaction with AF-2 coactivator complexes that include SRC-1 may be involved in the mechanism responsible for the functional synergism of the AF-1 and AF-2 domains of ERα.
It has been suggested that nuclear receptor activity is the result of the cellular balance of coactivators and corepressors (38). ERα coactivators promote cell proliferation and their overexpression has been often associated with different forms of cancer (39). For example, increased protein levels of SRC-1 have been shown to correlate with lymph node metastasis, disease recurrence and poor disease-free survival in breast cancer (40). In this study, we showed that MCF7 cells overexpressing NHERF2 exhibit a significant increase in ERα-dependent transcriptional activation, cell proliferation and tumorigenicity potential in mice. Significantly, NHERF2 mRNA levels were elevated in 50% of the breast cancer tumor samples analyzed. An analysis of a cancer microarray database revealed that NHERF2 mRNA expression levels are modestly elevated in breast carcinoma tumors compared to normal tumors and suggested that NHERF2 expression may correlate with tumor ERα positivity.
Based on NHERF2 strong coactivator activity on ERα and the potentiation of SRC-1 function, we hypothesized NHERF2 may be an important factor in promoting ER-dependent cell growth in breast cancer tumorigenesis. In summary, this work has identified NHERF2 as a novel AF1-associated protein required for ERα transactivation. The effect of this coactivator in cell proliferation and tumor formation and the finding that NHERF2 mRNA is overexpressed in a significant percentage of breast cancer tumors open the possibility that NHERF2 may also be an important participant in the development of human breast cancer. Further studies will be necessary to explore the potential of NHERF2 as a tumor marker in the development of new diagnostic and therapeutic strategies for breast cancer.
Acknowledgments
We thank Dr Roy A. Gravel (University of Calgary) and Dr Viviana Valadez-Graham for invaluable discussion and for comments to the manuscript, Colette Michalak, Universidad Nacional Autónoma de México and Ernesto Soto-Reyes, Instituto Nacional de Cancerología for technical assistance. I.M.-M., T.B-G., V.G.-R., I.T.-G., S.R.-C., E.M-E. are students of Programa de Doctorado en Ciencias Biomédicas, Universidad Nacional Autónoma de México and are recipients of a scholarship from Consejo Nacional de Ciencia y Tecnología.
Footnotes
The authors wish it to be known that, in their opinion, the first two authors should be regarded as Joint First Authors.
FUNDING
Consejo Nacional de Ciencia y Tecnología [SALUD-C02-14467, 183069]; Fundación Miguel Alemán [Estímulo a la Investigación Médica]; 1/2012-2013 Programa de Investigación de Cáncer de Mama, Instituto de Investigaciones Biomédicas, UNAM: Leon-pre. inst. 2013. Funding for open access charge: Consejo Nacional de Ciencia y Tecnología [SALUD-C02-14467, 183069]; Instituto de Investigaciones Biomédicas. Conflict of interest:None declared.
REFERENCES
- 1.Jordan V.C. ‘Studies on the estrogen receptor in breast cancer‘—20 years as a target for the treatment and prevention of cancer. Breast Cancer Res. Treat. 1995;36:267–285. doi: 10.1007/BF00713399. [DOI] [PubMed] [Google Scholar]
- 2.Gronemeyer H. Transcription activation by estrogen and progesterone receptors. Annu. Rev. Genet. 1991;25:89–123. doi: 10.1146/annurev.ge.25.120191.000513. [DOI] [PubMed] [Google Scholar]
- 3.Tora L., White J., Brou C., Tasset D., Webster N., Scheer E., Chambon P. The human estrogen receptor has two independent nonacidic transcriptional activation functions. Cell. 1989;59:477–487. doi: 10.1016/0092-8674(89)90031-7. [DOI] [PubMed] [Google Scholar]
- 4.Tzukerman M.T., Esty A., Santiso-Mere D., Danielian P., Parker M.G., Stein R.B., Pike J.W., McDonnell D.P. Human estrogen receptor transactivational capacity is determined by both cellular and promoter context and mediated by two functionally distinct intramolecular regions. Mol. Endocrinol. 1994;8:21–30. doi: 10.1210/mend.8.1.8152428. [DOI] [PubMed] [Google Scholar]
- 5.Shiau A.K., Barstad D., Loria P.M., Cheng L., Kushner P.J., Agard D.A., Greene G.L. The structural basis of estrogen receptor/coactivator recognition and the antagonism of this interaction by tamoxifen. Cell. 1998;95:927–937. doi: 10.1016/s0092-8674(00)81717-1. [DOI] [PubMed] [Google Scholar]
- 6.Glass C.K., Rosenfeld M.G. The coregulator exchange in transcriptional functions of nuclear receptors. Genes Dev. 2000;14:121–141. [PubMed] [Google Scholar]
- 7.Moras D., Gronemeyer H. The nuclear receptor ligand-binding domain: structure and function. Curr. Opin. Cell Biol. 1998;10:384–391. doi: 10.1016/s0955-0674(98)80015-x. [DOI] [PubMed] [Google Scholar]
- 8.Heery D.M., Kalkhoven E., Hoare S., Parker M.G. A signature motif in transcriptional co-activators mediates binding to nuclear receptors. Nature. 1997;387:733–736. doi: 10.1038/42750. [DOI] [PubMed] [Google Scholar]
- 9.Ito M., Yuan C.-X., Malik S., Gu W., Fondell J.D., Yamamura S., Fu Z.-Y., Zhang X., Qin J., Roeder R.G. Identity between TRAP and SMCC complexes indicates novel pathways for the function of nuclear receptors and diverse mammalian activators. Mol. Cell. 1999;3:361–370. doi: 10.1016/s1097-2765(00)80463-3. [DOI] [PubMed] [Google Scholar]
- 10.Spencer T.E., Jenster G., Burcin M.M., Allis C.D., Zhou J., Mizzen C.A., McKenna N.J., Onate S.A., Tsai S.Y., Tsai M.-J., et al. Steroid receptor coactivator-1 is a histone acetyltransferase. Nature. 1997;389:194–198. doi: 10.1038/38304. [DOI] [PubMed] [Google Scholar]
- 11.Green K.A., Carroll J.S. Oestrogen-receptor-mediated transcription and the influence of co-factors and chromatin state. Nat. Rev. Cancer. 2007;7:713–722. doi: 10.1038/nrc2211. [DOI] [PubMed] [Google Scholar]
- 12.Thompson E.B., Kumar R. DNA binding of nuclear hormone receptors influences their structure and function. Biochem. Biophys. Res. Commun. 2003;306:1–4. doi: 10.1016/s0006-291x(03)00877-5. [DOI] [PubMed] [Google Scholar]
- 13.Mérot Y., Métivier R., Penot G., Manu D., Saligaut C., Gannon F., Pakdel F., Kah O., Flouriot G. The relative contribution exerted by AF-1 and AF-2 transactivation functions in estrogen receptor alpha transcriptional activity depends upon the differentiation stage of the cell. J. Biol. Chem. 2004;279:26184–26191. doi: 10.1074/jbc.M402148200. [DOI] [PubMed] [Google Scholar]
- 14.Perissi V., Rosenfeld M.G. Controlling nuclear receptors: the circular logic of cofactor cycles. Nat. Rev. Mol. Cell Biol. 2005;6:542–554. doi: 10.1038/nrm1680. [DOI] [PubMed] [Google Scholar]
- 15.Colley S.M., Iyer K.R., Leedman P.J. The RNA coregulator SRA, its binding proteins and nuclear receptor signaling activity. IUBMB Life. 2008;60:159–164. doi: 10.1002/iub.22. [DOI] [PubMed] [Google Scholar]
- 16.Watanabe M., Yanagisawa J., Kitagawa H., Takeyama K., Ogawa S., Arao Y., Suzawa M., Kobayashi Y., Yano T., Yoshikawa H., et al. A subfamily of RNA-binding DEAD-box proteins acts as an estrogen receptor [alpha] coactivator through the N-terminal activation domain (AF-1) with an RNA coactivator, SRA. EMBO J. 2001;20:1341–1352. doi: 10.1093/emboj/20.6.1341. [DOI] [PMC free article] [PubMed] [Google Scholar] [Retracted]
- 17.Kobayashi Y., Kitamoto T., Masuhiro Y., Watanabe M., Kase T., Metzger D., Yanagisawa J., Kato S. p300 mediates functional synergism between AF-1 and AF-2 of estrogen receptor α and β by interacting directly with the N-terminal A/B domains. J. Biol. Chem. 2000;275:15645–15651. doi: 10.1074/jbc.M000042200. [DOI] [PubMed] [Google Scholar]
- 18.Métivier R., Penot G., Flouriot G., Pakdel F. Synergism between ERα transactivation function 1 (AF-1) and AF-2 mediated by steroid receptor coactivator protein-1: requirement for the AF-1 α-helical core and for a direct interaction between the N- and C-terminal domains. Mol. Endocrinol. 2001;15:1953–1970. doi: 10.1210/mend.15.11.0727. [DOI] [PubMed] [Google Scholar]
- 19.Poulat F., de Santa Barbara P., Desclozeaux M., Soullier S., Moniot B., Bonneaud N., Boizet B., Berta P. The human testis determining factor SRY binds a nuclear factor containing PDZ protein interaction domains. J. Biol. Chem. 1997;272:7167–72. doi: 10.1074/jbc.272.11.7167. [DOI] [PubMed] [Google Scholar]
- 20.Kurashima K., D'Souza S., Szászi K., Ramjeesingh R., Orlowski J., Grinstein S. The apical Na+/H+ exchanger isoform NHE3 is regulated by the actin cytoskeleton. J. Biol. Chem. 1999;274:29843–29849. doi: 10.1074/jbc.274.42.29843. [DOI] [PubMed] [Google Scholar]
- 21.Valadez-Graham V., Razin S.V., Recillas-Targa F. CTCF-dependent enhancer blockers at the upstream region of the chicken α-globin gene domain. Nucleic Acids Res. 2004;32:1354–1362. doi: 10.1093/nar/gkh301. [DOI] [PMC free article] [PubMed] [Google Scholar]
- 22.Mitas M., Mikhitarian K., Walters C., Baron P.L., Elliott B.M., Brothers T.E., Robison J.G., Metcalf J.S., Palesch Y.Y., Zhang Z., et al. Quantitative real-time RT-PCR detection of breast cancer micrometastasis using a multigene marker panel. Int. J. Cancer. 2001;93:162–171. doi: 10.1002/ijc.1312. [DOI] [PubMed] [Google Scholar]
- 23.Livak K.J., Schmittgen T.D. Analysis of Relative Gene Expression Data Using Real-Time Quantitative PCR and the 2−ΔΔCT Method. Methods. 2001;25:402–408. doi: 10.1006/meth.2001.1262. [DOI] [PubMed] [Google Scholar]
- 24.Zhao C., Yasui K., Lee C.J., Kurioka H., Hosokawa Y., Oka T., Inazawa J. Elevated expression levels of NCOA3, TOP1, and TFAP2C in breast tumors as predictors of poor prognosis. Cancer. 2003;98:18–23. doi: 10.1002/cncr.11482. [DOI] [PubMed] [Google Scholar]
- 25.Girault I., Lerebours F., Amarir S., Tozlu S., Tubiana-Hulin M., Lidereau R., Bièche I. Expression analysis of estrogen receptor α coregulators in breast carcinoma: evidence that NCOR1 expression is predictive of the response to tamoxifen. Clin. Cancer Res. 2003;9:1259–1266. [PubMed] [Google Scholar]
- 26.Leygue E., Dotzlaw H., Watson P.H., Murphy L.C. Expression of the steroid receptor RNA activator in human breast tumors. Cancer Res. 1999;59:4190–4193. [PubMed] [Google Scholar]
- 27.Fox S.B., Brown P., Han C., Ashe S., Leek R.D., Harris A.L., Banham A.H. Expression of the forkhead transcription factor FOXP1 is associated with estrogen receptor α and improved survival in primary human breast carcinomas. Clin. Cancer Res. 2004;10:3521–3527. doi: 10.1158/1078-0432.CCR-03-0461. [DOI] [PubMed] [Google Scholar]
- 28.Bouras T., Southey M.C., Venter D.J. Overexpression of the steroid receptor coactivator AIB1 in breast cancer correlates with the absence of estrogen and progesterone receptors and positivity for p53 and HER2/neu. Cancer Res. 2001;61:903–907. [PubMed] [Google Scholar]
- 29.Curtis C., Shah S.P., Chin S.-F., Turashvili G., Rueda O.M., Dunning M.J., Speed D., Lynch A.G., Samarajiwa S., Yuan Y., et al. The genomic and transcriptomic architecture of 2000 breast tumours reveals novel subgroups. Nature. 2012;486:346–352. doi: 10.1038/nature10983. [DOI] [PMC free article] [PubMed] [Google Scholar]
- 30.Radvanyi L., Singh-Sandhu D., Gallichan S., Lovitt C., Pedyczak A., Mallo G., Gish K., Kwok K., Hanna W., Zubovits J., et al. The gene associated with trichorhinophalangeal syndrome in humans is overexpressed in breast cancer. Proc. Natl. Acad. Sci. U.S.A. 2005;102:11005–11010. doi: 10.1073/pnas.0500904102. [DOI] [PMC free article] [PubMed] [Google Scholar]
- 31.Zhao H., Langerød A., Ji Y., Nowels K.W., Nesland J.M., Tibshirani R., Bukholm I.K., Kåresen R., Botstein D., Børresen-Dale A.-L., et al. Different gene expression patterns in invasive lobular and ductal carcinomas of the breast. Mol. Biol. Cell. 2004;15:2523–2536. doi: 10.1091/mbc.E03-11-0786. [DOI] [PMC free article] [PubMed] [Google Scholar]
- 32.Richardson A.L., Wang Z.C., De Nicolo A., Lu X., Brown M., Miron A., Liao X., Iglehart J.D., Livingston D.M., Ganesan S. X chromosomal abnormalities in basal-like human breast cancer. Cancer Cell. 2006;9:121–32. doi: 10.1016/j.ccr.2006.01.013. [DOI] [PubMed] [Google Scholar]
- 33.Voltz J.W., Weinman E.J., Shenolikar S. Expanding the role of NHERF, a PDZ-domain containing protein adapter, to growth regulation. Oncogene. 2001;20:6309–6314. doi: 10.1038/sj.onc.1204774. [DOI] [PubMed] [Google Scholar]
- 34.Zhang J.F.M. Signaling complex organization by PDZ domain proteins. Neurosignals. 2002;11:315–321. doi: 10.1159/000068256. [DOI] [PubMed] [Google Scholar]
- 35.Harris B.Z., Lim W.A. Mechanism and role of PDZ domains in signaling complex assembly. J. Cell Sci. 2001;114:3219–3231. doi: 10.1242/jcs.114.18.3219. [DOI] [PubMed] [Google Scholar]
- 36.Fouassier L., Yun C.C., Fitz J.G., Doctor R.B. Evidence for Ezrin-Radixin-Moesin-binding phosphoprotein 50 (EBP50) self-association through PDZ-PDZ interactions. J. Biol. Chem. 2000;275:25039–25045. doi: 10.1074/jbc.C000092200. [DOI] [PubMed] [Google Scholar]
- 37.Xu X.-Z.S., Choudhury A., Li X., Montell C. Coordination of an array of signaling proteins through homo- and heteromeric interactions between PDZ domains and target proteins. J. Cell Biol. 1998;142:545–555. doi: 10.1083/jcb.142.2.545. [DOI] [PMC free article] [PubMed] [Google Scholar]
- 38.Smith C.L., O’Malley B.W. Coregulator function: a key to understanding tissue specificity of selective receptor modulators. Endocr. Rev. 2004;25:45–71. doi: 10.1210/er.2003-0023. [DOI] [PubMed] [Google Scholar]
- 39.Anzick S.L., Kononen J., Walker R.L., Azorsa D.O., Tanner M.M., Guan X.-Y., Sauter G., Kallioniemi O.-P., Trent J.M., Meltzer P.S. AIB1, a steroid receptor coactivator amplified in breast and ovarian cancer. Sci. 1997;277:965–968. doi: 10.1126/science.277.5328.965. [DOI] [PubMed] [Google Scholar]
- 40.Xu J., Wu R.-C., O’Malley B.W. Normal and cancer-related functions of the p160 steroid receptor co-activator (SRC) family. Nat. Rev. Cancer. 2009;9:615–630. doi: 10.1038/nrc2695. [DOI] [PMC free article] [PubMed] [Google Scholar]