


Abstract
Nuclear lamins contact the genome at the nuclear periphery through large domains and are involved in chromatin organization. Among broad peak calling algorithms available to date, none are suited for mapping lamin–genome interactions genome wide. We disclose a novel algorithm, enriched domain detector (EDD), for analysis of broad enrichment domains from chromatin immunoprecipitation (ChIP)-seq data. EDD enables discovery of genomic domains interacting with broadly distributed proteins, such as A- and B-type lamins affinity isolated by ChIP. The advantages of EDD over existing broad peak callers are sensitivity to domain width rather than enrichment strength at a particular site, and robustness against local variations.
INTRODUCTION
The eukaryotic nucleus is bounded by the nuclear envelope. The nuclear envelope consists of double membrane and, interfacing the inner membrane and chromatin, a meshwork of filamentous proteins called lamins (1). Lamins are involved in the regulation of many nuclear functions including chromatin organization (1,2). Mutations in lamin A (LMNA) cause diseases commonly referred to as laminopathies, which include partial lipodystrophies, myodystrophies or premature aging (3,4). Moreover, variations in B-type lamin level and distribution (in particular lamin B1; LMNB1) have been associated with aging and senescence (5–8). A- and B-type lamins interact with chromatin through lamina-associated domains or LADs, of typically 0.1 to 10 megabases (Mb) (9–13). LADs have initially been identified using DamID, an assay relying on the tagging of DNA sequences in proximity to nuclear lamins, and identification of these sequences (2,9). Important features of LADs are their gene-poor content, the repressed state of genes within them, and their enrichment in heterochromatin (2,12,14).
LADs have also been evidenced by chromatin immunoprecipitation (ChIP) of LMNA followed by array hybridization (15–17) and by ChIP of LMNB1 followed by high-throughput sequencing (ChIP-seq) (6,7). Lamins tend to be widely distributed on chromosomes, with regions of low occupancy (6,7,9,11,12,16). Therefore, lamin ChIP-seq data differ in distribution and signal-to-noise ratio from more ‘conventional’ ChIP-seq data for, for instance, focused histone post-translational modifications (hPTMs) or transcription factors (TFs), which show narrow and strong enrichment (18,19). Broad and low-level enrichment cannot be detected by ChIP-seq peak callers, such as MACS which are designed to detect hPTMs or TFs in narrow windows (20).
Several algorithms have been designed to detect broader peaks of enrichment. These include SICER, a clustering approach for domain identification (21); HPeak (22) and RSEG (23), two hidden Markov Model-based programs; PeakRanger (in particular the CCAT algorithm), detecting broad regions and summits within (24,25); and BroadPeak which identifies wide peaks over a low-level profile (26). These programs are designed to discover regions of hPTM enrichment wider than peaks of TF binding; however these regions are narrower than the megabase-size domains interacting with lamins (2), questioning the applicability of these algorithms to the detection of LADs. In addition, BroadPeak lacks support for ‘input’ chromatin sequences (26), i.e. sequences from fragmented chromatin not enriched in any specific protein by immunoprecipitation (unlike the ChIP sample) and commonly used as reference against ChIP samples in the analysis. This makes BroadPeak unsuitable for analysis of ChIP-seq data that do not display a prominent difference between actual enrichment and background. SICER and PeakRanger detect putative peaks based on the ChIP data alone, and only later in the analysis do they incorporate input data to evaluate the significance of the putative peaks (21,24). RSEG segments the genome into foreground and background domains by identifying boundaries with significant transition probabilities, without taking the actual enrichment level in foreground domains into account (23). As lamin domains identified by RSEG have very large genome coverage, with many domains displaying very low enrichment levels, we found that RSEG is too lenient in a lamin context (see below). These limitations may in practice be irrelevant when analyzing hTPM domains or similar ChIP-seq data; however they constitute a major hindrance in the analysis of ChIP-seq data for lamins and other broadly distributed chromatin-bound proteins.
To alleviate these limitations, we developed an algorithm called enriched domain detector (EDD). We benchmark EDD against other broad peak callers using published lamin ChIP-seq data. We show that EDD enables quantitative analysis of ChIP-seq data for proteins widely distributed and with low-level enrichment on chromatin. We also demonstrate that EDD can discover genomic domains enriched in LMNA using new ChIP-seq data for LMNA. The main advantage of EDD over other peak callers is sensitivity to the width of enriched domains rather than enrichment strength at a particular site, and robustness against local variations.
MATERIALS AND METHODS
Cells
Human normal dermal fibroblasts (Lonza CC-2511; LDFs) and human normal primary dermal fibroblasts (Norwegian Stem Cell Center AD04DFs) were cultured in DMEM/F12 with 13% FCS, 2 ng/ml basic fibroblast growth factor and antibiotics. Cells were exponentially growing and harvested at confluency, at passage 5–7. AD04DFs were obtained with Norwegian Ethics Committee Approval REK2617A.
Lamin A ChIP-seq
Cells (107 per ChIP) were cross-linked in suspension for 10 min in PBS containing 1% formaldehyde before quenching with 1.25 mM glycine. Cells were lysed for 30 min at 4°C on a rotator in RIPA buffer (140 mM NaCl, 10 mM Tris-HCl, pH 8.0, 1 mM EDTA, 0.5 mM EGTA, 1% Triton X-100, 0.1% SDS, 0.1% Na-deoxycholate, 1 mM PMSF, 1x protease inhibitor cocktail) adjusted to 1% SDS, and sonicated for 3x 15 min in a Bioruptor (Diagenode; 30 s on/off at high power) to generate chromatin fragments of ∼200–400 base pairs (bp). After sedimentation, chromatin was diluted 10-fold in RIPA without SDS, and incubated on a rotator overnight at 4°C with 50 μg lamin A/C antibody (Santa Cruz sc-7292) pre-coupled to magnetic Dynabeads Protein G (16) (Invitrogen). Irrelevant mouse IgGs were used as control. ChIP material was collected and washed 3x in 1 ml ice-cold RIPA buffer. Crosslink was reversed and DNA eluted for 6 h on a shaker at 37°C in elution buffer (50 mM NaCl, 20 mM Tris-HCl, pH 7.5, 5 mM EDTA, 1% SDS) containing 0.5 μg/ml RNase A and 2 μg/ml Proteinase K. DNA was purified (16), the library was prepared (Illumina) and sequenced on an Illumina HiSeq2500.
ChIP-seq data processing
The following pipeline was used for analysis of all LMNA and LMNB1 data sets. Reads were aligned to the HG19 reference genome using Bowtie2 v2.1.0 with default parameters (27). Duplicate reads were removed using Picard's MarkDuplicates program with parameter REMOVE_DUPLICATES set to true (keeping duplicate reads does not significantly affect LAD detection because of the large size of LADs; Supplementary Table S1). To avoid any normalization bias, we ensured that each pair of aligned input and ChIP read files had the same read depth, by using Picard's DownsampleSam program v1.86 (www.broadinstitute.org/gatk//events/2038/GATKwh0-BP-1-Map_and_Dedup.pdf) on the larger of the two files.
Peak calling
We used auto-estimated parameters, when possible, for all the peak callers considered. For parameters that had to be set manually, we scripted the peak calling process for each individual peak caller; this allowed testing a range of possible values for the analysis. We then inspected the results in a genome browser after an initial screening process where we removed clearly suboptimal results (e.g. no coverage detected, or peak coverage close whole genome coverage).
PeakRanger v1.17
We used the CCAT algorithm, designed for detection of broad peaks with a window size of 500 bp and a step size of 50 bp.
SICER v1.1
We used a window size of 200 bp and allowed gaps up to 600 bp. The LMNA reads are 51 bp and effective genome size was computed to 0.77; LMNB1 reads are 36 bp and effective genome size was computed to 0.72. Genome sizes were in both cases computed according to SICER's instructions. Fragment size was set to 300 bp and false discovery rate (FDR) cutoff to 0.1.
BroadPeak
BroadPeak expects a source file with ChIP read counts per bin and does not directly support input read counts. A workaround has however been proposed (26); it consists in subtracting the number of input reads from the number of ChIP reads in bins with more ChIP reads than input reads, and setting the read count to 0 in the other bins. We tested both approaches (i.e. considering only ChIP reads, or ChIP reads with input read subtraction), and found that subtracting input reads gave the most convincing results with our data. We were unable to run Broadpeak with other window sizes than the default 200 bp.
RSEG v0.4.8
We used RSEG's deadzones program to find non-alignable regions in HG19 for both 36 bp (LMNB1 ChIP) and 51 bp (LMNA ChIP) read lengths. We then used the rseg-diff program in mode 2 (for ChIP versus input) to analyze each pair of ChIP and input files with the appropriate deadzones file.
EDD v1.0
LMNB1 data were analyzed using a 3 Kb bin size and a gap penalty of 12. LMNA data were analyzed using an 11 Kb bin size and a gap penalty of 5 for LDF and AD04DF_rep1 and 4 for AD04DF_rep2. Confidence intervals for  (see the Results section) were determined using the normal approximation method for binomial proportions.
Lamin A ChIP-qPCR
Purified LMNA ChIP DNA was eluted in 30 μl H2O and 2.5 μl used as template for quantitative polymerase chain reaction (qPCR) with primers listed in Supplementary Table S2. PCRs were run on a MyiQ Real-time machine with SYBR® Green (BioRad) in duplicates, with 95°C for 3 min and 40 cycles of 95°C for 30 s, 60°C for 30 s and 72°C for 30 s.
RNA-seq
Total RNA was isolated using the Ambion TRIzol® Reagent RNA extraction kit (Life Technologies). A library was prepared (Illumina) and sequenced on an Illumina HiSeq2500. Reads (29.3 × 10⁶) were aligned using Cufflinks and TopHat (28) with default parameters.
Data viewing
Browser views of gene tracks, ChIP-seq data and peaks are shown using Integrated Genomics Viewer (IGV; broadinstitute.org/igv) (29). Unless otherwise indicated, genes considered in the analyses are from the Illumina iGenomes gene annotation with UCSC data source for HG19 (https://support.illumina.com/sequencing/sequencing_software/igenome.ilmn).
Published data sets analyzed
LMNB1 ChIP-seq and corresponding input sequence data (6) were downloaded from NCBI GEO accession number GSE49341.
Data access
Our LMNA ChIP-seq data are available under GEO accession number GSE54334.
RESULTS
Seeking to identify megabase-size chromatin domains: development of EDD
To palliate the current aforementioned limitations, we developed EDD, an algorithm aimed to discover, from ChIP-seq data, megabase-size domains in a putatively ‘noisy’ environment (Figure 1). EDD has been released as a Python package and is installable from Python Package Index (https://pypi.python.org). EDD source code and manual are freely available at http://github.com/CollasLab/edd.
Figure 1.
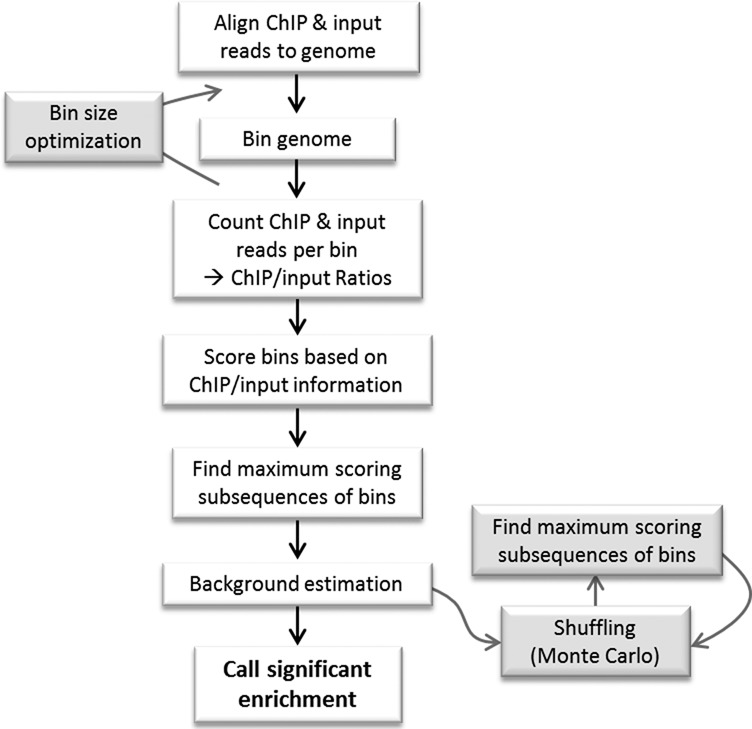
Work-flow diagram of EDD.
EDD aims to identify slight but significant enrichment over broad genomic regions. EDD is optimized for ChIP-seq analysis of proteins localized at the nuclear periphery, such as lamins. These proteins are known to be associated with heterochromatin (30). Thus, EDD is distinct from any other broad peak callers in that it is designed for discovery of enriched domains in mainly, but not exclusively, heterochromatin regions. This is important to consider because input chromatin samples display a non-uniform distribution of reads across the genome (31,32), depending on the extent of chromatin compaction (compact chromatin is more difficult to reverse-crosslink and results in fewer sequence reads). Therefore, a high number of ChIP reads does not per se provide an indication of enrichment; rather, the relationship between ChIP and input read counts is critical. Moreover, sequenced reads provide only a sample of the whole information in the cell population. Thus, reads need to be aggregated into bins to provide sufficient approximation of the ChIP-to-input relationship. Accuracy of this relationship will increase with increasing numbers of reads, and thus with increasing bin size. EDD ensures that these properties are met, also in a heterochromatin context. An additional critical step in EDD is the identification of clusters of enriched bins: this is because EDD aims to identify large genomic compartments predicted from current knowledge of interactions of nuclear envelope proteins with the genome (2,12,14).
Aggregating reads in genomic bins
The initialization step of the EDD algorithm is to bin the genome and count the actual number of ChIP and corresponding input sequence reads in each bin. EDD then calculates for each bin the sample ratio  :
:
 |
As described however, the ChIP and input-sequenced reads provide only a sample of the total information in the chromatin fraction of the cell population examined. Thus, the true ChIP/input signal in a bin, p, is unknown. We aim to use  as an estimate of p, but only when
  is deemed to be a reasonable estimate. To determine this, we compute the 95% confidence interval for
  using the Agresti–Coull method (33). We observed that extreme values of
  (i.e.
(i.e.  very close to 0 or 1) are almost exclusive to bins with few reads and a large confidence interval. We found downstream analysis to be more robust against noise if we ensured, by increasing bin size, that
  was a good estimate for p in most bins: we only use
  as an estimate of p in bins where the confidence interval is below a threshold, by default 0.25; we refer to this subset of bins as ‘informative bins’. EDD selects the smallest bin size that generates at least 99% informative bins, excluding bins without reads. As a result, three bin classes are generated: non-informative bins (NIBs), enriched informative bins with
  > 0.5 (EIBs; i.e. bins enriched in lamin) and depleted informative bins with
  ≤ 0.5 (DIBs; i.e. bins depleted of lamin).
Bin scoring
Bins must be scored prior to searching for putative peaks. We seek to assign EIBs a positive score weighted on  , assign DIBs a negative score weighted on
  , and assign NIBs a weak negative score. Further, we seek to give a strong deterrent to prevent DIBs with
  close to 0 to be included in a peak, and similarly give EIBs with a
  close to 1 a strong encouragement. The logit function:
 |
meets these properties.
We must additionally select a gap penalty that influences the cost of peaks spanning DIBs and NIBs. A relative weak gap penalty will often result in the detection of very large domains, missing potentially interesting fluctuations within domains. Conversely, a disproportionally strong gap penalty will miss many domains with a slight heterogeneity. The choice of gap penalty depends on both the data analyzed and the interests of the researcher. The bin scoring function is thus defined as:
 |
where G is the gap penalty.
If the gap penalty is not specified, then EDD will choose the gap penalty that optimizes the function:
 |
where EPR (enriched peak ratio) is the ratio of EIBs in peaks and ECR (enriched coverage ratio) is the ratio of EIBs in the whole genome that are covered by peaks. This is the function that best predicts the manually selected gap penalties for the data sets we have analyzed while developing and testing EDD. It is therefore important to inspect the results and potentially manually modify the gap penalty parameter for optimal results (we refer to the EDD manual online for additional information). Lastly, one must decide how to score the NIB bins, that is, the bins with too few reads to score based on  . As we have poor knowledge of their actual enrichment level, we conservatively set their score to the median DIB score.
Detection of clusters
EDD aims to detect significant clusters of EIBs to identify peaks. However as bin classification is imperfect, merely searching for contiguous EIB regions is too restrictive. We use a linear time algorithm for finding all maximal scoring subsequences (MSSs) (34); this algorithm is also used by BroadPeak. Given a sequence of real numbers (bin scores), the MSS algorithm finds the non-overlapping contiguous subsequences with the greatest total scores. The emitted subsequences are potential peaks with a ‘peak score’ equal to the sum of bin scores within the subsequence.
Significance testing
EDD seeks to identify EIB clusters that are highly unlikely to occur by chance; it relies on a Monte Carlo simulation where, for each trial, the order of the bins is shuffled throughout the genome, bin scores are kept constant and the score of the highest scoring maximal subsequence is recorded (Figure 1). Note that EDD requires a list of unalignable regions for the organism analyzed, such as centromeres and telomeres, that should not be shuffled. These regions are all NIBs and would, if shuffled as any other bin, incorrectly decrease the score of the MSS per trial. Additional information on unalignable regions is provided in the EDD manual online.
We observe that the theoretically lowest possible result of a Monte Carlo trial is equal to the highest scoring bin. Thus, we discard all observed putative peaks with a value equal to or less than the highest scoring bin prior to significance testing. For the remaining putative peaks, we compute P-values as:
 |
where s is the score of a potential peak, Ti is the result of Monte Carlo trial i and N is the total number of trials performed. Lastly, we use an FDR procedure [35] to adjust the P-values for multiple testing and report peaks with an FDR value below a user-set threshold.
Configuring EDD
EDD has both required (e.g. input files) and optional (e.g. gap penalty) run-time arguments. In addition, EDD reads other parameters from a user configurable file. The default values for these parameters should be sensible for most uses, but there might be situations where additional fine-tuning is required. Parameters such as the required percentage of informative bins, the confidence interval limit and the method (35) used to compute the confidence interval can be adjusted here (see the EDD manual online for additional information).
Benchmarking EDD against published LMNB1 ChIP-seq data in relation to other broad peak callers
We benchmarked EDD against existing broad peak callers including BroadPeak (26), PeakRanger (24,25), SICER (21) and RSEG (23) on published triplicate LMNB1 ChIP-seq and matched input sequence data accessed from NCBI GEO GSE49341 (6). For simplicity in the description of our analysis, we refer to genomic regions discovered by EDD or other algorithms as ‘peaks’ even though they are large domains rather than narrow and sharp peaks. Total genome coverage under peaks detected by these algorithms varies, from ∼1050–1500 Mb (EDD and RSEG, respectively) to ∼720 Mb (BroadPeak), ∼260 Mb (SICER) and 9–25 Mb (PeakRanger) (Table 1). Numbers of peaks detected also vary, with SICER, BroadPeak and PeakRanger detecting large and variable numbers of peaks between replicates (Table 2). EDD detects 1803–1890 peaks in the three replicates, making it the most consistent of the algorithms tested (Table 2). Variations between algorithms can be explained by their design to detect peaks narrower than LADs: indeed, PeakRanger, BroadPeak, SICER and RSEG detect peaks significantly narrower than EDD peaks (P = 0.0000; Wilcoxon rank-sum test; Figure 2a and b). The low coverage and peak length detected by PeakRanger (Table 2; Figure 2a and b) reveal its unsuitability for LAD discovery; thus it was not further tested in our study.
Table 1. Genome coverage (in Mb) by EDD and current broad peak callers.
| Data set | Cell type | EDD | BroadPeak | PeakRanger | RSEG | Sicer |
|---|---|---|---|---|---|---|
| Lamin B1a | IMR90 fibroblast_rep1 | 1,041.675 | 721.914 | 9.511 | 1,462.367 | 248.291 |
| Lamin B1a | IMR90 fibroblast_rep2 | 1,078.179 | 717.013 | 25.318 | 1,502.753 | 285.394 |
| Lamin B1a | IMR90 fibroblast_rep3 | 1,047.753 | 721.914 | 9.511 | 1,462.367 | 248.291 |
| Lamin A | AD04DF fibroblast_rep1 | 728.178 | 183.268 | 4.123 | 1,797.390 | 10.846 |
| Lamin A | AD04DF fibroblast_rep2 | 721.501 | 185.392 | 4.048 | 1,854.759 | 10.106 |
| Lamin A | LDF fibroblast | 694.661 | 63.357 | 6.473 | 1,495.391 | 14.183 |
aRaw data from ref. (6).
Table 2. Number of peaks detected by EDD and current broad peak callers.
| Data set | Cell type | EDD | BroadPeak | PeakRanger | RSEG | Sicer |
|---|---|---|---|---|---|---|
| Lamin B1a | IMR90 fibroblast_rep1 | 1803 | 16557 | 11827 | 6413 | 35321 |
| Lamin B1a | IMR90 fibroblast_rep2 | 1890 | 22797 | 23422 | 6533 | 43798 |
| Lamin B1a | IMR90 fibroblast_rep3 | 1815 | 30017 | 6285 | 7116 | 46492 |
| Lamin A | AD04DF fibroblast_rep1 | 372 | 12639 | 1924 | 2697 | 937 |
| Lamin A | AD04DF fibroblast_rep2 | 357 | 12639 | 1884 | 2151 | 849 |
| Lamin A | LDF fibroblast | 539 | 793 | 2540 | 2450 | 1546 |
aRaw data from ref. (6).
Figure 2.
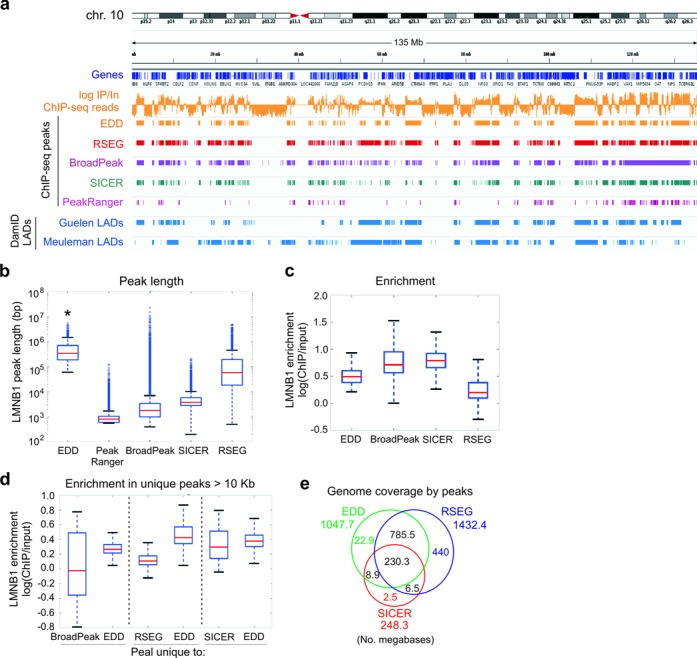
Benchmarking of EDD and other broad peak callers on LMNB1 ChIP-seq data. (a) IGV browser views of LMNB1 occupancy and LADs on chromosome 10, detected by EDD, RSEG, BroadPeak, SICER and PeakRanger from LMNB1 ChIP-seq data from human fibroblasts (6), and by DamID in human fibroblasts (Guelen LADs) (9) and HT1080 human fibrosarcoma cells (Meuleman LADs) (11) (DamID LADs). Tracks also show genes and LMNB1 log ChIP/Input ratios. (b) Median LMNB1 peak length detected by indicated peak callers (P = 0.000…; Wilcoxon rank-sum tests; see Supplementary Table S3 for W- and P-values). (c) Median LMNB1 enrichment within peaks detected by indicated peak callers. (d) Median LMNB1 enrichment within peaks uniquely detected by EDD versus BroadPeak, RSEG, or SICER. (e) Venn diagram analysis of genome coverage under EDD, RSEG and SICER peaks. ChIP-seq data shown are all from replicate 3 of the Sadaie LMNB1 data set (6); similar results were obtained for replicates 1 and 2 in this data set (not shown).
We next characterized LMNB1 enrichment within peaks detected by BroadPeak, SICER and RSEG in comparison to EDD. BroadPeak: Peaks reported by BroadPeak display a wide range of enrichment levels (Figure 2c); however peaks unique to BroadPeak relative to EDD strikingly include regions of ‘negative’ enrichment (log ChIP/Input < 0; Figure 2d, left). This is in sharp contrast to EDD-specific peaks which all show positive enrichment (Figure 2d, left). Thus, EDD prevails over BroadPeak for the detection of LADs. SICER: SICER is aimed to detect hPTMs (21) and again SICER peaks are narrower than typical LADs. Genome coverage of SICER peaks is also very low (Table 1) and SICER detects very few unique peaks relative to EDD (Figure 2e). Thus, SICER is not suitable for LAD discovery. RSEG: RSEG is also designed to detect hPTM domains (23) and was used to detect LMNB1 LADs by Sadaie et al. (6). Most domains detected by EDD are also discovered by RSEG. RSEG also detects many unique domains (Figure 2e), but these show low enrichment compared to all domains detected by EDD (Figure 2c) and to EDD-only domains (Figure 2d, middle). Some of the RSEG domains also show ‘negative’ enrichment (Figure 2b and d), so with this data set RSEG is unable to exclusively discern enriched domains. We conclude that EDD is able to consistently discover large genomic domains enriched in LMNB1 and therefore fulfills its purpose for the detection of LADs. This conclusion is further supported by the consistency between LADs discovered by EDD from the LMNB1 ChIP-seq data, and lamin B LADs identified by DamID in human fibroblasts (9) and in the human HT1080 fibrosarcoma cell line (11) (Figure 2a).
EDD identifies, from ChIP-seq data, megabase domains associated with LMNA
We applied EDD to ChIP-seq data we generated for A-type lamins (LMNA) in two human normal primary dermal fibroblast cultures (LDFs and AD04DFs). LMNA and associated DNA was immunoprecipitated using antibodies to LMNA, which we have recently validated for ChIP (16). To evaluate the performance of EDD on LMNA peak discovery from these data sets, we also benchmarked EDD against BroadPeak, RSEG and SICER.
We slightly modified our original LMNA ChIP protocol (16) by substituting cell lysis and ChIP buffers with a more stringent RIPA buffer to improve lamin solubilization and consistency of chromatin fragmentation. We obtained 25 to > 40 million reads for each LMNA ChIP and input samples. To visualize LMNA profiles, we calculated ratios of ChIP/input reads in 10 Kb bins throughout the genome. In the IGV browser, LMNA ChIP/input log ratios reveal large domains of LMNA enrichment in mainly gene-poor regions, and areas depleted of LMNA (Figure 3a). Our LMNA ChIP-seq data were validated by ChIP-qPCR experiments for several promoter and intergenic regions (Figure 3b). The results show sites of high and low LMNA occupancy, in line with their localization within or outside LADs identified later using EDD.
Figure 3.
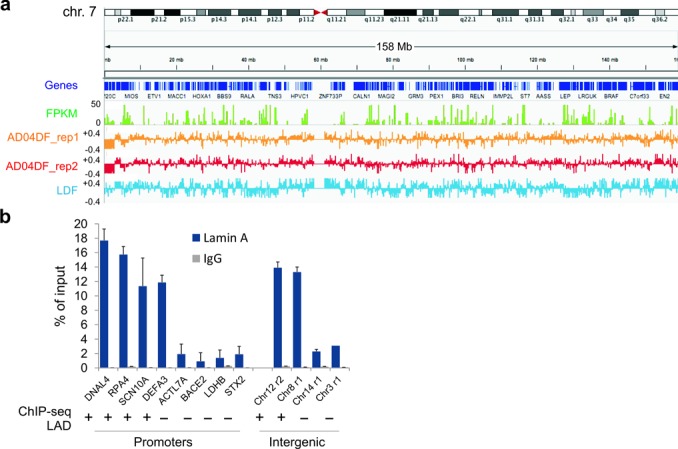
Identification of LMNA occupancy sites by ChIP-seq. (a) IGV browser views of LMNA occupancy throughout chromosome 7 in AD04DF (both ChIP-seq replicates) and LDF. Tracks show genes, FPKM values from RNA-seq data (AD04DFs) and LMNA log ChIP/Input ratios. (b) ChIP-qPCR analysis of LMNA enrichment on indicated promoter and intergenic sites (mean ± SD from three experiments) in AD04DF. LAD information (+, within LAD; -, outside LAD) is from our subsequent LAD discovery using EDD. ChIP-qPCR data are consistent with LAD identification by ChIP-seq.
We next applied EDD to identify LMNA enriched domains and again benchmarked it against BroadPeak, RSEG and SICER (Figure 4a and b). (i) We find that EDD discovers ∼360–540 peaks, or LMNA LADs (Figure 4a, EDD peaks; Table 2), which altogether cover ∼700 Mb (23%) of the genome (Table 1). A browser view shows that LADs detected by EDD are included within the LMNA LADs mapped by DamID in HT1080 cells (11) (Figure 4b). The DamID LADs also appear to cover a wider fraction of the genome than the ChIP-seq LADs (Figure 4b), consistent with earlier observations that DamID-derived LMNA LADs represent ∼50% of the genome (11) (versus 23% with our ChIP-seq LADs). LADs discovered by EDD range from 0.2 to > 10 Mb, with a median size of ∼1 Mb, which is significantly larger than the median size of peaks identified by the other algorithms (median range of < 10 Kb to 100 Kb; P < 10−50, Wilcoxon rank-sum test; Figure 4c). EDD peaks are all enriched in LMNA (Figure 4a; Supplementary Figure S1a), as expected from EDD's purpose. (ii) BroadPeak discovers a high number of peaks (Figure 4b; Table 2), some strikingly covering regions of ‘negative’ enrichment (Figure 4b; Supplementary Figure S1a). Thus, BroadPeak does not appear to be suited for the discovery of LADs. (iii) RSEG identifies eight times more peaks than EDD (Table 2); however as for LMNB1, RSEG also delineates ‘negatively enriched’ regions (Figure 4b; Supplementary Figure S1a). Thus, RSEG appears to be too lenient for the detection of LMNA LADs. (iv) Lastly, genome coverage by SICER peaks is extremely low (Table 1), and SICER identifies narrow (and very few) peaks rather than actual domains (Figure 4b and c). This shows, as with the LMNB1 data set, its unsuitability to accurately identify LADs.
Figure 4.
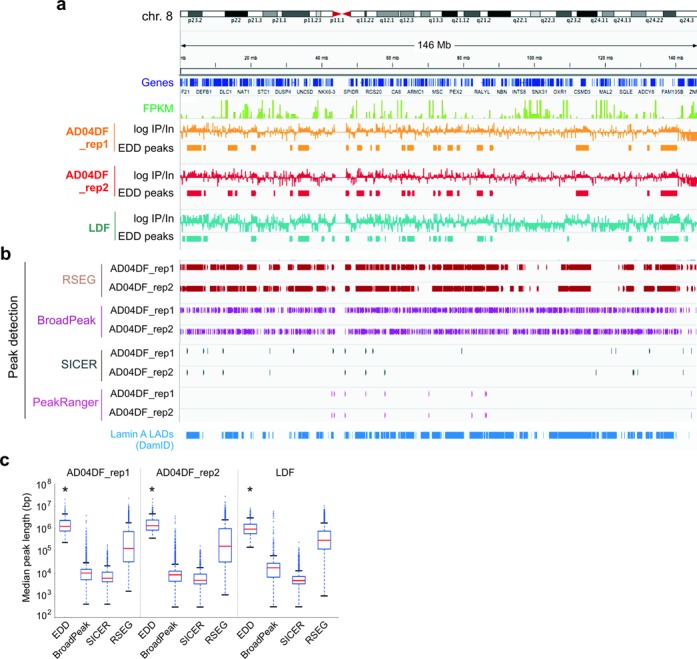
Quantitative analysis of LMNA ChIP-seq data using EDD. (a) IGV browser views of domains enriched in LMNA discovered by EDD (EDD peaks) on chromosome 8 in AD04DF (2 replicates) and LDF. LMNA profiles are shown as log ChIP/Input ratios. Genes and FPKM values (AD04DF) are also shown. (b) LMNA peaks (LADs) identified by RSEG, BroadPeak, SICER and PeakRanger in AD04DF (both ChIP-seq replicates). DamID-derived LMNA LADs in HT1080 cells (11) are also shown (bottom track). (c) Median peak length detected by EDD, BroadPeak, SICER and RSEG in AD04DF_rep1 and rep2, and in LDF (*P < 10−75 relative to BroadPeak, SICER and RSEG; Wilcoxon rank-sum test; see Supplementary Table S3 for W- and P-values).
We demonstrate therefore that, in contrast to the available broad peak callers tested, EDD is able to discover domains enriched in LMNA from ChIP-seq data sets. Our data are also notably the first, to our knowledge, to identify of LMNA LADs from ChIP-seq data.
LMNA LADs discovered by EDD are gene-poor and overall transcriptionally inactive
Considering the overall gene-poor and lowly expressed state of LADs identified by DamID in earlier studies (2), we examined the gene density and expression level of genes within peaks discovered by the different algorithms. From browser views, we note that EDD detects LMNA peaks mainly in gene-poor regions, identified by the absence of RNA-seq reads (no FPKM counts, Figure 4a). In fact, we calculated only 1.6 genes per Mb of EDD peak, while BroadPeak, RSEG and SICER peaks show higher gene density (P < 10−3; Wilcoxon rank-sum test; Figure 5a; Supplementary Figure S1b). Thus, we conclude that LADs discovered by EDD are gene-poor.
Figure 5.
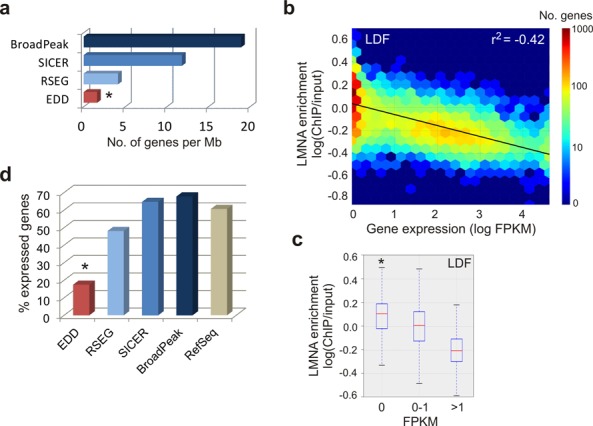
LMNA LADs identified by EDD are gene-poor and overall transcriptionally inactive. (a) Number of protein-coding genes per megabase covered by indicated peak callers in AD04DF (*P < 0.001, Wilcoxon rank-sum test; W = 0 for each comparison). Results for the other data sets are shown in Supplementary Figure S1b. (b) Heat map of LMNA enrichment on protein-coding genes of > 1 Kb as a function of gene expression level (LDF). (c) Median LMNA enrichment on protein-coding genes of > 1 Kb that are repressed (FPKM = 0; 4789 genes), weakly expressed (FPKM = 0–1; 2179 genes) and highly expressed (FPKM > 1; 2097 genes). *P < 10−50 relative to FPKM = 0–1 or FPKM >1; Wilcoxon rank-sum test: see Supplementary Table S3 for W- and P-values. Data for AD04DF are shown in Supplementary Figure S2a and b and Table S3. (d) Percentage of expressed protein-coding genes (FPKM > 0) in peaks discovered by indicated peak callers and among all protein-coding genes; *P = 10−321, Fisher's exact test relative to all genes.
To qualify the relationship between LMNA detection and gene expression, we generated heat maps of LMNA level as a function of gene expression level, independently of LAD identification. The data show that LMNA level negatively correlates with gene expression (LDF, r2 = 0.42, Figure 5b; AD04DF, r2 = 0.22; Supplementary Figure S2a). Further, repressed genes (FPKM = 0) show the highest level of LMNA (P < 10−50; Wilcoxon rank-sum test) compared to weakly expressed (FPKM = 0–1) or highly expressed (FPKM > 1) genes (Figure 5c; Supplementary Figure S2b). Thus, LADs detected by EDD are associated with no or low gene expression, in agreement with the concept of LADs previously established by DamID (9).
To specifically assess how EDD LADs relate to gene expression, we determined the proportion of genes that are expressed among all genes found within EDD, RSEG, SICER and BroadPeak peaks. We show from our RNA-seq data that the proportion of expressed genes (FPKM > 0) within EDD LADs (∼15%, from a mean of 1.6 genes per Mb) is lower than that within RSEG, SICER or BroadPeak peaks (Figure 5d). The latter encompass 45% to 63% of expressed genes, which is similar to the proportion of all expressed genes in the genome (Figure 5d). These results indicate that LADs discovered by EDD are entirely consistent with the properties of LADs previously identified by a different assay (DamID), using different analysis methods and in different cell types (9–12).
We conclude that EDD's conception fulfills its requirement of reproducible discovery of broad LADs from ChIP-seq data. EDD is globally more robust than the other peak callers tested against spatially restricted variations in enrichment level. Our data are also the first to report the discovery of LMNA LADs by ChIP-seq. Discovery and analysis of genomic domains interacting with lamins using ChIP and EDD will not only expand our understanding of nuclear envelope-genome interactions, but also enable high-resolution mapping of putative variations in lamin–genome interactions during development and in the context of lamin-linked diseases (3,4).
DISCUSSION
We present a new genomic domain caller, EDD, for the discovery of broad genomic enrichment areas from ChIP-seq data, against reference input sequence data. The main advantages of EDD over other broad peak callers are its sensitivity to the size of domains rather than the strength of enrichment at a particular site, and its robustness against local variations. Thus, EDD caters a niche that enables quantitative analysis of ChIP-seq data, for example nuclear envelope- and chromatin-associated proteins such as lamins, and other widely distributed chromatin-bound proteins. In addition, EDD is uniquely performant with data showing low-level enrichment over wide genomic regions.
Beside LADs, recent work has identified other large chromatin domains potentially amenable to mapping with EDD (36). For instance, the nuclear envelope protein LAP2α, a lamin- and chromatin-associated protein, displays wide nuclear distribution (37). HMGN5, a histone-like protein, also shows wide genomic distribution and a preference for heterochromatin (38). Regions enriched in the methyl-CpG-binding protein MeCP2, which is spread over methylated DNA but shows enriched regions (39), are also good candidates for mapping using EDD. Additional large genomic domains include (i) domains of hPTMs such as H3R2me1, H3K9me1, H3K9me3, H3K79me1, H3K79me3 or H2BK5me1 (18,40); (ii) wide H3K4me3 or H3K27me3 domains emerging during senescence in culture (6,7,41); (iii) domains occupied by histone variants (42,43); (iv) large organized chromatin lysine modifications or LOCKs (44) shown to overlap with (v) DNA hypomethylated blocks in cancer cells (45). EDD enables the identification of chromatin domains with robustness against local variations, and may prove valuable to detect large-scale epigenetic changes, some of which are predictive of cancer (46).
Elements still remain under consideration for improvement in EDD's performance. EDD is designed to detect megabase-size domains; therefore EDD will miss narrow (1–10 Kb) regions of enrichment if the adjacent regions are not enriched. Similarly, narrow depleted regions within highly enriched megabase domains might be included in a ‘peak’ (domain) in cases where it would be preferable to subdivide the domain. Deeper sequencing and stronger signal-to-noise ratios are two possible ways to improve EDD's sensitivity, as this allows for a smaller bin size.
SUPPLEMENTARY DATA
Supplementary Data are available at NAR Online.
Acknowledgments
We thank Kristin Vekterud for technical assistance in the laboratory.
FUNDING
The Research Council of Norway [191789]; Norwegian Center for Stem Cell Research; University of Oslo. Funding for open access charge: University of Oslo.
Conflict of interest statement. None declared.
REFERENCES
- 1.Burke B., Stewart C.L. The nuclear lamins: flexibility in function. Nat. Rev. Mol. Cell Biol. 2013;14:13–24. doi: 10.1038/nrm3488. [DOI] [PubMed] [Google Scholar]
- 2.Kind J., van Steensel B. Genome-nuclear lamina interactions and gene regulation. Curr. Opin. Cell Biol. 2010;22:320–325. doi: 10.1016/j.ceb.2010.04.002. [DOI] [PubMed] [Google Scholar]
- 3.Worman H.J. Nuclear lamins and laminopathies. J. Pathol. 2012;226:316–325. doi: 10.1002/path.2999. [DOI] [PMC free article] [PubMed] [Google Scholar]
- 4.Schreiber K.H., Kennedy B.K. When lamins go bad: nuclear structure and disease. Cell. 2013;152:1365–1375. doi: 10.1016/j.cell.2013.02.015. [DOI] [PMC free article] [PubMed] [Google Scholar]
- 5.Li Z., Zhu Y., Zhai Y., Castroagudin R., Bao Y., White T.E., Glavy J.S. Werner complex deficiency in cells disrupts the nuclear pore complex and the distribution of lamin B1. Biochim. Biophys. Acta. 2013;1833:3338–3345. doi: 10.1016/j.bbamcr.2013.09.003. [DOI] [PubMed] [Google Scholar]
- 6.Sadaie M., Salama R., Carroll T., Tomimatsu K., Chandra T., Young A.R., Narita M., Perez-Mancera P.A., Bennett D.C., Chong H., et al. Redistribution of the Lamin B1 genomic binding profile affects rearrangement of heterochromatic domains and SAHF formation during senescence. Genes Dev. 2013;27:1800–1808. doi: 10.1101/gad.217281.113. [DOI] [PMC free article] [PubMed] [Google Scholar]
- 7.Shah P.P., Donahue G., Otte G.L., Capell B.C., Nelson D.M., Cao K., Aggarwala V., Cruickshanks H.A., Rai T.S., McBryan T., et al. Lamin B1 depletion in senescent cells triggers large-scale changes in gene expression and the chromatin landscape. Genes Dev. 2013;27:1787–1799. doi: 10.1101/gad.223834.113. [DOI] [PMC free article] [PubMed] [Google Scholar]
- 8.Dreesen O., Chojnowski A., Ong P.F., Zhao T.Y., Common J.E., Lunny D., Lane E.B., Lee S.J., Vardy L.A., Stewart C.L., et al. Lamin B1 fluctuations have differential effects on cellular proliferation and senescence. J. Cell Biol. 2013;200:605–617. doi: 10.1083/jcb.201206121. [DOI] [PMC free article] [PubMed] [Google Scholar]
- 9.Guelen L., Pagie L., Brasset E., Meuleman W., Faza M.B., Talhout W., Eussen B.H., de K.A., Wessels L., de Laat W., et al. Domain organization of human chromosomes revealed by mapping of nuclear lamina interactions. Nature. 2008;453:948–951. doi: 10.1038/nature06947. [DOI] [PubMed] [Google Scholar]
- 10.Peric-Hupkes D., Meuleman W., Pagie L., Bruggeman S.W., Solovei I., Brugman W., Graf S., Flicek P., Kerkhoven R.M., van Lohuizen M., et al. Molecular maps of the reorganization of genome-nuclear lamina interactions during differentiation. Mol. Cell. 2010;38:603–613. doi: 10.1016/j.molcel.2010.03.016. [DOI] [PMC free article] [PubMed] [Google Scholar]
- 11.Meuleman W., Peric-Hupkes D., Kind J., Beaudry J.B., Pagie L., Kellis M., Reinders M., Wessels L., van Steensel B. Constitutive nuclear lamina-genome interactions are highly conserved and associated with A/T-rich sequence. Genome Res. 2013;23:270–280. doi: 10.1101/gr.141028.112. [DOI] [PMC free article] [PubMed] [Google Scholar]
- 12.Kind J., Pagie L., Ortabozkoyun H., Boyle S., de Vries S.S., Janssen H., Amendola M., Nolen L.D., Bickmore W.A., van Steensel B. Single-cell dynamics of genome-nuclear lamina interactions. Cell. 2013;153:178–192. doi: 10.1016/j.cell.2013.02.028. [DOI] [PubMed] [Google Scholar]
- 13.Collas P., Lund E.G., Oldenburg A.R. Closing the (nuclear) envelope on the genome: how nuclear lamins interact with promoters and modulate gene expression. BioEssays. 2014;36:75–83. doi: 10.1002/bies.201300138. [DOI] [PubMed] [Google Scholar]
- 14.Bickmore W.A., van Steensel B. Genome architecture: domain organization of interphase chromosomes. Cell. 2013;152:1270–1284. doi: 10.1016/j.cell.2013.02.001. [DOI] [PubMed] [Google Scholar]
- 15.Kubben N., Adriaens M., Meuleman W., Voncken J.W., van Steensel B., Misteli T. Mapping of lamin A- and progerin-interacting genome regions. Chromosoma. 2012;121:447–464. doi: 10.1007/s00412-012-0376-7. [DOI] [PMC free article] [PubMed] [Google Scholar]
- 16.Lund E., Oldenburg A., Delbarre E., Freberg C., Duband-Goulet I., Eskeland R., Buendia B., Collas P. Lamin A/C-promoter interactions specify chromatin state-dependent transcription outcomes. Genome Res. 2013;23:1580–1589. doi: 10.1101/gr.159400.113. [DOI] [PMC free article] [PubMed] [Google Scholar]
- 17.Lund E., Collas P. Nuclear lamins: making contacts with promoters. Nucleus. 2013;4:424–430. doi: 10.4161/nucl.26865. [DOI] [PMC free article] [PubMed] [Google Scholar]
- 18.Mikkelsen T.S., Ku M., Jaffe D.B., Issac B., Lieberman E., Giannoukos G., Alvarez P., Brockman W., Kim T.K., Koche R.P., et al. Genome-wide maps of chromatin state in pluripotent and lineage-committed cells. Nature. 2007;448:553–560. doi: 10.1038/nature06008. [DOI] [PMC free article] [PubMed] [Google Scholar]
- 19.Ram O., Goren A., Amit I., Shoresh N., Yosef N., Ernst J., Kellis M., Gymrek M., Issner R., Coyne M., et al. Combinatorial patterning of chromatin regulators uncovered by genome-wide location analysis in human cells. Cell. 2011;147:1628–1639. doi: 10.1016/j.cell.2011.09.057. [DOI] [PMC free article] [PubMed] [Google Scholar]
- 20.Zhang Y., Liu T., Meyer C.A., Eeckhoute J., Johnson D.S., Bernstein B.E., Nussbaum C., Myers R.M., Brown M., Li W., et al. Model-based analysis of ChIP-Seq (MACS) Genome Biol. 2008;9:R137. doi: 10.1186/gb-2008-9-9-r137. [DOI] [PMC free article] [PubMed] [Google Scholar]
- 21.Zang C., Schones D.E., Zeng C., Cui K., Zhao K., Peng W. A clustering approach for identification of enriched domains from histone modification ChIP-Seq data. Bioinformatics. 2009;25:1952–1958. doi: 10.1093/bioinformatics/btp340. [DOI] [PMC free article] [PubMed] [Google Scholar]
- 22.Qin Z.S., Yu J., Shen J., Maher C.A., Hu M., Kalyana-Sundaram S., Yu J., Chinnaiyan A.M. HPeak: an HMM-based algorithm for defining read-enriched regions in ChIP-Seq data. BMC Bioinformatics. 2010;11:369–381. doi: 10.1186/1471-2105-11-369. [DOI] [PMC free article] [PubMed] [Google Scholar]
- 23.Song Q., Smith A.D. Identifying dispersed epigenomic domains from ChIP-Seq data. Bioinformatics. 2011;27:870–871. doi: 10.1093/bioinformatics/btr030. [DOI] [PMC free article] [PubMed] [Google Scholar]
- 24.Xu H., Handoko L., Wei X., Ye C., Sheng J., Wei C.L., Lin F., Sung W.K. A signal-noise model for significance analysis of ChIP-seq with negative control. Bioinformatics. 2010;26:1199–1204. doi: 10.1093/bioinformatics/btq128. [DOI] [PubMed] [Google Scholar]
- 25.Feng X., Grossman R., Stein L. PeakRanger: a cloud-enabled peak caller for ChIP-seq data. BMC Bioinformatics. 2011;12:139–149. doi: 10.1186/1471-2105-12-139. [DOI] [PMC free article] [PubMed] [Google Scholar]
- 26.Wang J., Lunyak V.V., Jordan I.K. BroadPeak: a novel algorithm for identifying broad peaks in diffuse ChIP-seq datasets. Bioinformatics. 2013;29:492–493. doi: 10.1093/bioinformatics/bts722. [DOI] [PubMed] [Google Scholar]
- 27.Langmead B., Trapnell C., Pop M., Salzberg S.L. Ultrafast and memory-efficient alignment of short DNA sequences to the human genome. Genome Biol. 2009;10 doi: 10.1186/gb-2009-10-3-r25. [DOI] [PMC free article] [PubMed] [Google Scholar]
- 28.Trapnell C., Roberts A., Goff L., Pertea G., Kim D., Kelley D.R., Pimentel H., Salzberg S.L., Rinn J.L., Pachter L. Differential gene and transcript expression analysis of RNA-seq experiments with TopHat and Cufflinks. Nat. Protoc. 2012;7:562–578. doi: 10.1038/nprot.2012.016. [DOI] [PMC free article] [PubMed] [Google Scholar]
- 29.Robinson J.T., Thorvaldsdottir H., Winckler W., Guttman M., Lander E.S., Getz G., Mesirov J.P. Integrative genomics viewer. Nat. Biotechnol. 2011;29:24–26. doi: 10.1038/nbt.1754. [DOI] [PMC free article] [PubMed] [Google Scholar]
- 30.Geyer P.K., Vitalini M.W., Wallrath L.L. Nuclear organization: taking a position on gene expression. Curr. Opin. Cell Biol. 2011;23:354–359. doi: 10.1016/j.ceb.2011.03.002. [DOI] [PMC free article] [PubMed] [Google Scholar]
- 31.Gaulton K.J., Nammo T., Pasquali L., Simon J.M., Giresi P.G., Fogarty M.P., Panhuis T.M., Mieczkowski P., Secchi A., Bosco D., et al. A map of open chromatin in human pancreatic islets. Nat. Genet. 2010;42:255–259. doi: 10.1038/ng.530. [DOI] [PMC free article] [PubMed] [Google Scholar]
- 32.Lister R., Mukamel E.A., Nery J.R., Urich M., Puddifoot C.A., Johnson N.D., Lucero J., Huang Y., Dwork A.J., Schultz M.D., et al. Global epigenomic reconfiguration during mammalian brain development. Science. 2013;341:1237905. doi: 10.1126/science.1237905. [DOI] [PMC free article] [PubMed] [Google Scholar]
- 33.Agresti A., Coull B.A. Approximate is better than “exact” for interval estimation of binomial proportions. Amer. Stat. 1998;52:119–126. [Google Scholar]
- 34.Ruzzo W.L., Tompa M. A linear time algorithm for finding all maximal scoring subsequences. Proc. Int. Conf. Intell. Syst. Mol. Biol. 1999:234–241. [PubMed] [Google Scholar]
- 35.Brown L.D., Cai T.T., DasGupta A. Interval estimation for a binomial proportion. Stat. Sci. 2001;16:101–107. [Google Scholar]
- 36.Timp W., Feinberg A.P. Cancer as a dysregulated epigenome allowing cellular growth advantage at the expense of the host. Nat. Rev. Cancer. 2013;13:497–510. doi: 10.1038/nrc3486. [DOI] [PMC free article] [PubMed] [Google Scholar]
- 37.Dechat T., Vlcek S., Foisner R. Review: lamina-associated polypeptide 2 isoforms and related proteins in cell cycle-dependent nuclear structure dynamics. J. Struct. Biol. 2000;129:335–345. doi: 10.1006/jsbi.2000.4212. [DOI] [PubMed] [Google Scholar]
- 38.Malicet C., Rochman M., Postnikov Y., Bustin M. Distinct properties of human HMGN5 reveal a rapidly evolving but functionally conserved nucleosome binding protein. Mol. Cell Biol. 2011;31:2742–2755. doi: 10.1128/MCB.05216-11. [DOI] [PMC free article] [PubMed] [Google Scholar]
- 39.Skene P.J., Illingworth R.S., Webb S., Kerr A.R., James K.D., Turner D.J., Andrews R., Bird A.P. Neuronal MeCP2 is expressed at near histone-octamer levels and globally alters the chromatin state. Mol. Cell. 2010;37:457–468. doi: 10.1016/j.molcel.2010.01.030. [DOI] [PMC free article] [PubMed] [Google Scholar]
- 40.Barski A., Cuddapah S., Cui K., Roh T.Y., Schones D.E., Wang Z., Wei G., Chepelev I., Zhao K. High-resolution profiling of histone methylations in the human genome. Cell. 2007;129:823–837. doi: 10.1016/j.cell.2007.05.009. [DOI] [PubMed] [Google Scholar]
- 41.Chandra T., Kirschner, Thuret K., Pope J.Y., Ryba B.D., Newman T., Ahmed S., Samarajiwa K., Salama S.A., Carroll R.T., et al. Independence of repressive histone marks and chromatin compaction during senescent heterochromatic layer formation. Mol. Cell. 2012;47:203–214. doi: 10.1016/j.molcel.2012.06.010. [DOI] [PMC free article] [PubMed] [Google Scholar]
- 42.Banaszynski L.A., Allis C.D., Lewis P.W. Histone variants in metazoan development. Dev. Cell. 2010;19:662–674. doi: 10.1016/j.devcel.2010.10.014. [DOI] [PMC free article] [PubMed] [Google Scholar]
- 43.Ray-Gallet D., Woolfe A., Vassias I., Pellentz C., Lacoste N., Puri A., Schultz D.C., Pchelintsev N.A., Adams P.D., Jansen L.E., et al. Dynamics of histone H3 deposition in vivo reveal a nucleosome gap-filling mechanism for H3.3 to maintain chromatin integrity. Mol. Cell. 2011;44:928–941. doi: 10.1016/j.molcel.2011.12.006. [DOI] [PubMed] [Google Scholar]
- 44.Wen B., Wu H., Shinkai Y., Irizarry R.A., Feinberg A.P. Large histone H3 lysine 9 dimethylated chromatin blocks distinguish differentiated from embryonic stem cells. Nat. Genet. 2009;41:246–250. doi: 10.1038/ng.297. [DOI] [PMC free article] [PubMed] [Google Scholar]
- 45.Hansen K.D., Timp W., Bravo H.C., Sabunciyan S., Langmead B., McDonald O.G., Wen B., Wu H., Liu Y., Diep D., et al. Increased methylation variation in epigenetic domains across cancer types. Nat. Genet. 2011;43:768–775. doi: 10.1038/ng.865. [DOI] [PMC free article] [PubMed] [Google Scholar]
- 46.Teschendorff A.E., Jones A., Fiegl H., Sargent A., Zhuang J.J., Kitchener H.C., Widschwendter M. Epigenetic variability in cells of normal cytology is associated with the risk of future morphological transformation. Genome Med. 2012;4:24. doi: 10.1186/gm323. [DOI] [PMC free article] [PubMed] [Google Scholar]
Associated Data
This section collects any data citations, data availability statements, or supplementary materials included in this article.