


Abstract
Alternative splicing (AS), alternative transcription initiation (ATI) and alternative transcription termination (ATT) create the extraordinary complexity of transcriptomes and make key contributions to the structural and functional diversity of mammalian proteomes. Analysis of mammalian genomic and transcriptomic data shows that contrary to the traditional view, the joint contribution of ATI and ATT to the transcriptome and proteome diversity is quantitatively greater than the contribution of AS. Although the mean numbers of protein-coding constitutive and alternative nucleotides in gene loci are nearly identical, their distribution along the transcripts is highly non-uniform. On average, coding exons in the variable 5′ and 3′ transcript ends that are created by ATI and ATT contain approximately four times more alternative nucleotides than core protein-coding regions that diversify exclusively via AS. Short upstream exons that encompass alternative 5′-untranslated regions and N-termini of proteins evolve under strong nucleotide-level selection whereas in 3′-terminal exons that encode protein C-termini, protein-level selection is significantly stronger. The groups of genes that are subject to ATI and ATT show major differences in biological roles, expression and selection patterns.
INTRODUCTION
Mammals including humans possess surprisingly few protein-coding genes given the size of their genomes and the complexity of their phenotypes. A typical mammalian genome encompasses approximately 20 000–35 000 protein-coding genes, not many more than nematodes or even some protists have (1,2). However, the actual structural and functional diversity of mammalian proteomes is far greater than implied by this modest gene number and is underpinned by the extraordinary complexity of transcriptomes that is generated by alternative splicing (AS) and alternative transcription (AT) (3–5). Deep sequencing of mammalian transcriptomes clearly shows that transcripts from the majority of protein-coding genes undergo alternative processing whereby substantial portions of a gene locus are included in or omitted from different messenger ribonucleic acid (mRNA) isoforms that are often translated into distinct protein variants (6,7). The accurate estimates indicate that up to 95% of multi-exon human genes are subject to AS, and identify approximately 100 000 major alternative events (8). The AS has been traditionally viewed as the principal contributor to the transcriptome diversity (9–12). However, recent studies of mammalian gene expression reveal widespread alternative initiation and alternative termination of transcription (ATI and ATT, respectively) and important contributions of AT to the generation of the transcriptome diversity (2,13–19).
Recent global analyses suggest that pre-mRNA splicing is predominantly co-transcriptional in different organisms (20). The two processes are functionally coupled, and the prevalence of different types of alternative events (AEs) differs between functional regions (e.g. UTRs and CDSs) of transcripts. In particular, AS is common in the 5′-untranslated regions (5′ UTRs) and protein coding sequences (CDS), with a significantly greater fraction of nucleotides involved in AS in the 5′ UTRs compared to the CDS (21–23). In contrast, AS is rare in 3′ UTRs, given the overall low intron density in this region (24,25). The ATI and ATT events occur primarily in the 5′ UTRs and 3′ UTRs, respectively, and in the corresponding ‘grey areas’, the sequences that may belong either to CDSs or to UTRs in mature transcripts as well as to intron sequences in different alternative transcripts (19,23).
Expression of mRNA in animals is a complex and intricately controlled process during which the transcriptional apparatus closely cooperates with pre-mRNA processing machinery. Numerous biochemical and cytological experiments indicate that transcription and mRNA processing, including capping, splicing, polyadenylation and cleavage, form a network of interconnected, elaborately regulated processes that all occur within nuclear ‘gene expression factories’ (26–33). Such tight integration of different aspects of gene expression and transcript processing implies that different types of AEs might not be independent.
The ubiquity of AS and its importance in the generation of the diversity of protein isoforms in mammals have been thoroughly documented but the role of AT has not been studied at the same level of detail. In this work, we assess the relative contributions of different types of AEs to the diversity of mammalian proteins based on the numbers of alternative nucleotides created by these AEs. The results of this analysis show that ATI and ATT are major processes that, in conjunction with AS, generate extensive N-terminal and C-terminal variability of protein isoforms.
MATERIALS AND METHODS
Alternative transcript data sets
We analyzed alternative transcripts of human protein-coding genes deposited in the major databases including hg18/NCBI36 (RefSeq, release 51, UCSC/Ensembl, release 54) and hg19/GRCh37.p13/ (Ensemble/GENCODE, release 74/release 19) assemblies and gene tracks, in which high-quality manual annotations are merged with evidence-based automated annotations across the entire human genome. We also analyzed the mm10/GRCm38 assembly and the Ensembl (release 74) gene tracks of the mouse genome. Coordinates of the human and mouse transcripts, their functional regions and transcript descriptions were downloaded from the UCSC server (http://genome.ucsc.edu/). The GENCODE annotation of the human genome typically contains information about alternative 5′ UTRs and alternative promoters. GENCODE Poly(A) contains annotated poly(A) signals and sites on the genome based on expressed sequence tag (EST) and complementary DNA evidence (3′ end of transcripts containing at least three successive adenine nucleotides not matching the genome). For the present analysis, we considered only transcripts with the complete status of coding regions and annotated translation start and stop, and the known status of the transcription level support (provided by GENCODE, hg19).
To assign alternative transcripts to the corresponding gene loci, we employed clustering method by locus ID and ENSG gene annotation when available. The filtering procedure was applied to all transcriptome/genome databases independently. When grouping transcripts from a database to their gene loci, transcripts from opposite strands, transcripts with open reading frames (ORFs) shorter than 50 codons, and transcripts that overlapped by <50 codons were discarded. For the recent hg19 assembly, all alternative transcripts were clustered by gene locus name (ENSG). This procedure allowed us to exclude from consideration overlapping genes and chimeric transcripts. To group transcripts by coordinates from the UCSC database, where information about gene loci is absent, we first grouped all overlapping transcripts. Then, the resulting group was subdivided into gene loci by picking a seed for a locus and testing whether to add each of the remaining transcripts (19).
The overall statistics for both human genome releases (hg18, hg19) is presented in the Supplementary materials (Supplementary Table S1). The main results are given for the hg19 version of the human genome that was updated to the Ensemble-Havana GENCODE gene set which is the most recent and complete annotation of alternative transcript isoforms (http://genome.ucsc.edu/ENCODE/) The hg18 assembly of the human genome, which is mostly populated with the most abundant and common transcript variants, was used independently to validate the results and demonstrate the stability of the main trends reported in this work. Taking into account the consistency between the results for different genome assemblies and annotations, these results can be considered a conservative estimate for the human transcriptome which currently remains incompletely annotated. Comparison of the hg18 and hg19 versions of the human shows that hg19 includes numerous rare, low abundance and leaky or non-coding transcripts that have been added recently. Many of such transcripts carry short annotated OFRs, which encode truncated, presumably non-functional proteins, and do not overlap significantly with more abundant and well-annotated transcripts with established coding regions. Therefore, more isoforms were removed from the hg19 dataset analysis compared to hg18.
Functional regions of gene loci
Boundaries of the functional regions in gene loci were determined by combining the most upstream and most downstream isoform coordinates and translation start and stop codon annotations for all isoforms mapped to the given locus. For the purpose of this study, we considered five regions within a gene locus, as shown in Figure 1: (i) 5′ UTR (sequence between the first transcription initiation site and the first translation start codon), (ii) ‘5′ grey area’ (sequence between the first and the last translation start codons); (iii) CDS (sequence between the last translation start codon and the first translation stop codon); (iv) ‘3′ grey area’ (sequence between the first and the last translation stop codons) and (v) 3′ UTR (sequence between the last translation stop codon and the last transcription termination site). The use of these conservative criteria and the introduction of ‘grey’ areas ensure that UTRs and core CDS (cCDS) regions are excluded from the analysis of dual-function gene regions (i.e. sequences that are coding in some transcript but non-coding in others). Only isoforms with reliable hits (E-value < 10−4) against genomic sequences were considered for this analysis (34,35). Exon coordinates in the data sets were mostly unambiguous, with the exception of occasional adjacent exons; such exons were merged into one. For each transcript, we counted the number of exons and introns that belong to each functional region. For each exon and intron located entirely within a functional region, one was added to the appropriate tally. For those exons that are partitioned between functional regions of a gene, the tally for each region was incremented proportionally to the fraction of the nucleotides that belong to that region. Each nucleotide position was classified as constitutive (belonging to an exon in every isoform), alternative (positions that belong to an exon in at least one but not all isoforms of the given gene locus), or intronic (not belonging to an exon in any of the isoforms).
Figure 1.

Anatomy of mammalian transcripts: functional domains, constitutive and alternative nucleotides and alternative events. TI, transcription initiation site; AUG, translation initiation site; TT, transcription termination site; translation termination site; ATI, alternative transcription initiation; AS, alternative splicing; ATT, alternative transcription termination. Protein-coding regions are filled by black (in cCDSs) or by dark grey (in grey areas). UTRs are shown in white (for UTRs) and in light grey (for grey areas).
Classification of nucleotides involved in different types of alternative events
ATI and ATT groups of genes were classified based on the annotation of alternative promoters and poly(A) signals in the human genome (hg19), as described above. Alternative splicing in the 5′- and 3′-terminal regions strongly depends on alternative transcription events. The choice of transcription initiation site on genomic DNA is the primary event that defines selection of downstream splicing sites and AT-dependent alternative splicing pattern at the ends of transcripts. As described earlier (19), the involvement of nucleotides in ATI and ATT was assessed by analysis of all alternative isoforms transcribed from a gene locus where both 5′- and 3′-terminal alternative regions may incorporate AT-dependent alternative splicing events. In each transcript, alternative nucleotides that belong to the terminal exons located in the 5′ UTR and/or 5′ grey area of a gene locus were attributed to ATI. Similarly, alternative nucleotides that belong to the terminal exons located in 3′ grey area and/or 3′ UTR of a gene locus were attributed to ATT. The remaining alternative nucleotides were considered as resulting from AS. To assess the reliability of the classification of alternative events based on the annotation of alternative promoters in UCSC database, the list of gene loci classified as employing ATI (with stringent 300–50 000 nucleotide thresholds) was compared to the database (dbTSS) of experimentally determined transcription start sites (TSS) (36). We found that 90 and 75% of the transcription starts from the UCSC transcripts were located within 300 and 100 nucleotides, respectively, from experimentally identified TSSs. The GENCODE Poly(A) annotation was verified by searching for polyadenylation (polyA) sites within 30 nucleotides from the annotated transcript ends for all transcripts in the databases (37).
We evaluated expression profiles of alternative isoforms with distinct and unique first alternative exons transcribed from different promoters in the same human gene loci for approximately 1500 genes from our initial dataset. Isoforms with short first exons (<50 nucleotides) or exons containing repeats were excluded from this analysis. Expression values were assigned from the Affymetrix Human Exon 1.0 ST microarrays data (http://www.affymetrix.com/support/technical/sample_data/exon_array_data.affx) (18).
Statistical tests (Mann–Whitney U test, chi-squared test, Fisher exact (F) and t-tests) were applied to the comparisons and analysis of constitutive and alternative regions of gene loci.
Estimation of evolutionary rates and selection pressure
The human-macaque (macaque version MMUL1) orthologous gene pairs and their coordinates were downloaded from the UCSC database. The UTR alignments were generated using the OWEN alignment tool (38) with the following criteria: a P-value < 0.001 for each hit and UTRs bounded at the 3′ or 5′ ends by exons aligning through >80% of their length. Alignments of the nucleotide sequences of the CDSs were guided by the amino acid sequence alignment (34,38). Alignments of putative orthologs were cleaned using reported thresholds and low-quality alignments were discarded. In all, a total of ∼13 000 human-macaque gene alignments were generated.
Rates of synonymous (Ks) and non-synonymous (Kn) substitutions for the CDS were calculated using the Pamilo-Bianchi-Li method (39) which takes into account transition and transversion rates. For the 5′ UTRs and 3′ UTRs, the rates of divergence were calculated using Kimura's two parameter model (40). The protein selection pressure (PSP) was estimated as the ratio between the Kn values for alternative and constitutive coding sequences (Kn alt/Kn constant) in a locus. The RNA/nucleotide selection pressure (RNSP) for each polymorphic gene locus was estimated as the ratio between the Ks values for constitutive and alternative coding regions (Ks constant/Ks alt) in a locus (41).
Functional annotation of protein-coding regions
CDD search
For each human protein region, the RPS-BLAST program search with an expectation value 0.01 against the current version of the conserved domain database (CDD) (http://www.ncbi.nlm.nih.gov/Structure/bwrpsb/bwrpsb.cgi) was used to identify known protein domains (42).
Phosporylation sites
Experimentally identified protein phosphorylation sites were mapped to alternative and constitutive exons using the GenBank annotation based on the information from the human protein reference database (release 9; www.hprd.org) and the distributions and densities of these sites in the core and terminal protein regions were compared.
IDR analysis
Intrinsically disordered regions (IDRs) were predicted with the IUPred (http://iupred.enzim.hu/) and DISPROT (http://www.dabi.temple.edu/disprot/index.php) software. The data were compared to the protein domain prediction results, regions which show inconsistency between these predictions were not considered in the analysis.
Gene expression analysis
-
Microarray data
Microarray expression data for normal human tissues were downloaded from the UCSC genome browser (43) (table hgFixed.gnfHumanAtlas2All). Probes lacking a unique assignment to a gene and averaged expression profiles for multiple probes associated with the same gene were discarded. Tissue-specific scores were averaged between the two repetitions. All tissue-specific scores were normalized by their respective medians, and the normalized median value was used to represent the characteristic expression level of a gene across all tissues. Gene expression breadth was defined as the number of tissues where the normalized expression value exceeded a threshold which was adjusted to produce close fractions of wide- and narrow-expressed genes (44).
-
RNA-Seq data
Gene expression was evaluated as the number of reads that map per kilobase of exon model per million mapped reads (RPKM) for each gene using published RNA-seq data as reported by Wang et al. (45). The mRNA expression level and breadth were estimated for genes based on the RNA-seq data for different tissues using reads that mapped to constitutive exons assigned to each ENSG gene locus. The tissues include adipose, brain, breast, cerebellum, colon, heart, liver, lymph node, skeletal muscle and testes. Tissue-specific scores were normalized by their respective tissue-specific medians. The median normalized value across all tissues was used to represent the characteristic expression level of a gene.
-
EST abundance
Expressed Sequence Tags (ESTs) were used to analyse the connections between alternative splicing and gene expression in different tissues. Gene expression levels were evaluated by tallying the numbers of gene-specific EST sequences in the databases. Transcript sequences from the UCSC and RefSeq databases were aligned with EST libraries (ESTs from the human normal tissue GenBank; release 071808) using the BLASTN program as described previously (35). Briefly, EST hits with identity >95% and longer than 80% of the EST sequence length were accepted as matches. Gene expression levels were calculated for 57 normal human tissues based on EST abundance. A Monte Carlo approximation, Fisher's exact test and t-test were used to assess the significance of the differences between the EST data for different sets. Expression data were presented as ‘expression units’ consisting of a tissue marker, a list of transcripts matching the given EST, and the expression level as previously described (35).
RESULTS
Predominant terminal extension of protein-coding regions through alternative transcription
To characterize the acquisition of novel, alternative coding sequences by mammalian genes, we performed detailed analysis of the human and mouse mRNAs in the RefSeq, Ensembl and UCSC databases [http://genome.ucsc.edu/; (46)], which contain the most representative collections of full-length alternative transcripts (Supplementary Table S1). Protein coding, intron-containing mammalian gene loci were classified into two groups: (i) monomorphic genes with one annotated isoform and (ii) polymorphic genes that produce multiple alternative transcripts. Here we focus on the polymorphic genes. The sequences of these genes were partitioned into five regions: (i) 5′ UTR; (ii) 5′ ‘grey area’ between the proximal and distal start codons that are annotated in the given gene; (iii) cCDS, i.e. the region between the distal start codon and the proximal stop codon; (iv) 3′ grey area between the proximal and distal stop codons in gene loci and (v) 3′ UTR (Figure 1). The 5′ and 3′ grey areas are those parts of a gene locus that are located between the first and the last translation start (5′) or stop (3′) codons. Thus, the grey areas contain sequences that are retained in some isoforms but are missing in other isoforms as well as sequences that belong to the 5′ or 3′ UTR in some transcripts but to the CDS in other transcripts (hereinafter dual-function sequences).
As shown previously, polymorphic genes are significantly enriched for introns compared to monomorphic genes (44) (also see Figure 2A and Table 1). However, the difference between the distributions of introns numbers in the two classes of genes was much less pronounced in the CDS compared to the entire gene loci (compare Figure 2A and B, indicating that the difference in intron content was largely confined to the grey areas. In agreement with this observation, a strong correlation was detected between the number of introns and the number of alternative nucleotides in 5′ and 3′ grey areas (Supplementary Figure S1). In contrast, there was no such correlation for the CDS, 5′ UTRs and 3′ UTRs (Supplementary Figure S2).
Figure 2.
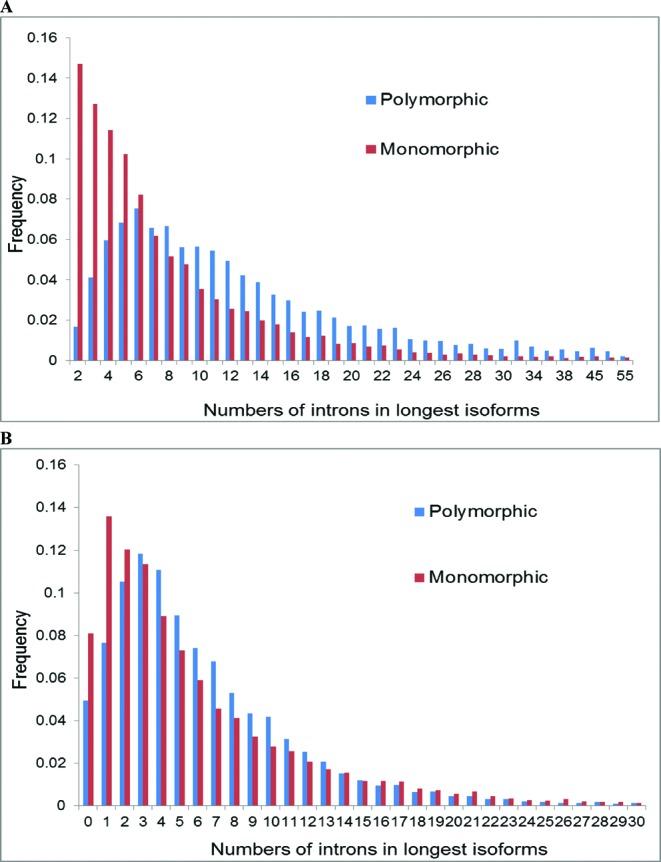
Distributions of introns in longest isoforms transcribed from polymorphic and monomorphic gene loci (A) and in their protein coding regions (B).
Table 1. (A) Numbers of introns and isoforms in monomorphic (mono) and polymorphic (poly) genes in the human genome (hg18 and hg19). (B) Distributions of constitutive and alternative nucleotides located in the core (cCDS alt) or terminal (5grey alt, 5grey dual, 3grey alt, 3grey dual) coding regions of polymorphic gene loci (Ensembl, hg19).
| A. | ||||||
|---|---|---|---|---|---|---|
| Gene group | Intron # max | Intron # mean | # of isoforms | |||
| B. | ||||||
| CDS con | cCDS alt | 5grey alt | 5grey dual | 3grey alt | 3grey dual | |
| hg18 | ||||||
| Mono+Poly | 10.14 ± 0.63 | 8.9 ± 0.40 | ||||
| Mono | 7.98 ± 0.61 | 7.98 ± 0.61 | 1 | |||
| Poly | 13.02 ± 0.13 | 10.65 ± 0.53 | 3.56 ± 0.13 | |||
| hg19 | ||||||
| Mono+Poly | 10.35 ± 0.11 | 8.9 ± 0.12 | ||||
| Mono | 7.8 ± 0.11 | 7.8 ± 0.11 | 1 | |||
| Poly | 12.99 ± 0.1 | 9.8 ± 0.08 | 4.07 ± 0.02 | |||
| # seq | 17 718 | 11 811 | 7 524 | 5 011 | 10 397 | 6 145 |
| average nt | 866.6 | 200.2 | 283.0 | 133.0 | 496.2 | 378.3 |
| # nt | 14 674 986 | 2 364 981 | 2 129 403 | 666 591 | 5 159 400 | 2 324 934 |
| Sum terminal alternative (with dual) | ||||||
| # nt | 10 280 328 | |||||
| Sum total alternative (with dual) | ||||||
| # nt | 12 645 309 | |||||
Abbreviations: con,constitutive; alt, alternative, dual, dual function; nt, nucleotides; seq, sequences.
To identify alternative events that are responsible for the excess of introns in the grey areas, we analysed the distribution of introns in the groups of polymorphic gene loci employing different types of AEs: (i) alternative splicing, AS; (ii) alternative transcription initiation from distinct transcription starts yielding alternative promoters and 5′-terminal exons, ATI; (iii) alternative transcription termination on distinct alternative polyadenylation sites, ATT and (iv) combination of ATI and ATT. The alternative events were classified based on the gene annotation of human genome, as described under Materials and Methods. Briefly, unique, distinct alternative terminal exons that mapped to the 5′ ends of transcripts with annotated alternative promoters were attributed to ATI. Similarly, distinct alternative exons that mapped to the 3′ ends of transcripts with distinct Poly(A) signals were attributed to ATT. It should be emphasized that genes attributed to both ATI and ATT may also employ AS.
Genes in the AS group that produce alternative isoforms with the same transcription starts and ends typically contain short grey areas depleted of introns (Figures 3 and 4). In contrast, genes in the ATI, ATT and ATI+ATT groups contain long 5′ grey areas, 3′ grey areas and both grey areas, respectively, and show a concomitant, dramatic excess of introns (Figures 3 and 4, Supplementary Table S2). These observations suggest that acquisition of intron-containing, in particular dual-function sequences, by mammalian protein-coding genes occurs primarily at the junctions of non-coding and coding regions (Table 1). The principal mechanisms that lead to the acquisition of such sequences are ATI and ATT rather than AS but the terminal regions in the longer transcript isoforms provide additional room for AS resulting in coupling between different types of AEs. Overall, protein-coding regions in the human polymorphic gene loci contain comparable numbers of constitutive and alternative coding nucleotides (Table 1, Figure 3). Notably, however, over 80% of protein-coding alternative nucleotides are located in the 5′ and 3′ grey areas (Table 1B). Analysis of the mouse genome identified the same trend of predominant terminal extension of alternative protein-coding regions (∼76% of protein coding alternative nucleotides are located in the grey areas). Thus, we show that numbers of alternative events, generated by AS and AT, alone, do not adequately reflect their contributions to the transcriptome and proteome diversity due to the dramatic differences in the lengths of alternative regions created by these two processes [Table 1B, Supplementary Figure S3, also see (19)].
Figure 3.
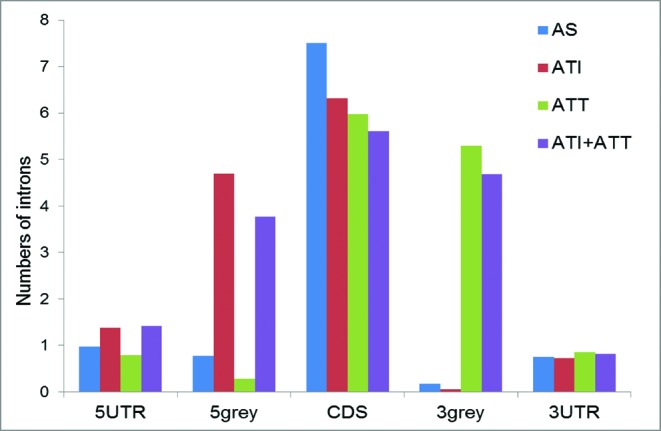
Mean numbers of introns in different functional regions of AS, ATI and ATT genes.
Figure 4.
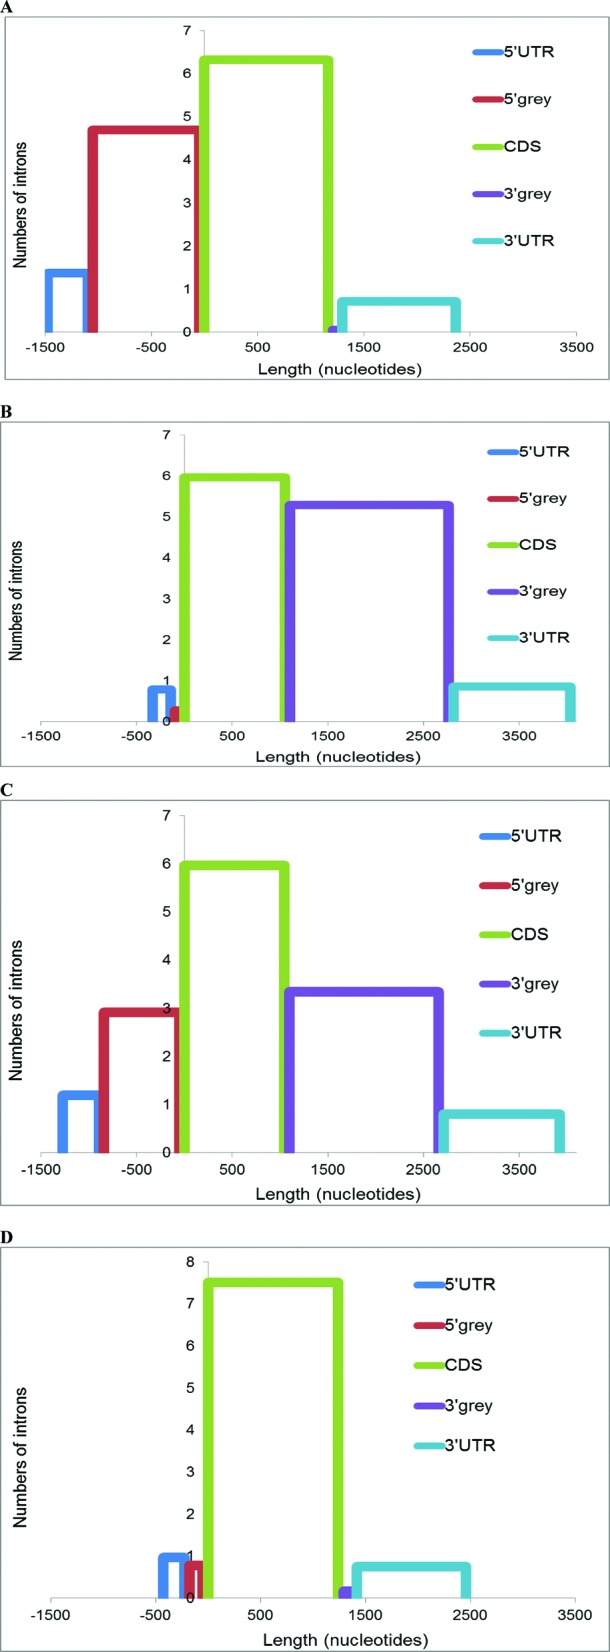
Predominant extension of alternative transcripts in the 5′- and 3′-terminal regions. Mean lengths of functional regions (x-axis) and mean numbers of introns (y-axis) are shown. (A) ATI gene group; (B) ATT gene group; (C) ATI + ATT gene group; (D) AS gene group. Zero on the x-axis is the distal (most downstream) start codon in the respective locus.
Introns in the 5′ grey areas on average are much longer than introns in the 3′ grey areas due to significantly longer genomic distances between upstream and downstream ATI sites, compared to ATT sites (P < 0.0001, the Mann–Whitney U test, Supplementary Figure S3), combined with the requirement for short 5′ UTRs in mature mRNA [∼200 nucleotides on average in primates (19,23)]. Because the length of mature 3′ UTRs is under a much weaker evolutionary constraint (19), compared to the lengths of mature 5′ UTRs or CDS, alternative termination of transcripts can be achieved by simple extension of the 3′ UTR to the next poly(A) site. These data are also in agreement with the rarity of introns in 3′-terminal parts of gene loci, especially in 3′ UTRs (47).
Given that UTRs have the option to evolve by incorporating into upstream and downstream intergenic sequences, the 5′ and 3′ grey areas provide ample opportunity for evolutionary extension of the CDS. Indeed, we found that the 5′ grey areas of the ATI group, the 3′ grey areas of the ATT group, and both grey areas of the ATI+ATT group were dramatically enriched for alternative protein-coding sequences, compared to the cCDS. These alternative coding sequences constitute variable N-terminal and C-terminal protein extensions generated by ATI and ATT. The grey areas are also enriched for alternative non-coding nucleotides from the corresponding UTRs (Supplementary Table S3). Taken together, these findings are compatible with the conclusion that alternative coding sequences are predominantly generated by AT-driven alternative events in the grey areas, and are typically appended to the ends of pre-existing proteins.
Selection on the nucleotide and protein levels in alternative and constitutive protein-coding sequences
In agreement with previous observations (12,47,48), our analysis showed that mean rates of non-synonymous nucleotide substitutions (Kn) are significantly higher (P < 0.001) in alternative regions compared to constitutive regions, indicative of faster evolution of alternative protein sequences (Table 2). In contrast, mean rates of synonymous substitutions (Ks) were significantly higher (P < 0.0001) in constitutive coding regions than in alternative regions. The lower rate of evolution observed at synonymous positions in alternative core and terminal coding regions suggests elevated nucleotide level selection pressure in these areas (41,47–50). We found that comparatively low Ks values are characteristic of all translated alternative regions, i.e. sequences originating from the cCDS as well as the 5′ and 3′ grey areas (Table 2).
Table 2. Rates of synonymous (Ks) and non-synonymous (Kn) nucleotide substitutions in human-macaque orthologous alternative (alt) and constitutive (con) protein coding sequences. (A) Unfiltered dataset. (B) Highly conserved sequences (Ks ≈ 0) excluded.
| Region | Kn/Ks | Kn | Ks | Length | % regions with Ks∼0 | % regions with overlapping frames |
|---|---|---|---|---|---|---|
| A. | ||||||
| 5′ grey alt | 0.427 | 0.0252 ± 0.0010 | 0.0827 ± 0.0014 | 353 ± 16 | 26 | 4.3 |
| cCDS alt | 0.495 | 0.0279 ± 0.0005 | 0.0733 ± 0.0011 | 257 ± 11 | 34 | 6.2 |
| 3′ grey alt | 0.422 | 0.0255 ± 0.0005 | 0.0780 ± 0.0010 | 570 ± 18 | 27 | 13.6 |
| CDS con | 0.228 | 0.0207 ± 0.0004 | 0.0910 ± 0.0005 | 905 ± 21 | 12 | 18.8 |
| B. | ||||||
| 5′ grey alt | 0.255 | 0.0261 ± 0.0012 | 0.1076 ± 0.0016 | 441 ± 16 | ||
| cCDS alt | 0.291 | 0.0292 ± 0.0006 | 0.1029 ± 0.0014 | 309 ± 11 | ||
| 3′ grey alt | 0.250 | 0.0257 ± 0.0006 | 0.1014 ± 0.0012 | 659 ± 18 | ||
| CDS con | 0.229 | 0.0225 ± 0.0004 | 0.0976 ± 0.0008 | 1002 ± 21 | ||
The nature of the elevated selective pressure at synonymous positions in alternative coding regions is not well understood. One possible explanation is the abundance of splicing enhancers and silencers and perhaps other regulatory signals in short, conserved alternative exons (41,47,49–51). This type of selection is plausible for the 5′ and core coding regions in which short exons are common but hardly can explain low Ks values in the 3′ alternative coding regions, where splicing is rare (19,44). To better understand the likely causes of the differences in evolution rates between alternative and constitutive protein-coding regions, we evaluated the RNA/nucleotide selection pressure (RNSP) and PSP for each polymorphic gene locus (see Materials and Methods for details). The distributions of the RNSP values along the length of transcripts show a characteristic second peak of high RNSP values (RNSP > 10) which is most prominent in the 5′ grey areas, also pronounced in the cCDS but far smaller in magnitude in the 3′ grey area (Figure 5). These observations are compatible with the hypothesis that the low Ks values in alternative exons reflect the requirement for conservation of regulatory signals in RNA and/or DNA which are most abundant in the 5′ grey area (45,47,52–54). Our results are in good agreement with reports on elevated selective pressure on mRNA folding immediately downstream of the translation start codons (47,50,55) and with the increased density of transcription factor (TF) footprints within the translated portion of gene first coding exons, where TF-DNA recognition requirements constrain the third codon positions (56).
Figure 5.
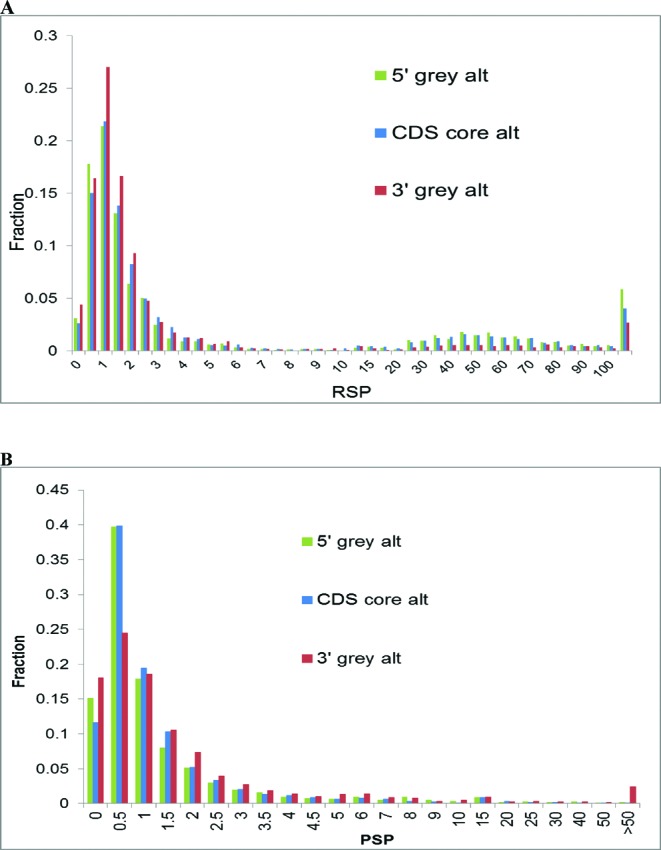
Distributions of RNA/nucleotide selection pressure ratio values, RNSP (A) and Protein Selection Pressure ratio values, PSP (B) in the 5′ grey area, cCDS and the 3′ grey area.
We also found a significant increase of PSP values in the alternative 3′ terminal protein-coding regions located in 3′ grey areas, as compared to the 5′ grey areas and alternative cCDSs (Figure 5). Thus, the RNSP and PSP ratios show opposite trends in the 5′ and 3′ grey areas and thus probably differently affect the upstream and downstream protein-coding regions. We further found that the major difference in the Ks values between alternative regions (terminal as well as cCDS) and constitutive regions is due to the difference in the content of short, highly conserved regions in which both Ks and Kn values approach zero (Table 2B). Such highly conserved sequences are abundant in alternative regions (34–26%) but scarce in constitutive regions (∼12%). When these conserved sequences were excluded from the analysis, the difference in Ks values between alternative and constitutive regions disappeared whereas the difference in Kn values remained significant (Table 2). Thus, the increased frequency of short, highly conserved sequences in alternative coding regions accounts for the reduced Ks values although this effect does not fully explain the differences in the levels of RNSP and PSP at the 5′ and 3′ ends of protein coding regions. These observations could open the perspective for prediction of novel alternative terminal exons using comparative genomic analysis and estimation of RNSP and PSP values in the vicinity of annotated starts and ends of gene loci (12,41).
To examine possible causes of the stronger protein level selection pressure in alternative 3′ grey areas, we estimated the occurrence of overlapping coding frames in alternative and constitutive regions. The frequencies of overlapping coding frames were comparable in alternative regions from 3′ grey areas and in constitutive cCDSs and substantially higher than those in alternative sequences from the cCDS and 5′ grey areas (Table 2). Notably, the frequency of overlapping frames in the 5′ grey area was the lowest (∼4%) among all the functional regions and ∼3-fold lower than those in the 3′ grey area and constitutive cCDSs. Obviously, third codon positions in overlapping coding regions are subject to protein-level selection, and RNSP values cannot be correctly estimated for these regions due to the paucity of authentic synonymous positions.
Thus, although the frequencies of highly conserved sequences (Ks ∼ 0) are similar in different classes of alternative regions (5′ and 3′ grey areas as well as the alternative portions of the cCDS) and significantly (P < 0.001) higher than the frequency of such sequences in constitutive coding regions (Table 2), the underlying evolutionary factors are likely to be different. Indeed, we estimated high levels of RNSP in the 5′ grey areas and alternative cCDSs, in contrast to the high PSP in the 3′ grey areas (Figure 5). This apparent difference in selection patterns might be due to the fact that highly conserved 5′ terminal and core sequences usually encompass short exons that carry conserved regulatory splicing signals (enhancers and/or silencers) (47,57). By contrast, such short exons are virtually missing in 3′ grey areas where, however, the high abundance of extended overlapping coding frames (Table 2) results in conservation at the nucleotide sequence level.
Analysis of functional features of alternative and constitutive protein sequences
Alternative transcription and splicing events frequently result in the loss or gain of protein functional sites, leading to functional divergence of protein isoforms (9,10,58–60). We analysed the distribution and density of phosphorylation sites, IDRs and conserved protein domains in alternative and constitutive protein regions.
Experimentally determined protein phosphorylation sites from the GenBank annotation were mapped to alternative and constitutive exons, and the distribution of these sites in constitutive and alternative sequences was examined. We found that more than one third of the phosphorylation sites were located in alternative protein sequences (Table 3). The fraction of predicted phosphorylation sites in alternative versus constitutive sequences (over 50%) is even higher than that for experimentally supported sites [data based on the Scansite search (61), whereas the random expectation is ∼46%, P < 0.01, Kolmogorov-Smirnov test]. Notably, the number of experimentally determined phosphorylation sites in alternative protein sequences encoded in the 5′ and 3′ grey areas was ∼4-fold greater (7419 sites) than that in the alternative cCDSs (1851 sites) (Table 3), consistent with the 4-fold greater length of the grey areas. Overall, the density of phosphorylation sites is significantly higher in the 3′ grey areas compared to the 5′ grey areas and alternative regions in the cCDS (Table 3; P < 0.005, Mann–Whitney U test). Given the typical large lengths of the 3′ grey areas and the higher density of phosphorylation sites in these regions, the 3′ grey areas encompass the highest fraction of alternative phosphorylation sites among all gene regions. This observation is consistent with the involvement of variable C-termini in the differential regulation of protein function, especially for membrane receptors and signal transducers which contribute to tissue-specific and developmental regulation (Table 3 and S4) (10). The dramatic difference in the number of phosphorylation sites between alternative protein sequences at the ends compared to alternative cCDSs (which is a composite effect of the difference between the lengths of these sequences and in the phosphorylation site density) reflects the enrichment of cellular regulation through the protein alternative ends.
Table 3. Distribution of phosphorylation sites (PhS) in constitutive (CDS con) and alternative sequences located in the core (cCDS alt) or terminal (5grey alt, 5grey dual, 3grey alt, 3grey dual) coding regions of polymorphic gene loci.
| cCDS con | cCDS alt | 5grey alt | 5grey dual | 3grey alt | 3grey dual | |
|---|---|---|---|---|---|---|
| # PhS | 15 353 | 1 851 | 1 908 | 929 | 3 777 | 805 |
| # #Seq with PhS | 3 452 | 562 | 462 | 288 | 892 | 269 |
| #Seq total | 11 354 | 6 040 | 3 698 | 2 437 | 4 369 | 1 826 |
| Densitya | 1.31 | 1.006 | 0.979 | 0.950 | 1.171 | 1.027 |
aThe PhS density was calculated for the total lengths of the sequences found in the Human Protein reference database (www.hprd.org).
We further examined the distribution of IDRs between alternative and constitutive sequences in different parts of gene loci. The IDRs have been recently shown to participate in protein–protein interactions and play major roles in diverse regulatory and signalling functions (62,63). Our analysis showed that alternative sequences encompassed a significantly greater fraction of IDRs than constitutive sequences (P < 0.001, Mann–Whitney U test) and that, among alternative sequences, over 80% of IDRs map to the 5′ and 3′ grey areas (Supplementary Table S5). The over-representation of IDRs is most pronounced in the 5′ and 3′ grey areas that encodes N- and C-terminal alternative sequences (Supplementary Table S5). Given the involvement of the IDRs in regulatory processes, this observation implies that alternative protein termini substantially contribute to rewiring of protein interaction networks (62,63).
In addition, we compared alternative and constitutive coding regions with respect to the prevalence of protein functional domains from the CDD (Supplementary Table S6 and S7) and amino acid motifs from the ProSite database. Constitutive cCDSs were significantly enriched for CDD domains (∼50%; P < 0.001) compared to the alternative sequences. Enrichment of constitutive regions with CDD domains in part could be explained by the greater length of these sequences. However, almost half of the sequences encoded in the 3′ grey areas and one third of the sequences from the 5′ grey areas also encompassed CDD domains or portions thereof which are signatures of protein function (Supplementary Table S7). Taking into account the greater characteristic lengths of 3′-terminal alternative exons compared to the 5′-terminal alternative exons, it is not surprising that conserved protein domains are more common in the 3′ grey areas. Similar observations were made with respect to the prevalence of ProSite motifs.
Two major, distinct modes of gene expression
The relationship between AT and AS appears to be largely determined by two factors: (i) antagonistic relationship between ATI and AS in the CDS, and (ii) tight coupling between AS in CDS and ATT (19). Both AT and AS can affect the level and breadth of gene expression (18,19,45). Furthermore, intron-containing mammalian genes on average are expressed at a much higher level than intronless genes (44). These observations prompted us to investigate the relationships between the architecture of gene loci, AEs, gene expression profiles and evolutionary rates.
The ATT and ATI groups of genes significantly (P < 0.001) differed with respect to the expression pattern (Supplementary Figures S4) as well as in the size of genomic loci and transcribed regions between genes (Supplementary Figure S5). The ATT group was significantly enriched for tissue-specific genes, whereas the ATI genes were on average more widely expressed. Thus, the alternative 3′ UTRs and C-terminal protein variants produced by ATT appear to provide regulatory options for tissue-specific and conditional expression. In contrast, ATI appears to contribute mainly to gene expression regulation, in particular, by using alternative promoters and transcription enhancers, and by allowing alternative translation initiation and regulation through variable 5′ UTRs and 5′-terminal coding sequences (13).
To assess the contribution of alternative promoters to gene expression profiles, we evaluated the expression of mRNA isoforms transcribed from different promoters in the same gene loci, using expression data from an exon-specific microarray platform (http://www.affymetrix. com/support/technical/sample_data/exon_array_data.affx). We analysed the subset of human genes (∼3000 transcripts from ∼1500 gene loci) with distinct alternative first exons transcribed from different promoters for which expression levels of the isoforms could be compared. The mRNA isoforms transcribed from upstream promoters were found to be significantly (P < 0.0001, χ = 21.8) more highly and broadly expressed than isoforms transcribed from downstream promoters (Supplementary Figure S6).
To evaluate contributions of structural and evolutionary factors to the observed differences between the expression patterns of ATI and ATT genes, we performed multiple regression analysis against evolutionary (Kn, Ks, K5 and K3) and structural (total intron length, CDS length, number of transcribed isoforms and number of introns) variables. We examined two models that differed in the way they incorporated the number of introns: (i) for full length transcripts (four structural parameters), and (ii) separately for individual functional regions of transcripts (5′ UTR, 5′ grey area, CDS, 3′ grey area and 3′ UTR; hence eight structural parameters). Model (ii) showed a substantially better ability to predict expression breadth and the number of isoforms for a given gene locus than model (i). In other words, intron distribution in different functional regions of transcripts was more informative than the number of introns in the complete gene locus (Supplementary Table S8). Thus, model (ii) was employed for all subsequent analysis.
As shown in Supplementary Table S9, structural and evolutionary parameters possessed independent prognostic powers for the prediction of gene expression level and breadth. The contribution of the evolutionary parameters to the prediction of the expression patterns in the ATT gene group was considerably (∼1.5-fold) greater than the contribution of the structural parameters, whereas the contribution of the structural parameters was ∼1.5-fold greater than that of the evolutionary parameters in the ATI gene group (Supplementary Table S10). This observation is compatible with the differences in RNSP and PSP between the 5′ and 3′ grey areas, and the higher occurrence of CDD domains and phosphorylation sites in alternative C-terminal protein sequences compared to N-terminal alternative sequences (see above). Jointly, these observations indicate that the ATI and ATT groups of genes are regulated and evolve in different modes.
DISCUSSION
Alternative transcription and alternative splicing are the main mechanisms that generate proteomic diversity in multicellular eukaryotes, particularly in mammals (10,47,59). The architecture of gene loci, location of transcription initiation and termination sites, and the presence of splicing sites and regulatory elements define the structures of pre-mRNA and mature transcripts. Alternative transcription initiation and termination shape the structures of 5′- and 3′-terminal regions of transcripts and play distinct and independent roles in the regulation of expression of polymorphic mammalian genes (12,19,45).
Importantly, the two types of AEs are far from being independent: at the transcription initiation step, the selection of alternative initiation sites by the RNA polymerase defines the choice of splicing sites accordingly the course of subsequent AS events. Transcription from alternative promoters and transcription start sites creates distinct 5′ terminal exons and changes splicing patterns in the 5′ transcript regions. Moreover, differential occupation of promoters and enhancers by certain transcriptional factors and co-regulators can define the choice of exons that are included into the mRNA and trigger exon skipping (29,64,65), especially in 5′ UTRs (19). Alternative exons created by ATI in the 5′ regions of transcripts typically connect to cCDSs, do not affect splicing patterns in the cCDSs and often extend the encoded protein at the N-terminus, with the reading frame preserved (13,19,66). It has been shown that N-terminal sequences of proteins are enriched for IDRs (67), and here we extend these findings by showing that IDRs are particularly common in alternative sequences of both protein ends. Because IDRs are specifically enriched for sites of protein–protein interaction and regulatory signals (63,67), the protein isoforms generated via ATI are likely to provide for differential tissue or condition-specific expression by rewiring interaction networks through the recruitment of distinct interaction partners (62,68). Indeed, the ATI group is enriched for genes that are preferentially involved in development, signal transduction and apoptosis, in contrast to the ATT group that is enriched for more broadly expressed genes preferentially involved in cellular processes and organization, protein modification and regulation of metabolism [Supplementary Table S4; (19)].
In contrast to ATI, ATT strongly depends on upstream splicing events and therefore is tightly coupled with AS in the coding regions (19). In mechanistic terms, this coupling appears to be due in part to the ability of RNA polymerase II (PolII) to bind some of the pre-mRNA processing factors which then travel along with PolII to their targets in a complex known as ‘the mRNA factory’ (30,32,69). There is growing evidence that splicing, polyadenylation and cleavage factors can be recruited to the C-terminal domain of the largest subunit of PolII which participates in the key pre-mRNA processing reactions (26,29,30,70). As transcription proceeds, exons are defined along the pre-mRNA by communication between the 5′ and 3′ splice sites and in cooperation with PolII. At the end of the transcription process, the splicing and cleavage machineries cooperate to define the poly(A) site and the terminal exon (30).
Reporter experiments have indicated that the choice of poly(A) sites depends on the rate of transcription and that RNA polymerase II is more likely to pause at proximal poly(A) sites of highly expressed genes and at distant poly(A) sites of low-expressed genes (71). Furthermore, there are indications that selection of the poly(A) site might occur prior to splicing of the terminal exon (26,72). Details of this process have been recently studied using a mammalian in vitro transcription and splicing system (73). It has been shown that communication between the 3′-splice site of the terminal exon and the poly(A) site is established early in the transcription process, followed with the poly(A) site cleavage, polyadenylation at the 3′ end of the transcript, and concluded with splicing of the last exon. The strong positive correlation between AS events in the cCDSs and ATT observed at the global transcriptome level (19) indicates that the coupling of transcription termination to splicing is a common and wide-spread phenomenon that occurs during transcription of thousands of human genes.
The AS has been traditionally regarded as the main contributor to the transcriptome and proteome diversity (13,45,62,63) given the huge number and variety of the generated isoforms, whereas the role of AT has been comparatively overlooked. However, analysis of the number of alternative events alone is not sufficient for adequate evaluation of the roles of these two mechanisms (19,45). Many of the AS events generated by exon skipping are represented by short in-frame insertions/ deletions that do not substantially change sequence of the resulting proteins. For example, alternative splicing of triplets [such as well-studied and frequently occurring NAGNAG patterns (58)] that creates protein isoforms differing by single amino acid constitutes ∼20% of AS in-frame variability of the cCDSs (58). By contrast, alternative transcription events typically create extended variable regions at protein termini, such as N-terminal transmembrane and extracellular domains that dramatically enrich protein functional repertoire. The present findings provide evidence that alternative transcription makes much greater contributions to the diversity of the mammalian transcriptome and proteome than previously thought. The two processes, AT and AS, are tightly interconnected and often operate together to enhance transcriptome and proteome diversity.
It has to be emphasized that the current estimates of the extent of ATI and ATT are highly conservative because sequencing of additional transcripts with alternative termini can only expand the grey areas. The ability of ATI and ATT to shape upstream and downstream gene regions, respectively, creates variable protein extensions and provides mechanisms for two distinct regulatory strategies for the regulation of gene expression. Significant differences in gene architecture and evolutionary patterns exist between these two groups of genes that predominantly produce proteins of different functional groups with different expression profiles. The C-terminal protein variants produced by ATT enrich the potential for cellular signaling and appear to provide regulatory options for tissue-specific and conditional expression. These observations are in good agreement with previously published data (10,45) and appear to reflect preferential regulation of two distinct, large groups of genes via different mechanisms. Diversification of transcript functions and expression patterns appears to be mediated by ATI that also creates opportunities for additional regulatory effects through variable 5′ UTRs. This conclusion is compatible with the strong nucleotide-level selection pressure detected in these regions. Conversely, ATT enhances post-transcriptional regulation through the formation of mRNA variants with alternative 3′ UTRs that have different fates and lifetimes in the cell.
An important question is whether the variable N- and C-termini in protein isoforms created by alternative transcription perform biological function, or simply reflect inherent ‘leakiness’ in transcriptional control (it should be noted, however, that the boundary between functional and leaky transcripts is fuzzy because leaky transcripts can evolve functions and get fixed in the course of evolution). Functional importance of alternative protein terminal regions is supported by our transcriptome-scale analysis demonstrating that these regions are subject to purifying selection. Our finding of the elevated RNSP in the 5′ grey areas is in good agreement with the reported selection in favour of mRNA folding pattern in the vicinity of translation start codons (47,50,55,74,75) and elevated occupancy of the first protein-coding exons with TF recognition sites across the human exome (56). Thus, nucleotide-level constraints appear to be a major driver of evolution in the upstream translated gene sequences (55,76). The biological role of alternative protein C-termini is supported by the presence of many conserved protein domains and experimentally verified phosphorylation sites in 3′ grey areas. The functionality of phosphorylation sites generated by exon skipping (10) and alternative NAGNAG acceptor splice sites (58), has been demonstrated recently. Considering the observed higher density of experimentally verified phosphorylation sites in the 3′ grey areas compared to alternatively spliced cCDSs, these sites are likely to be functionally important, especially for tissue–specific regulation. Our findings are in agreement with the recently published data on phosphorylation of alternatively spliced protein isoforms and connections between the potential for protein phosphorylation and tissue-specific alternative splicing (10).
Notably, the IDRs, a recently recognized important class of regulatory sequences, show a marked enrichment in alternative protein ends, suggesting that these sequences also perform various regulatory functions, in particular in protein interaction network rewiring.
The ATI and ATT provide mechanisms for evolution of spliced genes and their protein products. Several lines of evidence suggest that acquisition of alternative exons at the boundaries between cCDS and UTRs is mediated primarily by AT, and not by AS (24,30). Extended grey areas at the 5′ and 3′ ends, generated by AT, harbour many short exons that lack detectable similarity to other protein sequences and at least in some case might have evolved de novo from non-coding sequences, resulting in extension and diversification of mammalian proteins. Upstream transcript regions can grow by mosaic extension into 5′ untranscribed areas that are enriched for potential splicing signals and by providing new N-terminal coding exons, whereas C-terminal coding regions can grow by direct extension of existing terminal exons (tandem 3′ UTRs). Alternative coding exons are characterized by a higher level of nucleotide level selection pressure than most constitutive coding exons. The 5′ regions of transcripts are notably enriched for short exons that are subject to a significantly stronger nucleotide level selection compared to 3′ ends.
The results of the present work are in good agreement with the recent genome-wide study of genetic effects on transcript structure which shows that differences between isoforms at transcript ends are much more common than exon skipping (77). Furthermore, impairment of alternative transcription and splicing has been shown to substantially contribute to diverse disease conditions (78). The results of the present study provide for a better understanding of the mechanisms of transcriptome variation and the landscape of functional differentiation in the human genome, and in particular, emphasize the major contribution of alternative transcription.
SUPPLEMENTARY DATA
Supplementary Data are available at NAR Online.
Acknowledgments
We thank Alexey Spiridonov for his contribution to the analysis and classification of alternative events and the Koonin group members for useful comments.
FUNDING
Department of Health and Human Services (DHHS) (National Institutes of Health, National Library of Medicine) intramural funds. Funding for open access charge: DHHS (National Institutes of Health, National Library of Medicine) intramural funds.
Conflict of interest statement. None declared.
REFERENCES
- 1.Ewing B., Green P. Analysis of expressed sequence tags indicates 35,000 human genes. Nat. Genet. 2000;25:232–234. doi: 10.1038/76115. [DOI] [PubMed] [Google Scholar]
- 2.Shabalina S.A., Spiridonov N.A. The mammalian transcriptome and the function of non-coding DNA sequences. Genome Biol. 2004;5:105. doi: 10.1186/gb-2004-5-4-105. [DOI] [PMC free article] [PubMed] [Google Scholar]
- 3.Sultan M., Schulz M.H., Richard H., Magen A., Klingenhoff A., Scherf M., Seifert M., Borodina T., Soldatov A., Parkhomchuk D., et al. A global view of gene activity and alternative splicing by deep sequencing of the human transcriptome. Science. 2008;321:956–960. doi: 10.1126/science.1160342. [DOI] [PubMed] [Google Scholar]
- 4.Wilhelm B.T., Marguerat S., Watt S., Schubert F., Wood V., Goodhead I., Penkett C.J., Rogers J., Bahler J. Dynamic repertoire of a eukaryotic transcriptome surveyed at single-nucleotide resolution. Nature. 2008;453:1239–1243. doi: 10.1038/nature07002. [DOI] [PubMed] [Google Scholar]
- 5.Djebali S., Davis C.A., Merkel A., Dobin A., Lassmann T., Mortazavi A., Tanzer A., Lagarde J., Lin W., Schlesinger F., et al. Landscape of transcription in human cells. Nature. 2012;489:101–108. doi: 10.1038/nature11233. [DOI] [PMC free article] [PubMed] [Google Scholar]
- 6.Kim E., Goren A., Ast G. Alternative splicing: current perspectives. Bioessays. 2008;30:38–47. doi: 10.1002/bies.20692. [DOI] [PubMed] [Google Scholar]
- 7.Blencowe B.J. Alternative splicing: new insights from global analyses. Cell. 2006;126:37–47. doi: 10.1016/j.cell.2006.06.023. [DOI] [PubMed] [Google Scholar]
- 8.Pan Q., Shai O., Lee L.J., Frey B.J., Blencowe B.J. Deep surveying of alternative splicing complexity in the human transcriptome by high-throughput sequencing. Nat. Genet. 2008;40:1413–1415. doi: 10.1038/ng.259. [DOI] [PubMed] [Google Scholar]
- 9.Barbosa-Morais N.L., Irimia M., Pan Q., Xiong H.Y., Gueroussov S., Lee L.J., Slobodeniuc V., Kutter C., Watt S., Colak R., et al. The evolutionary landscape of alternative splicing in vertebrate species. Science. 2012;338:1587–1593. doi: 10.1126/science.1230612. [DOI] [PubMed] [Google Scholar]
- 10.Merkin J., Russell C., Chen P., Burge C.B. Evolutionary dynamics of gene and isoform regulation in mammalian tissues. Science. 2012;338:1593–1599. doi: 10.1126/science.1228186. [DOI] [PMC free article] [PubMed] [Google Scholar]
- 11.Ellis J.D., Barrios-Rodiles M., Colak R., Irimia M., Kim T., Calarco J.A., Wang X., Pan Q., O’Hanlon D., Kim P.M., et al. Tissue-specific alternative splicing remodels protein-protein interaction networks. Mol. Cell. 2012;46:884–892. doi: 10.1016/j.molcel.2012.05.037. [DOI] [PubMed] [Google Scholar]
- 12.Xing Y., Lee C. Alternative splicing and RNA selection pressure–evolutionary consequences for eukaryotic genomes. Nat. Rev. Genet. 2006;7:499–509. doi: 10.1038/nrg1896. [DOI] [PubMed] [Google Scholar]
- 13.Landry J.R., Mager D.L., Wilhelm B.T. Complex controls: the role of alternative promoters in mammalian genomes. Trends Genet. 2003;19:640–648. doi: 10.1016/j.tig.2003.09.014. [DOI] [PubMed] [Google Scholar]
- 14.Ma X., Li-Ling J., Huang Q., Chen X., Hou L., Ma F. Systematic analysis of alternative promoters correlated with alternative splicing in human genes. Genomics. 2009;93:420–425. doi: 10.1016/j.ygeno.2009.01.008. [DOI] [PubMed] [Google Scholar]
- 15.Baek D., Davis C., Ewing B., Gordon D., Green P. Characterization and predictive discovery of evolutionarily conserved mammalian alternative promoters. Genome Res. 2007;17:145–155. doi: 10.1101/gr.5872707. [DOI] [PMC free article] [PubMed] [Google Scholar]
- 16.Yamashita R., Wakaguri H., Sugano S., Suzuki Y., Nakai K. DBTSS provides a tissue specific dynamic view of Transcription Start Sites. Nucleic Acids Res. 2010;38:D98–D104. doi: 10.1093/nar/gkp1017. [DOI] [PMC free article] [PubMed] [Google Scholar]
- 17.Xin D., Hu L., Kong X. Alternative promoters influence alternative splicing at the genomic level. PLoS One. 2008;3:e2377. doi: 10.1371/journal.pone.0002377. [DOI] [PMC free article] [PubMed] [Google Scholar]
- 18.Jacox E., Gotea V., Ovcharenko I., Elnitski L. Tissue-specific and ubiquitous expression patterns from alternative promoters of human genes. PLoS One. 2010;5:e12274. doi: 10.1371/journal.pone.0012274. [DOI] [PMC free article] [PubMed] [Google Scholar]
- 19.Shabalina S.A., Spiridonov A.N., Spiridonov N.A., Koonin E.V. Connections between alternative transcription and alternative splicing in mammals. Genome Biol. Evol. 2010;2:791–799. doi: 10.1093/gbe/evq058. [DOI] [PMC free article] [PubMed] [Google Scholar]
- 20.Brugiolo M., Herzel L., Neugebauer K.M. Counting on co-transcriptional splicing. F1000Prime Rep. 2013;5:9. doi: 10.12703/P5-9. [DOI] [PMC free article] [PubMed] [Google Scholar]
- 21.Resch A., Xing Y., Modrek B., Gorlick M., Riley R., Lee C. Assessing the impact of alternative splicing on domain interactions in the human proteome. J. Proteome Res. 2004;3:76–83. doi: 10.1021/pr034064v. [DOI] [PubMed] [Google Scholar]
- 22.Cenik C., Derti A., Mellor J.C., Berriz G.F., Roth F.P. Genome-wide functional analysis of human 5’untranslated region introns. Genome Biol. 2010;11:R29. doi: 10.1186/gb-2010-11-3-r29. [DOI] [PMC free article] [PubMed] [Google Scholar]
- 23.Resch A.M., Ogurtsov A.Y., Rogozin I.B., Shabalina S.A., Koonin E.V. Evolution of alternative and constitutive regions of mammalian 5’UTRs. BMC Genomics. 2009;10:162. doi: 10.1186/1471-2164-10-162. [DOI] [PMC free article] [PubMed] [Google Scholar]
- 24.Hong X., Scofield D.G., Lynch M. Intron size, abundance, and distribution within untranslated regions of genes. Mol. Biol. Evol. 2006;23:2392–2404. doi: 10.1093/molbev/msl111. [DOI] [PubMed] [Google Scholar]
- 25.Grillo G., Turi A., Licciulli F., Mignone F., Liuni S., Banfi S., Gennarino V.A., Horner D.S., Pavesi G., Picardi E., et al. UTRdb and UTRsite (RELEASE 2010): a collection of sequences and regulatory motifs of the untranslated regions of eukaryotic mRNAs. Nucleic Acids Res. 2010;38:D75–D80. doi: 10.1093/nar/gkp902. [DOI] [PMC free article] [PubMed] [Google Scholar]
- 26.Maniatis T., Reed R. An extensive network of coupling among gene expression machines. Nature. 2002;416:499–506. doi: 10.1038/416499a. [DOI] [PubMed] [Google Scholar]
- 27.Bentley D. The mRNA assembly line: transcription and processing machines in the same factory. Curr. Opin. Cell Biol. 2002;14:336–342. doi: 10.1016/s0955-0674(02)00333-2. [DOI] [PubMed] [Google Scholar]
- 28.Bentley D.L. Rules of engagement: co-transcriptional recruitment of pre-mRNA processing factors. Curr. Opin. Cell Biol. 2005;17:251–256. doi: 10.1016/j.ceb.2005.04.006. [DOI] [PubMed] [Google Scholar]
- 29.Kornblihtt A.R., de la Mata M., Fededa J.P., Munoz M.J., Nogues G. Multiple links between transcription and splicing. RNA. 2004;10:1489–1498. doi: 10.1261/rna.7100104. [DOI] [PMC free article] [PubMed] [Google Scholar]
- 30.Kornblihtt A.R., Schor I.E., Allo M., Dujardin G., Petrillo E., Munoz M.J. Alternative splicing: a pivotal step between eukaryotic transcription and translation. Nat. Rev. Mol. Cell Biol. 2013;14:153–165. doi: 10.1038/nrm3525. [DOI] [PubMed] [Google Scholar]
- 31.Dujardin G., Lafaille C., Petrillo E., Buggiano V., Gomez Acuna L.I., Fiszbein A., Godoy Herz M.A., Nieto Moreno N., Munoz M.J., Allo M., et al. Transcriptional elongation and alternative splicing. Biochim. Biophys. Acta. 2013;1829:134–140. doi: 10.1016/j.bbagrm.2012.08.005. [DOI] [PubMed] [Google Scholar]
- 32.Braunschweig U., Gueroussov S., Plocik A.M., Graveley B.R., Blencowe B.J. Dynamic integration of splicing within gene regulatory pathways. Cell. 2013;152:1252–1269. doi: 10.1016/j.cell.2013.02.034. [DOI] [PMC free article] [PubMed] [Google Scholar]
- 33.Light S., Elofsson A. The impact of splicing on protein domain architecture. Curr. Opin. Struct. Biol. 2013;23:451–458. doi: 10.1016/j.sbi.2013.02.013. [DOI] [PubMed] [Google Scholar]
- 34.Kondrashov A.S., Shabalina S.A. Classification of common conserved sequences in mammalian intergenic regions. Hum. Mol. Genet. 2002;11:669–674. doi: 10.1093/hmg/11.6.669. [DOI] [PubMed] [Google Scholar]
- 35.Ogurtsov A.Y., Marino-Ramirez L., Johnson G.R., Landsman D., Shabalina S.A., Spiridonov N.A. Expression patterns of protein kinases correlate with gene architecture and evolutionary rates. PLoS One. 2008;3:e3599. doi: 10.1371/journal.pone.0003599. [DOI] [PMC free article] [PubMed] [Google Scholar]
- 36.Wakaguri H., Yamashita R., Suzuki Y., Sugano S., Nakai K. DBTSS: database of transcription start sites, progress report 2008. Nucleic Acids Res. 2008;36:D97–D101. doi: 10.1093/nar/gkm901. [DOI] [PMC free article] [PubMed] [Google Scholar]
- 37.Derti A., Garrett-Engele P., Macisaac K.D., Stevens R.C., Sriram S., Chen R., Rohl C.A., Johnson J.M., Babak T. A quantitative atlas of polyadenylation in five mammals. Genome Res. 2012;22:1173–1183. doi: 10.1101/gr.132563.111. [DOI] [PMC free article] [PubMed] [Google Scholar]
- 38.Ogurtsov A.Y., Roytberg M.A., Shabalina S.A., Kondrashov A.S. OWEN: aligning long collinear regions of genomes. Bioinformatics. 2002;18:1703–1704. doi: 10.1093/bioinformatics/18.12.1703. [DOI] [PubMed] [Google Scholar]
- 39.Pamilo P., Bianchi N.O. Evolution of the Zfx and Zfy genes: rates and interdependence between the genes. Mol. Biol. Evol. 1993;10:271–281. doi: 10.1093/oxfordjournals.molbev.a040003. [DOI] [PubMed] [Google Scholar]
- 40.Kimura M. A simple method for estimating evolutionary rates of base substitutions through comparative studies of nucleotide sequences. J. Mol. Evol. 1980;16:111–120. doi: 10.1007/BF01731581. [DOI] [PubMed] [Google Scholar]
- 41.Lu H., Lin L., Sato S., Xing Y., Lee C.J. Predicting functional alternative splicing by measuring RNA selection pressure from multigenome alignments. PLoS Comput. Biol. 2009;5:e1000608. doi: 10.1371/journal.pcbi.1000608. [DOI] [PMC free article] [PubMed] [Google Scholar]
- 42.Marchler-Bauer A., Lu S., Anderson J.B., Chitsaz F., Derbyshire M.K., DeWeese-Scott C., Fong J.H., Geer L.Y., Geer R.C., Gonzales N.R., et al. CDD: a Conserved Domain Database for the functional annotation of proteins. Nucleic Acids Res. 2011;39:D225–D229. doi: 10.1093/nar/gkq1189. [DOI] [PMC free article] [PubMed] [Google Scholar]
- 43.Kuhn R.M., Karolchik D., Zweig A.S., Trumbower H., Thomas D.J., Thakkapallayil A., Sugnet C.W., Stanke M., Smith K.E., Siepel A., et al. The UCSC genome browser database: update 2007. Nucleic Acids Res. 2007;35:D668–D673. doi: 10.1093/nar/gkl928. [DOI] [PMC free article] [PubMed] [Google Scholar]
- 44.Shabalina S.A., Ogurtsov A.Y., Spiridonov A.N., Novichkov P., Spiridonov N.A., Koonin E.V. Distinct patterns of expression and evolution of intronless and intron-containing mammalian genes. Mol. Biol. Evol. 2010 doi: 10.1093/molbev/msq086. [DOI] [PMC free article] [PubMed] [Google Scholar]
- 45.Wang E.T., Sandberg R., Luo S., Khrebtukova I., Zhang L., Mayr C., Kingsmore S.F., Schroth G.P., Burge C.B. Alternative isoform regulation in human tissue transcriptomes. Nature. 2008;456:470–476. doi: 10.1038/nature07509. [DOI] [PMC free article] [PubMed] [Google Scholar]
- 46.Karolchik D., Barber G.P., Casper J., Clawson H., Cline M.S., Diekhans M., Dreszer T.R., Fujita P.A., Guruvadoo L., Haeussler M., et al. The UCSC Genome Browser database: 2014 update. Nucleic Acids Res. 2014 doi: 10.1093/nar/gkt1168. [DOI] [PMC free article] [PubMed] [Google Scholar]
- 47.Shabalina S.A., Spiridonov N.A., Kashina A. Sounds of silence: synonymous nucleotides as a key to biological regulation and complexity. Nucleic Acids Res. 2013;41:2073–2094. doi: 10.1093/nar/gks1205. [DOI] [PMC free article] [PubMed] [Google Scholar]
- 48.Xing Y., Lee C. Evidence of functional selection pressure for alternative splicing events that accelerate evolution of protein subsequences. Proc. Natl. Acad. Sci. U.S.A. 2005;102:13526–13531. doi: 10.1073/pnas.0501213102. [DOI] [PMC free article] [PubMed] [Google Scholar]
- 49.Shabalina S.A., Zaykin D.V., Gris P., Ogurtsov A.Y., Gauthier J., Shibata K., Tchivileva I.E., Belfer I., Mishra B., Kiselycznyk C., et al. Expansion of the human mu-opioid receptor gene architecture: novel functional variants. Hum. Mol. Genet. 2009;18:1037–1051. doi: 10.1093/hmg/ddn439. [DOI] [PMC free article] [PubMed] [Google Scholar]
- 50.Tsao D., Shabalina S.A., Gauthier J., Dokholyan N.V., Diatchenko L. Disruptive mRNA folding increases translational efficiency of catechol-O-methyltransferase variant. Nucleic Acids Res. 2011;39:6201–6212. doi: 10.1093/nar/gkr165. [DOI] [PMC free article] [PubMed] [Google Scholar]
- 51.Parmley J.L., Chamary J.V., Hurst L.D. Evidence for purifying selection against synonymous mutations in mammalian exonic splicing enhancers. Mol. Biol. Evol. 2006;23:301–309. doi: 10.1093/molbev/msj035. [DOI] [PubMed] [Google Scholar]
- 52.Wang Y., Xiao X., Zhang J., Choudhury R., Robertson A., Li K., Ma M., Burge C.B., Wang Z. A complex network of factors with overlapping affinities represses splicing through intronic elements. Nat. Struct. Mol. Biol. 2013;20:36–45. doi: 10.1038/nsmb.2459. [DOI] [PMC free article] [PubMed] [Google Scholar]
- 53.Wang E.T., Cody N.A., Jog S., Biancolella M., Wang T.T., Treacy D.J., Luo S., Schroth G.P., Housman D.E., Reddy S., et al. Transcriptome-wide regulation of pre-mRNA splicing and mRNA localization by muscleblind proteins. Cell. 2012;150:710–724. doi: 10.1016/j.cell.2012.06.041. [DOI] [PMC free article] [PubMed] [Google Scholar]
- 54.Shabalina S.A., Ogurtsov A.Y., Kondrashov V.A., Kondrashov A.S. Selective constraint in intergenic regions of human and mouse genomes. Trends Genet. 2001;17:373–376. doi: 10.1016/s0168-9525(01)02344-7. [DOI] [PubMed] [Google Scholar]
- 55.Shabalina S.A., Ogurtsov A.Y., Spiridonov N.A. A periodic pattern of mRNA secondary structure created by the genetic code. Nucleic Acids Res. 2006;34:2428–2437. doi: 10.1093/nar/gkl287. [DOI] [PMC free article] [PubMed] [Google Scholar]
- 56.Stergachis A.B., Haugen E., Shafer A., Fu W., Vernot B., Reynolds A., Raubitschek A., Ziegler S., LeProust E.M., Akey J.M., et al. Exonic transcription factor binding directs codon choice and affects protein evolution. Science. 2013;342:1367–1372. doi: 10.1126/science.1243490. [DOI] [PMC free article] [PubMed] [Google Scholar]
- 57.Chamary J.V., Parmley J.L., Hurst L.D. Hearing silence: non-neutral evolution at synonymous sites in mammals. Nat. Rev. Genet. 2006;7:98–108. doi: 10.1038/nrg1770. [DOI] [PubMed] [Google Scholar]
- 58.Bradley R.K., Merkin J., Lambert N.J., Burge C.B. Alternative splicing of RNA triplets is often regulated and accelerates proteome evolution. PLoS Biol. 2012;10:e1001229. doi: 10.1371/journal.pbio.1001229. [DOI] [PMC free article] [PubMed] [Google Scholar]
- 59.Kriventseva E.V., Koch I., Apweiler R., Vingron M., Bork P., Gelfand M.S., Sunyaev S. Increase of functional diversity by alternative splicing. Trends Genet. 2003;19:124–128. doi: 10.1016/S0168-9525(03)00023-4. [DOI] [PubMed] [Google Scholar]
- 60.Yura K., Shionyu M., Hagino K., Hijikata A., Hirashima Y., Nakahara T., Eguchi T., Shinoda K., Yamaguchi A., Takahashi K., et al. Alternative splicing in human transcriptome: functional and structural influence on proteins. Gene. 2006;380:63–71. doi: 10.1016/j.gene.2006.05.015. [DOI] [PubMed] [Google Scholar]
- 61.Obenauer J.C., Cantley L.C., Yaffe M.B. Scansite 2.0: Proteome-wide prediction of cell signaling interactions using short sequence motifs. Nucleic Acids Res. 2003;31:3635–3641. doi: 10.1093/nar/gkg584. [DOI] [PMC free article] [PubMed] [Google Scholar]
- 62.Buljan M., Chalancon G., Eustermann S., Wagner G.P., Fuxreiter M., Bateman A., Babu M.M. Tissue-specific splicing of disordered segments that embed binding motifs rewires protein interaction networks. Mol. Cell. 2012;46:871–883. doi: 10.1016/j.molcel.2012.05.039. [DOI] [PMC free article] [PubMed] [Google Scholar]
- 63.Buljan M., Chalancon G., Dunker A.K., Bateman A., Balaji S., Fuxreiter M., Babu M.M. Alternative splicing of intrinsically disordered regions and rewiring of protein interactions. Curr. Opin. Struct. Biol. 2013;23:443–450. doi: 10.1016/j.sbi.2013.03.006. [DOI] [PubMed] [Google Scholar]
- 64.Nogues G., Kadener S., Cramer P., Bentley D., Kornblihtt A.R. Transcriptional activators differ in their abilities to control alternative splicing. J. Biol. Chem. 2002;277:43110–43114. doi: 10.1074/jbc.M208418200. [DOI] [PubMed] [Google Scholar]
- 65.Auboeuf D., Dowhan D.H., Kang Y.K., Larkin K., Lee J.W., Berget S.M., O’Malley B.W. Differential recruitment of nuclear receptor coactivators may determine alternative RNA splice site choice in target genes. Proc. Natl. Acad. Sci. U.S.A. 2004;101:2270–2274. doi: 10.1073/pnas.0308133100. [DOI] [PMC free article] [PubMed] [Google Scholar]
- 66.Resch A., Xing Y., Alekseyenko A., Modrek B., Lee C. Evidence for a subpopulation of conserved alternative splicing events under selection pressure for protein reading frame preservation. Nucleic Acids Res. 2004;32:1261–1269. doi: 10.1093/nar/gkh284. [DOI] [PMC free article] [PubMed] [Google Scholar]
- 67.Weatheritt R.J., Davey N.E., Gibson T.J. Linear motifs confer functional diversity onto splice variants. Nucleic Acids Res. 2012;40:7123–7131. doi: 10.1093/nar/gks442. [DOI] [PMC free article] [PubMed] [Google Scholar]
- 68.Cumberworth A., Lamour G., Babu M.M., Gsponer J. Promiscuity as a functional trait: intrinsically disordered regions as central players of interactomes. Biochem. J. 2013;454:361–369. doi: 10.1042/BJ20130545. [DOI] [PubMed] [Google Scholar]
- 69.Tilgner H., Knowles D.G., Johnson R., Davis C.A., Chakrabortty S., Djebali S., Curado J., Snyder M., Gingeras T.R., Guigo R. Deep sequencing of subcellular RNA fractions shows splicing to be predominantly co-transcriptional in the human genome but inefficient for lncRNAs. Genome Res. 2012;22:1616–1625. doi: 10.1101/gr.134445.111. [DOI] [PMC free article] [PubMed] [Google Scholar]
- 70.Neugebauer K.M. On the importance of being co-transcriptional. J. Cell Sci. 2002;115:3865–3871. doi: 10.1242/jcs.00073. [DOI] [PubMed] [Google Scholar]
- 71.Almada A.E., Wu X., Kriz A.J., Burge C.B., Sharp P.A. Promoter directionality is controlled by U1 snRNP and polyadenylation signals. Nature. 2013;499 doi: 10.1038/nature12349. [DOI] [PMC free article] [PubMed] [Google Scholar]
- 72.Galli G., Guise J., Tucker P.W., Nevins J.R. Poly(A) site choice rather than splice site choice governs the regulated production of IgM heavy-chain RNAs. Proc. Natl. Acad. Sci. U.S.A. 1988;85:2439–2443. doi: 10.1073/pnas.85.8.2439. [DOI] [PMC free article] [PubMed] [Google Scholar]
- 73.Rigo F., Martinson H.G. Functional coupling of last-intron splicing and 3’-end processing to transcription in vitro: the poly(A) signal couples to splicing before committing to cleavage. Mol. Cell. Biol. 2008;28:849–862. doi: 10.1128/MCB.01410-07. [DOI] [PMC free article] [PubMed] [Google Scholar]
- 74.Zhang F., Saha S., Shabalina S.A., Kashina A. Differential arginylation of actin isoforms is regulated by coding sequence-dependent degradation. Science. 2010;329:1534–1537. doi: 10.1126/science.1191701. [DOI] [PMC free article] [PubMed] [Google Scholar]
- 75.Wan Y., Qu K., Zhang Q.C., Flynn R.A., Manor O., Ouyang Z., Zhang J., Spitale R.C., Snyder M.P., Segal E., et al. Landscape and variation of RNA secondary structure across the human transcriptome. Nature. 2014;505:706–709. doi: 10.1038/nature12946. [DOI] [PMC free article] [PubMed] [Google Scholar]
- 76.Shabalina S.A., Ogurtsov A.Y., Rogozin I.B., Koonin E.V., Lipman D.J. Comparative analysis of orthologous eukaryotic mRNAs: potential hidden functional signals. Nucleic Acids Res. 2004;32:1774–1782. doi: 10.1093/nar/gkh313. [DOI] [PMC free article] [PubMed] [Google Scholar]
- 77.Lappalainen T., Sammeth M., Friedlander M.R.T., Hoen P.A., Monlong J., Rivas M.A., Gonzalez-Porta M., Kurbatova N., Griebel T., Ferreira P.G., et al. Transcriptome and genome sequencing uncovers functional variation in humans. Nature. 2013;501:506–511. doi: 10.1038/nature12531. [DOI] [PMC free article] [PubMed] [Google Scholar]
- 78.Shapiro I.M., Cheng A.W., Flytzanis N.C., Balsamo M., Condeelis J.S., Oktay M.H., Burge C.B., Gertler F.B. An EMT-driven alternative splicing program occurs in human breast cancer and modulates cellular phenotype. PLoS Genet. 2011;7:e1002218. doi: 10.1371/journal.pgen.1002218. [DOI] [PMC free article] [PubMed] [Google Scholar]
Associated Data
This section collects any data citations, data availability statements, or supplementary materials included in this article.