

Abstract

Ultrasensitive and quantitative detection of cancer biomarkers is an unmet challenge because of their ultralow concentrations in clinical samples. Although gold nanoparticle (AuNP)-based immunoassays offer high sensitivity, they were unable to quantitatively detect targets of interest most likely due to their very narrow linear ranges. This article describes a quantitative colorimetric immunoassay based on glucose oxidase (GOx)-catalyzed growth of 5 nm AuNPs that can detect cancer biomarkers from attomolar to picomolar levels. In addition, the limit of detection (LOD) of prostate-specific antigen (PSA) of this approach (93 aM) exceeds that of commercial enzyme-linked immunosorbent assay (ELISA) (6.3 pM) by more than 4 orders of magnitude. The emergence of red or purple color based on enzyme-catalyzed growth of 5 nm AuNPs in the presence of target antigen is particularly suitable for point-of-care (POC) diagnostics in both resource-rich and resource-limited settings.
Ultrasensitive quantification of cancer biomarkers in complex samples is of great significance to clinical decision-making, and thus facilitates enabling early-stage diagnosis, monitoring cancer progression, and evaluating therapeutic interventions. Currently available quantitative immunoassays, such as enzyme-linked immunosorbent assay (ELISA), the most popular format in clinical biomarker detection, typically measure protein biomarkers at concentrations above 0.1 ng/mL.1 This detection sensitivity is unable to reach the clinical threshold of many protein biomarkers especially in the early stages of the diseases when their concentrations in clinical samples are generally in the range of fg/mL to pg/mL.2−5 It is therefore extremely important to develop quantitative immunoassays with ultrahigh sensitivity.
The past decades have witnessed a variety of enhanced immunoassays with ultrahigh sensitivity (Table S1, Supporting Information). Among these strategies, gold nanoparticle (AuNP)-based colorimetric assays have been incorporated with immunoreactions for biomarker detection, which have drawn considerable attention owing to their unprecedented sensitivity and convenient readout.6−11 Presently, AuNP-based colorimetric assays mainly depend on the monodisperse or aggregated process of AuNPs, where detection target-induced molecular events are transformed into the respective red-to-blue (or purple) color change.12−16 These clear red-to-blue (or purple) results can be easily distinguished by the naked eye, making it suitable for point-of-care (POC) diagnostics. Although the reported AuNP-based immunoassays provide sufficiently high sensitivity, most of them are unable to quantify the detection targets of interest due to their narrow linear detection ranges.6−16 It still remains a great challenge to create ultrasensitive and quantitative immunoassays.
Herein, we report a quantitative immunoassay that allows detection of attomolar cancer protein biomarkers in clinical samples. This approach is dependent on the growth of small sized AuNPs (5 nm in diameter) in the presence of H2O2 and AuCl4–. We noted that the extinction coefficient of 5 nm AuNPs is much lower than those of larger sized AuNPs (Table S2, Supporting Information), indicating that the diluted 5 nm AuNP solution at relatively low concentration (normally <10 nM) is colorless, while solutions containing larger sized AuNPs at the same concentration are typically red (Figure S1, Supporting Information). Therefore, we anticipated that upon the growth of 5 nm AuNPs, the colorless AuNP solution can turn red. In this study, we employed glucose oxidase (GOx) to generate H2O2.17,18 To apply this phenomenon into immunoassay, GOx is conjugated with detection antibody (Ab2) on the surfaces of magnetic beads (MBs). The amount of GOx is proportional to the concentration of detection targets sandwiched through immunoreaction. When the immunoassay is performed on the polystyrene (PS) substrate in a 96-well plate, the captured target pulls down the Ab2–GOx–MBs conjugates on the substrate, where the GOx catalyzes the oxidation of glucose to produce H2O2. The obtained H2O2 induces the growth of 5 nm sized AuNPs in the presence of AuCl4– (Scheme 1). As a consequence, the colorless AuNP solutions turns red along with an appearance of an absorption band at around 530 nm in the visible region of the electromagnetic spectrum, which in turn is used to quantify the detection targets. Unlike previous AuNP-based assays that depend on the red-to-blue (or purple) color change,6−11 the assay we report here is based on a colorless-to-red process. The way that the signal is generated is similar to that of horseradish peroxidase (HRP)-based ELISA (from colorless to yellow), endowing our assay great promise for quantitative detection.
Scheme 1. Schematic Diagram of the Quantitative Immunoassay Based on Glucose Oxidase (GOx)-Catalyzed Growth of Gold Nanoparticles (AuNPs, 5 nm in Diameter).
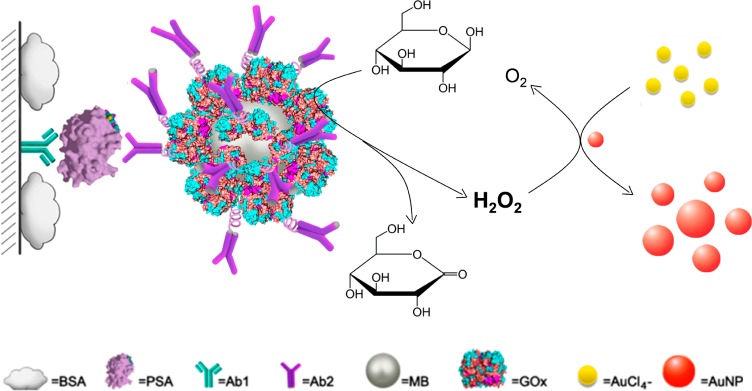
Prostate-specific antigen (PSA) is first immobilized by the capture antibody (Ab1) and then recognized by the detection antibody (Ab2) conjugated with GOx on the surfaces of magnetic beads (MBs). The immobilized GOx catalyzes the oxidation of β-d-glucose to generate H2O2, which induces the growth of the 5 nm AuNPs in the presence of AuCl4–. With the enlargement of AuNPs, the solution turns red from colorless.
Experimental Section
Materials and Instrumentation
Gold nanoparticles (AuNPs, 83 nM) with a diameter of 5 nm were purchased from TED PELLA, Inc. Prostate-specific antigen (PSA), glucose oxidase (GOx), glucose, gold(III) chloride trihydrate (HAuCl4-3H2O), Tween 20, fetal bovine serum (FBS), and bovine serum albumin (BSA) were purchased from Sigma-Aldrich. Tetramethylbenzidine (TMB) substrate kit, hydrogen peroxide (H2O2), bicinchoninic acid (BCA) protein assay kit, and N-hydroxysuccinimide-activated magnetic beads (NHS-MBs) with a diameter of around 1 μm were purchased from Fisher Scientific. H2O2 Assay Kit (ab102500) was purchased from Abcam. DBCO–PEG4–NHS ester (NHS-DBCO) and Azido–PEG4–NHS ester (NHS-azide) were purchase from Click Chemistry Tools. Phosphate buffered saline (PBS, 10×, pH 7.4) was purchased from Mediatech, Inc., and was diluted 10-fold when used. The 96-well polystyrene plate was purchased from R&D Systems. Monoclonal primary antihuman PSA antibody (PSA-Ab1, clone no. CHYH1) and secondary antihuman PSA antibody (PSA-Ab2, clone no. CHYH2) were purchased from Anogen/Yes Biotech Laboratory, Ltd. The serum samples were obtained from Capital Biosciences, and participants have given written informed consent for scientific research. PSA (human) ELISA kit was purchased from Abnova Corporation. Deionized water (Milli-Q grade, Millipore) with a resistivity of 18.2 MΩ·cm was used throughout this study. The UV–vis spectra of AuNP solutions were recorded with a Genesys 10s UV–vis spectrophotometer. The absorbance of AuNP solutions in 96-well plates were collected at 530 nm by a Synergy 2 Multi-Mode Microplate Reader (Bio-Tek Instruments, Inc.). TEM images were obtained by using a JEOL 1400 model at an accelerating voltage of 100 kV. Dynamic light scattering (DLS) was performed on a Zeta Sizer Nano ZS (Malvern Zetasizer 3000HS and He/Ne laser at 632.8 nm at scattering angles of 90 at 25 °C).
Identification of the AuNP-Based Assay
H2O2 was first diluted with deionized water to result in various concentrations ranging from 10 μM to 1 mM. To the resulted H2O2 solutions was then added 0.6 mM HAuCl4. Finally, 8.3 nM AuNP seeds (5 nm in diameter) were added into each solution. The mixtures were incubated at ambient temperature for 20 min. The photograph was taken, and the corresponding UV–vis absorption was collected by a Genesys 10s UV–vis spectrophotometer.
Preparation of Ab2–GOx–MBs
To obtain Ab2–GOx–MBs, we first prepared dibenzocyclooctyl (DBCO)-conjugated Ab2. Briefly, Ab2 was dissolved in 200 μL of PBS (pH 7.4) at a concentration of 1.0 mg/mL. Then, NHS-activated DBCO (10 mM, 6.5 μL) was mixed with the Ab2 solution at a 50:1 mol ratio and incubated at ambient temperature for 30 min. The reaction was stopped by quenching buffer (50 mM Tris-HCl, pH 8), and the quenching reaction was allowed to proceed at ambient temperature for 5 min. The resulting products were purified using a centrifugal filter device (Amicon Ultra-0.5, Millipore) with a 30K Nominal Molecular Weight Limit (NMWL). The purified antibodies were measured by UV–vis absorption. As shown in Figure S2, Supporting Information, a new absorption peak at around 309 nm was observed, which was attributed to the DBCO moieties on Ab2. The number of DBCO per Ab2 can be determined from the absorbance scan of the purified product. On the basis of the Beer–Lambert law,
| 1 |
where A309DBCO is the absorbance of DBCO-Ab2 at 309 nm; ε309DBCO and ε280Ab2 represent the extinction coefficients of DBCO (12 000 M–1 cm–1) and Ab2 (204 000 M–1 cm–1), respectively; A280CAb2 is the corrected absorbance of DBCO-Ab2 at 280 nm, which can be calculated by the equation A280CAb2 = A280Ab2 – (A309DBCO × CFDBCO), where A280Ab2 is the absorbance of DBCO-Ab2 at 280 nm; and CFDBCO is the correction factor at 280 nm (1.089). On the basis of eq 1 and Figure S2, Supporting Information, the average number of DBCO per Ab2 was calculated to be 21.
After obtaining DBCO-Ab2, we then prepared GOx-MBs. As started, 200 μL of NHS-activated MBs (1 mg/mL) were placed into a 1.5 mL microcentrifuge tube, and the supernatant was removed by a magnetic stand. Then, ice-cold HCl solution (1 mM) was added to wash the beads. The activated beads were mixed with 100 μL of GOx (3 mg/mL) in PBS by votexing for 30 s. The mixture was incubated for 1 h at room temperature on a rotator. During the first 30 min of the incubation, the tube was vortexed for 15 s every 5 min. For the remaining time, the tube was vortexed for 15 s every 15 min until the reaction was complete. Once GOx-loaded MBs were obtained, the number of GOx per MB was measured to be around 76 000 by the BCA protein assay kit.
To conjugate with DBCO-Ab2, the GOx-MBs were first modified with azide groups by adding 2 μL of NHS-activated azide (1 mM) into the obtained GOx-MB solution. The resulting solution was incubated at ambient temperature for 30 min and purified by a magnetic stand. The resulting azide-modified GOx-MBs (200 μL, 1 mg/mL) were mixed with the as-prepared DBCO-Ab2 (2 μL, 1 mg/mL). The mixture was allowed to incubate at ambient temperature for 2 h. The resulting Ab2–GOx–MBs were collected and purified by a magnetic stand for further use.
Detection of Ab2–GOx–MBs by the AuNP-Based Assay
To demonstrate that Ab2–GOx–MBs can catalyze the oxidation of glucose to generate H2O2, we applied our colorless-to-red assay to monitor the generated H2O2, which in turn was used to measure the amount of Ab2–GOx–MBs. Ab2–GOx–MBs with various concentrations ranging from 105 to 109 particles/mL were incubated with glucose (5 mM) in pH 5.0 citrate–Na2HPO4 buffered solutions. The resulting solutions were then incubated at 35 °C for 10 min. The obtained solutions were added to the mixture of 5 nm AuNP seeds (8.3 nM) and AuCl4– (0.6 mM). The mixtures were then incubated at ambient temperature for 20 min. The absorbance at 530 nm was recorded by a Synergy 2 Multi-Mode Microplate Reader.
Procedure of AuNP-Based Immunoassay for PSA
The immunoassay detection was performed in 96-well polystyrene (PS) plates. First, Ab1 (4 μg/mL) in bicarbonate buffer (100 mM, pH 9.6) was added into the wells in the PS plate and incubated at 4 °C overnight. After rinsing with PBS for 3 runs, 1% bovine serum albumin (BSA) in PBS was added into each well as a blocking agent. Then, PSA-spiked PBS and 100% fetal bovine serum solutions were added, respectively, at concentrations ranging from 10 to 105 fg/mL, and the PBS-only and serum-only solutions were set as controls. The plate was kept at 37 °C for 1 h and washed with PBS for 3 runs. Later, 100 μL of Ab2–GOx–MB (0.1 mg/mL) solutions were added into each well, and incubated for 30 min. Two hundred microliters of PBST was added into each well and rinsed for 3 runs. Glucose (5 mM) in pH 5.0 citrate–Na2HPO4 buffered solutions was added into each well and incubated at 35 °C for 10 min. To each well was added the mixture of 5 nm AuNP seeds (8.3 nM) and AuCl4– (0.6 mM). The mixtures were incubated at ambient temperature for 20 min. In the end, photographs were taken and their corresponding absorbance at 530 nm was recorded by a Synergy 2 Multi-Mode Microplate Reader.
HRP-Based ELISA for PSA
In terms of HRP-based ELISA for PSA, we applied the commercial PSA assay kit to measure the levels of PSA in both spiked samples and clinical samples. We performed the detection procedures strictly by following the recommended steps as received.
Results and Discussion
As a starting point, we attempted to demonstrate the concept and investigate the impact of H2O2 on the growth of AuNPs. Different concentrations of H2O2 were added to a solution containing 5 nm AuNP seeds (8.3 nM, stabilized by citrate) and AuCl4– (0.6 mM). The resulting solutions were allowed to incubate at room temperature for 20 min (see the dynamic process in Figure 1). The results in Figure 2a show that, as the concentration of H2O2 increases, the solutions gradually turn red. The color intensity is highly associated with the concentration of H2O2. The obtained red solutions can be monitored by UV–vis spectroscopy. As depicted in Figure 2b, the absorbance at around 530 nm is intensified with an increased amount of H2O2. By collecting the absorbance at 530 nm for each solution, we found the intensity of the red color is in a linear range between 10 and 100 μM (Figure 2c), suggesting the feasibility of this probe to quantify the target of interest.
Figure 1.
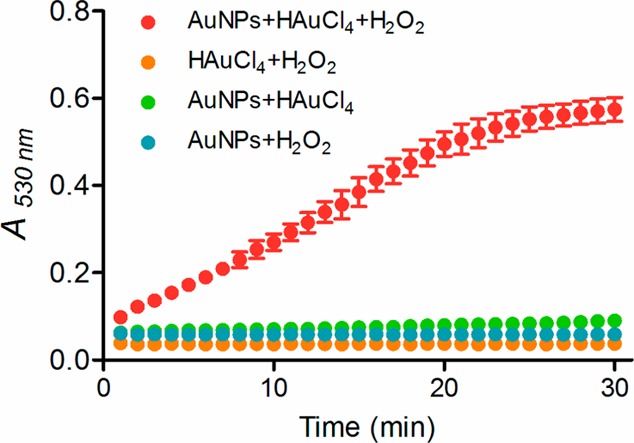
Plots of A530nm (absorbance at 530 nm) values of 5 nm AuNP solutions (8.3 nM) without and with the presence of HAuCl4 (0.6 mM) and/or H2O2 (0.2 mM). Red solid circle, 5 nm AuNPs solution incubated with both HAuCl4 and H2O2; yellow solid circle, the mixture of HAuCl4 and H2O2; green solid circle, 5 nm AuNPs solution incubated with HAuCl4; blue solid circle, 5 nm AuNP solution incubated with H2O2. The A530nm values for each sample were recorded every 1 min by a Synergy 2 Multi-Mode Microplate Reader. Error bar: standard deviation of three independent measurements.
Figure 2.

Verification of the growth of 5 nm AuNPs in the presence of H2O2 and HAuCl4. (a) With the addtion of varying amounts of H2O2 into the mixture of 5 nm AuNPs (8.3 nM) and HAuCl4 (0.6 mM), the solutions changed gradually from colorless to red. (b) Appearance of the absorption bands at around 530 nm reflects the colorless-to-red process. (c) A530nm values were plotted against various concentrations of H2O2. Error bar: standard deviations of three independent measurements. (d–f) TEM images of 5 nm AuNPs (d) and those after adding (e) 10, (f) 100, and (g) 1000 μM of H2O2, respectively. Scale bar, 50 nm.
A further insight into the mechanism of the red color emergence can be obtained by transmission electron microscopy (TEM). Figure 2d shows the TEM image of the 5 nm AuNP seeds. Figure 2e–g shows the obtained AuNPs after treatment of the seeds with 10, 100, and 1000 μM of H2O2, respectively. For the sample treated by 10 μM of H2O2, most AuNPs were 5 nm AuNP seeds accompanied by a few larger sized spherical AuNPs (28.4 ± 4.6 nm in diameter). When the concentration of H2O2 was increased to 100 μM, some AuNP clusters were found, causing the enlargement of AuNPs with a wide size distribution (29.5 ± 16.8 nm). The color of the solutions became purple most likely due to the formation of larger sized AuNPs, which was confirmed by the red shift (ca. 13 nm) of the maximum absorbance in the UV–vis spectra (Figure 2b). It has been reported that the clusters are catalytically grown at the sharp intersections of the faces of the parent AuNP seeds.19,20 Interestingly, when the concentration of H2O2 reached 1000 μM, the clusters disappeared. Instead, the AuNPs became spherical with relatively narrow size distribution (24.5 ± 12.2 nm). As a consequence, the color of the solutions turned red, and a blue shift in the absorbance maxima was observed (Figure 2b). The morphological change of the obtained AuNPs can be explained by the fact that Au deposit tends to smooth out the sharp edges of the particles to decrease their surface energy.21 The size change of the obtained AuNPs was also supported by the dynamic light scattering (DLS) analysis (Figure S3, Supporting Information). It is worth pointing out that other reducing agents such as ascorbic acid and NADH may have the same function as H2O2, i.e., reacting with AuCl4– in the presence of AuNP seeds and thus causing the enlargement of AuNPs. By incubating various concentrations of ascorbic acid and NADH separately with the mixture of 5 nm AuNP seeds (8.3 nM) and AuCl4– (0.6 mM), we observed that the color of the solutions turned red rapidly and that more reducing agents induced more red color. The color change was reflected by the absorbance at around 530 nm (Figure S4, Supporting Information).
After demonstrating that H2O2 can enlarge 5 nm AuNPs and the growth process can be seen by the naked eye, we attempted to bring this approach into immunoassays. We first prepared the Ab2 and GOx comodified magnetic beads (Ab2–GOx–MBs) through a step-by-step procedure. MB has been reported as an excellent carrier that can load many thousands of enzyme molecules for signal amplification while maintaining the activity.22−25 In this study, we chose N-hydroxysuccinimide (NHS)-activated MB (1 μm in diameter) to load GOx (approximately 76 000 GOX per MB), and the resulting GOx-coated beads were conjugated with Ab2 via a copper-free click chemistry (details were shown in Supporting Information).26 Upon obtaining Ab2–GOx–MBs, we applied the as-prepared AuNP-based probe to test their GOx-like activity, i.e., catalyzing the oxidation of glucose to generate H2O2. Ab2–GOx–MBs with various concentrations were first mixed with glucose (5 mM) to produce various amounts of H2O2. The resulting solutions were added to the mixture of 5 nm AuNP seeds (8.3 nM) and AuCl4– (0.6 mM). Under the optimized reaction conditions (Figures S5 and S6, Supporting Information), we observed that the solutions turned red gradually, and the color intensity is highly related to the concentration of Ab2–GOx–MBs, which was further confirmed by the absorbance at 530 nm (Figure S7, Supporting Information). On the basis of a signal-to-noise ratio of 3, the limit of detection (LOD) of the colorless-to-red probe for Ab2–GOx–MBs was determined to be 3.4 × 10⁴ particles/mL with a wide linear range from 105 to 109 particles/mL.
This strategy was subsequently adapted into the sandwich ELISA for PSA detecion, which is a classical prostate cancer biomarker approved by the Food and Drug Administration (FDA). We started the detection by diluting various concentrations of PSA with PBS to result in final concentrations ranging from 10 to 105 fg/mL. To test the possible interference from the unknown matrices in real samples, PSA was also spiked into fetal bovine sera at the same concentrations as another group. For both groups of PSA-spiked samples, the colorless solutions became purple, whose intensity is highly dependent on the concentration of PSA. Higher concentrations of PSA enabled more purple color (Figure 3a). In comparison, the samples remained colorless if no PSA was added. More importantly, the tendency in color emergence of the two groups of samples is almost the same, indicating that the unrelated components in clinical samples may have negligible effects on this immunoassay. Therefore, the emergence of purple color is due to the biospecific interactions between PSA and its antibodies rather than the nonspecific adsorption of Ab2–GOx–MB on the PS substrate. The lowest detectable concentration of PSA where the purple color can be clearly discriminated by the naked eye was 10 fg/mL (300 aM). Note that the color of the solution is purple rather than red. This phenomenon is most likely due to the fact that the amount of the generated H2O2 is not sufficient to catalyze the formation of uniform spherical AuNPs. To test this hypothesis, we measured the concentration of the generated H2O2 in each well. As shown in Figure S8, Supporting Information, the amount of the generated H2O2 is highly correlated with the PSA concentration. More PSA can pull down more Ab2–GOx–MB on the PS substrate, thus inducing more H2O2. Owing to the fact that all the samples generated less than 100 mM of H2O2, in which larger sized AuNP clusters were formed, leading to purple colored solution, which agreed well with the results in Figure 2.
Figure 3.
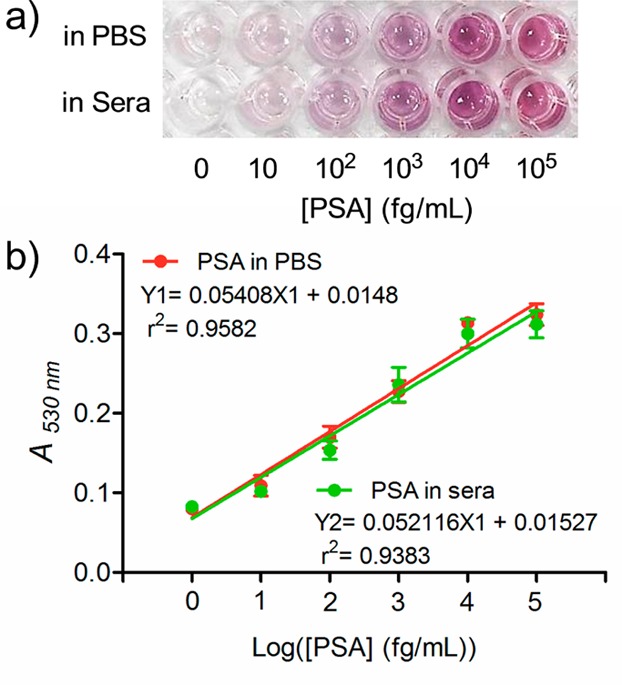
Quantitative immunoassay of PSA in PBS and sera samples. (a) Naked-eye detection of PSA with different concentrations in PBS and fetal bovine sera. (b) Plots of A530nm values versus different concentrations of PSA. Error bar: standard deviation of three independent measurements.
Furthermore, the naked-eye results were validated by measuring the absorbance at 530 nm on a conventional microplate reader. The calibration curves shown in Figure 3b suggested that the linear detection ranges for both cases are from 10 to 105 fg/mL. This linear range is much wider than that of HRP-based ELISA, indicating that our immunoassay is particularly useful for quantitative detection of biomarkers whose concentrations are from fg/mL to pg/mL. For the spiked PSA in PBS, the LOD defined by a signal-to-noise ratio of 3 was determined to be 3.1 fg/mL (93 aM), while that for PSA spiked in sera was 4.6 fg/mL (138 aM). By contrast, the LOD of HRP-based ELISA for PSA in sera was 0.21 ng/mL (6.3 pM; Figure S9, Supporting Information), at least 4 orders of magnitude higher than that of the AuNP-based immunoassay.
The excellent detection sensitivity can be attributed to two rounds of signal amplification. In the first round, MBs are used to load many thousands of GOx, which are then conjugated with detection antibodies via copper-free click chemistry. It is understandable that more GOx can generate more H2O2, thus producing more Au(0). In the second round, the activity of the loaded GOx is highly maintained, and the anchored GOx can catalyze its substrate glucose oxidase to generate H2O2. H2O2 can react with AuCl4– in the presence of 5 nm AuNP seeds and thus causes the enlargement of AuNPs, whose extinction coefficients (108–1010 M–1 cm–1) are much higher than those of organic dyes. This Au growth event can be reflected by the color emergence of the AuNP solutions from colorless to purple, which can be observed by the naked eye. A very small amount of the analyte can thus be detected because of the high density of GOx on MB and the Au growth reaction.
Encouraged by the unprecedented sensitivity and wide linear detection range for PSA, 12 patient sera with prostate cancer and 5 healthy sera were employed to evaluate the capability of our assay in the real world. The results were compared with the HRP-based ELISA. The differentiation of positive and negative signals depended on the clinical threshold, which was indicated by the horizontal dotted line. As shown in Figure 4a, all 12 patient sera were positively detected by the AuNP-based immunoassay; that is, the A530nm values are clearly above the clinical threshold, which was set to be 0.085. Meanwhile, the signals for the 5 healthy samples were below the clinical threshold, indicating that the AuNP-based immunoassay provides 100% sensitivity and 100% specificity for PSA. In comparison, two patient sera (Nos. 4 and 9) were not positively detected by HRP-based ELISA (Figure 4b); that is, the OD450nm values were below the clinical threshold (where the OD450nm value is 0.05). The results are not surprising because of the moderate sensitivity of HRP-based ELISA, which may not reach the clinical concentrations of PSA in certain patient sera (generally below 0.1 ng/mL).
Figure 4.

Detection of PSA in human sera using the AuNP-based quantitative immunoassay and comparison with HRP-based ELISA. PSA samples collected from 12 prostate cancer patient sera and 5 healthy sera (control) were used to evaluate the detection performance of (a) AuNP-based immunoassay and (b) conventional HRP-based ELISA. All patient sera were unambiguously detected by the AuNP-based immunoassay, while HRP-based ELISA failed to detect two patient sera (Nos. 4 and 9, as indicated by asterisk (*) in panel b). (c) Results of the quantitative detection of PSA in clinical samples by the AuNP-based immunoassay were compared with HRP-based ELISA. Error bars show the standard deviations of three independent measurements.
To demonstrate that the AuNP-based immunoassay can accurately quantify target molecules in biological samples, the patient sera samples were diluted using fetal bovine serum by 10 000-fold to correspond to the linear range of the calibration curve. As a comparison, the undiluted patient sera were also screened by HRP-based ELISA. Results from the two methods showed excellent correlation, and no significant difference in quantifying the amounts of PSA was observed (P > 0.05) (Figure 4c). On the basis of the calibration curve, the PSA concentrations in patient Nos. 4 and 9 that were undetectable by HRP-based ELISA were determined to be 0.031 and 0.0056 ng/mL, respectively, by the AuNP-based immunoassay. These results indicate that the AuNP-based immunoassay not only can be used for the identification of very low concentrations of cancer protein biomarkers in clinical samples by the naked eye but also can quantitatively measure the biomarkers in a wide linear range.
Conclusions
In summary, we have designed a quantitative immunoassay to detect cancer biomarkers in clinical samples with very high analytical figures of merit. Unlike traditional AuNP-based assays, which generally depend on the monodisperse or aggregated state of AuNPs, this presented assay is based on the enzyme-catalyzed growth of 5 nm AuNPs, leading to the emergence of red color. The color emergence can be easily distinguished by the naked eye, making this format particularly suitable for POC diagnostics in both resource-rich and resource-limited settings.27−33 Furthermore, owing to its unprecedented sensitivity and wide linear range, this immunoassay was able to quantitatively measure very low levels of cancer biomarkers in clinical samples. Although only PSA was used as a proof-of-concept, this approach is generalizable to be readily extended to other ELISA systems.
Acknowledgments
This work was supported in part, by the Fundamental Research Funds for Central Universities (China) and the Intramural Research Program (IRP) of the National Institute of Biomedical Imaging and Bioengineering, National Institutes of Health.
Supporting Information Available
Additional figures and tables. This material is available free of charge via the Internet at http://pubs.acs.org.
The authors declare no competing financial interest.
Funding Statement
National Institutes of Health, United States
Supplementary Material
References
- Thaxton C. S.; Elghanian R.; Thomas A. D.; Stoeva S. I.; Lee J. S.; Smith N. D.; Schaeffer A. J.; Klocker H.; Horninger W.; Bartsch G.; Mirkin C. A. Proc. Natl. Acad. Sci. U.S.A. 2009, 106, 18437–18442. [DOI] [PMC free article] [PubMed] [Google Scholar]
- Rissin D. M.; Kan C. W.; Campbell T. G.; Howes S. C.; Fournier D. R.; Song L.; Piech T.; Patel P. P.; Chang L.; Rivnak A. J.; Ferrell E. P.; Randall J. D.; Provuncher G. K.; Walt D. R.; Duffy D. C. Nat. Biotechnol. 2010, 28, 595–599. [DOI] [PMC free article] [PubMed] [Google Scholar]
- Park J. S.; Cho M. K.; Lee E. J.; Ahn K. Y.; Lee K. E.; Jung J. H.; Cho Y.; Han S. S.; Kim Y. K.; Lee J. Nat. Nanotechnol. 2009, 4, 259–264. [DOI] [PubMed] [Google Scholar]
- Chen Z.; Tabakman S. M.; Goodwin A. P.; Kattah M. G.; Daranciang D.; Wang X.; Zhang G.; Li X.; Liu Z.; Utz P. J.; Jiang K.; Fan S.; Dai H. Nat. Biotechnol. 2008, 26, 1285–1292. [DOI] [PubMed] [Google Scholar]
- Liu D.; Huang X.; Wang Z.; Jin A.; Sun X.; Zhu L.; Wang F.; Ma Y.; Niu G.; Hight Walker A. R.; Chen X. ACS Nano 2013, 7, 5568–5576. [DOI] [PMC free article] [PubMed] [Google Scholar]
- De la Rica R.; Stevens M. M. Nat. Nanotechnol. 2012, 7, 821–824. [DOI] [PubMed] [Google Scholar]
- De la Rica R.; Stevens M. M. Nat. Protoc. 2013, 8, 1759–1764. [DOI] [PubMed] [Google Scholar]
- Qu W.; Liu Y.; Liu D.; Wang Z.; Jiang X. Angew. Chem., Int. Ed. 2011, 50, 3442–3445. [DOI] [PubMed] [Google Scholar]
- Zhang Y.; Guo Y.; Xianyu Y.; Chen W.; Zhao Y.; Jiang X. Adv. Mater. 2013, 25, 3802–3819. [DOI] [PubMed] [Google Scholar]
- Liu D.; Wang Z.; Jin A.; Huang X.; Sun X.; Wang F.; Yan Q.; Ge S.; Xia N.; Niu G.; Liu G.; Hight Walker A. R.; Chen X. Angew. Chem., Int. Ed. 2013, 52, 14065–14069. [DOI] [PMC free article] [PubMed] [Google Scholar]
- Lu C.; Wang Y.; Ye S.; Chen G.; Yang H. NPG Asia Mater. 2012, 4, e10. [Google Scholar]
- Xue X.; Wang F.; Liu X. J. Am. Chem. Soc. 2008, 130, 3244–3245. [DOI] [PubMed] [Google Scholar]
- Liu J. W.; Lu Y. J. Am. Chem. Soc. 2003, 125, 6642–6643. [DOI] [PubMed] [Google Scholar]
- Liu D.; Chen W.; Sun K.; Deng K.; Zhang W.; Wang Z.; Jiang X. Angew. Chem., Int. Ed. 2011, 50, 4103–4107. [DOI] [PubMed] [Google Scholar]
- Li D.; Wieckowska A.; Willner I. Angew. Chem., Int. Ed. 2008, 47, 3927–3931. [DOI] [PubMed] [Google Scholar]
- Liu D.; Qu W.; Chen W.; Zhang W.; Wang Z.; Jiang X. Anal. Chem. 2010, 82, 9606–9610. [DOI] [PubMed] [Google Scholar]
- Xia Y.; Ye J.; Tan K.; Wang J.; Yang G. Anal. Chem. 2013, 85, 6241–6247. [DOI] [PubMed] [Google Scholar]
- Rodríguez-Lorenzo L.; de la Rica R.; Alvarez-Puebla R. A.; Liz-Marzán L. M.; Stevens M. M. Nat. Mater. 2012, 11, 604–607. [DOI] [PubMed] [Google Scholar]
- Link S.; El-Sayed M. A. Annu. Rev. Phys. Chem. 2003, 54, 331–366. [DOI] [PubMed] [Google Scholar]
- Zayats M.; Baron R.; Popov I.; Willner I. Nano Lett. 2005, 5, 21–25. [DOI] [PubMed] [Google Scholar]
- Wang Z.; Zhang J.; Ekman J. M.; Kenis P. J.; Lu Y. Nano Lett. 2010, 10, 1886–1891. [DOI] [PubMed] [Google Scholar]
- Krishnan S.; Mani V.; Wasalathanthri D. P.; Kumar C. V.; Rusling J. F. Angew. Chem., Int. Ed. 2011, 50, 1175–1178. [DOI] [PMC free article] [PubMed] [Google Scholar]
- Mani V.; Wasalathanthri D. P.; Joshi A. A.; Kumar C. V.; Rusling J. F. Anal. Chem. 2012, 84, 10485–10491. [DOI] [PMC free article] [PubMed] [Google Scholar]
- Munge B. S.; Coffey A. L.; Doucette J. M.; Somba B. K.; Malhotra R.; Patel V.; Gutkind J. S.; Rusling J. F. Angew. Chem., Int. Ed. 2011, 50, 7915–7918. [DOI] [PMC free article] [PubMed] [Google Scholar]
- Lewis G. G.; Robbins J. S.; Phillips S. T. Anal. Chem. 2013, 85, 10432–10439. [DOI] [PubMed] [Google Scholar]
- Baskin J. M.; Prescher J. A.; Laughlin S. T.; Agard N. J.; Chang P. V.; Miller I. A.; Lo A.; Codelli J. A.; Bertozzi C. R. Proc. Natl. Acad. Sci. U.S.A. 2007, 104, 16793–16797. [DOI] [PMC free article] [PubMed] [Google Scholar]
- Xiang Y.; Lu Y. Nat. Chem. 2011, 3, 697–703. [DOI] [PMC free article] [PubMed] [Google Scholar]
- Lam B.; Das J.; Holmes R. D.; Live L.; Sage A.; Sargent E. H.; Kelley S. O. Nat. Commun. 2013, 4, 2001. [DOI] [PubMed] [Google Scholar]
- De M.; Rana S.; Akpinar H.; Miranda O. R.; Arvizo R. R.; Bunz U. H. F.; Rotello V. M. Nat. Chem. 2009, 1, 461–465. [DOI] [PMC free article] [PubMed] [Google Scholar]
- Chung H. J.; Castro C. M.; Im H.; Lee H.; Weissleder R. Nat. Nanotechnol. 2013, 8, 369–375. [DOI] [PMC free article] [PubMed] [Google Scholar]
- Song S.; Liang Z.; Zhang J.; Wang L.; Li G.; Fan C. Angew. Chem., Int. Ed. 2009, 48, 8670–8674. [DOI] [PubMed] [Google Scholar]
- Chin C. D.; Laksanasopin T.; Cheung Y. K.; Steinmiller D.; Linder V.; Parsa H.; Wang J.; Moore H.; Rouse R.; Umviligihozo G.; Karita E.; Mwambarangwe L.; Braunstein S. L.; van de Wijgert J.; Sahabo R.; Justman J. E.; El-Sadr W.; Sia S. K. Nat. Med. 2011, 17, 1015–1019. [DOI] [PubMed] [Google Scholar]
- Lin K. Y.; Kwong G. A.; Warren A. D.; Wood D. K.; Bhatia S. N. ACS Nano 2013, 7, 9001–9009. [DOI] [PMC free article] [PubMed] [Google Scholar]
Associated Data
This section collects any data citations, data availability statements, or supplementary materials included in this article.