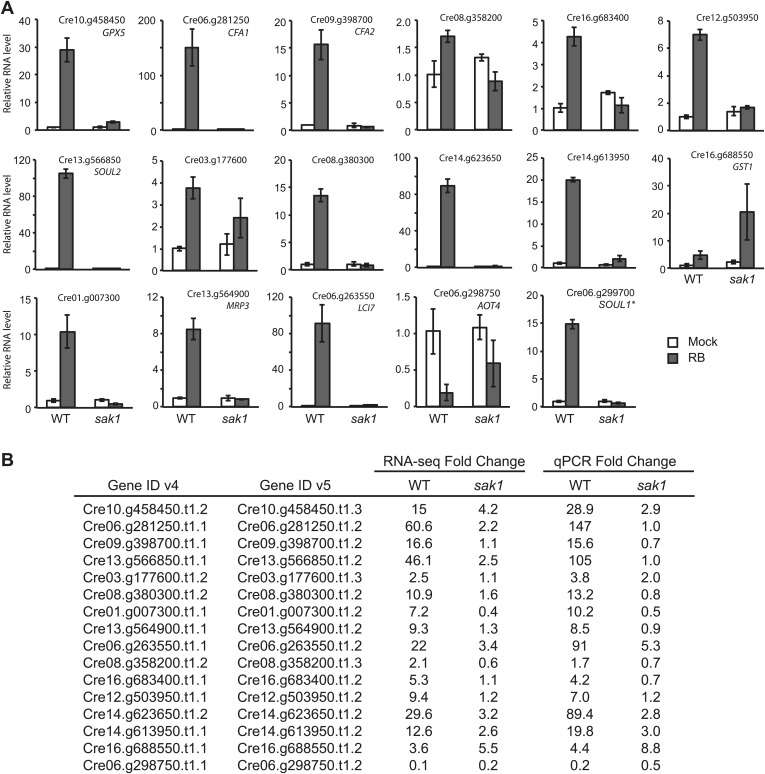
Figure 2. qRT-PCR analysis of genes identified to be 1O2-responsive by RNA-seq.
(A) The error bars indicate standard deviation of biological triplicates. The locus of the transcript (v5) and gene name if annotated, are indicated. *SOUL1 was named gene in v4 but not in v5. (B) Comparison of fold change values from RNA-seq data and qPCR. Fold change values were calculated for RNA-seq as described in ‘Material and methods’, and the values for qPCR are averages obtained from biological triplicates.

