

Background: KstR represses expression of numerous genes responsible for cholesterol catabolism in Mycobacterium.
Results: 3-Oxo-4-cholestenoic acid is identified as the inducer molecule of M. smegmatis KstR repressor.
Conclusion: Oxidation of C3 and C26 of cholesterol is required to activate the system.
Significance: The finding of the KstR inducer molecule represents new insights in developing new targets to fight against M. tuberculosis.
Keywords: Actinobacteria, Cholesterol Metabolism, Cholesterol Regulation, Mycobacterium, Transcription Regulation
Abstract
Cholesterol degradation plays a prominent role in Mycobacterium tuberculosis infection; therefore, to develop new tools to combat this disease, we need to decipher the components comprising and regulating the corresponding pathway. A TetR-like repressor (KstR) regulates the upper part of this complex catabolic pathway, but the induction mechanism remains unknown. Using a biophysical approach, we have discovered that the inducer molecule of KstR in M. smegmatis mc2155 is not cholesterol but 3-oxo-4-cholestenoic acid, one of the first metabolic intermediates. Binding this compound induces dramatic conformational changes in KstR that promote the KstR-DNA interaction to be released from the operator, retaining its dimeric state. Our findings suggest a regulatory model common to all cholesterol degrading bacteria in which the first steps of the pathway are critical to its mineralization and explain the high redundancy of the enzymes involved in these initial steps.
Introduction
Mycobacterium smegmatis is a model organism, widely used to study the biology of Mycobacterium tuberculosis. Recent research has used this model to investigate different aspects of cholesterol catabolism (1–3), exploited as a carbon and energy source by the pathogen and necessary for persistence in animal infection models (4). Although a compendium of biochemical and structural studies describe mycobacterial cholesterol catabolism, the degradation pathway and its transcriptional regulation are not yet fully established (5–7). The two first steps in cholesterol catabolism are the oxidation of C3 by cholesterol oxidases or 3-β-hydroxysteroid dehydrogenase/isomerases (8–14) and the oxidation of C26 by P450 cytochromes (CYP125 and CYP142) (5, 15–18), which are carried out sequentially and/or simultaneously. These biochemical reactions render the molecules cholest-4-en-3-ona (cholestenone) (after cholesterol C3 oxidation), 3-β-hydroxy-5-cholestenoic acid (3OHChA)3 (after cholesterol C26 oxidation), and 3-oxo-4-cholestenoic acid (3OChA) (after C3 and C26 oxidations) (Fig. 1). Remarkably, the enzymes performing these biochemical reactions are highly redundant in M. smegmatis (11, 18, 19).
FIGURE 1.

Initial steps of aerobic cholesterol degradation in bacteria. Sterol degradation proceeds via steroid ring oxidation and side chain degradation (upper route). The exact order of side chain degradation and ring oxidation in vivo is unknown. The depicted metabolites are: (1) cholest-5-en-3β-ol (cholesterol), (1′) cholest-4-en-3-one, (2) 26OHCh, (2′) 26OHCh-3O, (3) 3OHChA, (3′) 3OChA, (4 and 4′) the corresponding CoA derivatives of 3 and 3′, (5) AD, and (6) ADD. CYP125 and CYP142, steroid 26-monoxigenases; 3-β-HSD, 3-β-hydroxysteroid dehydrogenase; KstD, 3-ketosteroid Δ1-dehydrogenase; FadD, steroid CoA ligase.
This study aims to shed light on the regulation of the cholesterol degradation pathway in mycobacteria, which is apparently controlled by only two TetR-type transcriptional repressors: KstR and KstR2 (2, 3, 20). KstR is encoded by gene Rv3574 in M. tuberculosis and gene MSMEG_6042 in M. smegmatis and controls the expression of 83 cholesterol catabolic genes (kstR regulon) responsible for activating the upper and central pathway (2, 19). KstR2 is encoded by gene Rv3557c in M. tuberculosis and gene MSMEG_6009 in M. smegmatis and controls the expression of 15 cholesterol catabolic genes (kstR2 regulon) responsible for the lower pathway (3). Both regulators belong to the TetR family of transcriptional repressors, which is well represented and widely distributed among bacteria and easily recognized by their characteristic HTH DNA-binding motif (21). Several genes in the kstR regulon are essential for virulence, demonstrating the importance of cholesterol catabolism in the pathogenesis of M. tuberculosis (7, 22–26). KstR binds to the target promoters as a dimer through a conserved motif (TNNAACNNGTTNNA) (2, 20). Despite the critical role played by kstR regulon, the mechanisms involved in this regulation are still poorly understood, and the inducer molecules of KstR are still unidentified (20). The repression of most described TetR-like regulators is released in the presence of an inducer molecule, causing a conformational change in the protein promoting gene transcription (21). Thus, KstR and KstR2 might be induced by cholesterol or cholestenone because these compounds induce the expression of the kstR and kstR2 regulons in vivo (2, 3, 19, 20). In this respect, we used EMSA analyses to demonstrate the ability of KstR to bind the MSMEG_5228 promoter region. However, the analyses to evaluate the KstR interactions with its putative inducers, i.e. cholesterol or cholestenone, did not render positive results, and therefore, we could not conclude that these substances directly induce kstR regulon (20). The crystal structure of KstR from M. tuberculosis has recently been revealed (Protein Data Bank code 3MNL) but was solved in the absence of inducers.
The literature provides examples of regulators induced by steroids. CmeR from Campilobacter jejuni and BreR from Vibrio cholerae belong to the TetR family of regulators, and both repress the expression of genes that encode multidrug efflux system components in the absence of bile acids (27, 28). Researchers have described the crystal structure of CmeR in a complex with the bile acids cholate and taurocholate (29). Furthermore, the specific interaction between the negative regulator RepA and testosterone has been also demonstrated in Comamonas testosteroni (30).
To provide further insights into the KstR-mediated repression mechanism in mycobacteria, we used circular dichroism to measure the physical interactions of KstR with several intermediates of the pathway that could act as putative inducers. The compounds that modified the secondary structure of KstR were further tested as inducers in transcription assays in vitro. Our results showed that the concerted action of the two primary independent oxidative steps in cholesterol catabolism at C3 and C26 are necessary to produce the metabolite inducing kstR regulon expression.
EXPERIMENTAL PROCEDURES
Chemicals
Cholesterol, cholest-4-en-3-one, 4-androstene-3,17-dione (AD), 1,4-androstadiene-3,17-dione (ADD), palmitic acid, palmitoyl alcohol, oleic acid, oleyl alcohol, 1-octanol, octanoic acid, decane, tyloxapol, Tween 80, Triton X-100, and streptomycin sulfate were purchased from Sigma-Aldrich. Choles-5-ene-3β,26-diol (26-hydroxycholesterol (26OHCh)), 3OHChA, and 3OChA were obtained from Avanti Polar Lipids.
Bacterial Strains, Plasmids, and Culture Conditions
Bacterial strains and plasmids are listed in Table 1. Escherichia coli was grown in LB medium (31) at 37 °C in an orbital shaker, and when appropriate, ampicillin (100 μg ml−1) and kanamycin (50 μg ml−1) were added to the medium. M. smegmatis mc2155 was grown in 7H9 medium (Difco) containing 10% albumin-dextrose-catalase supplement (Becton Dickinson), 0.2% glycerol, and 0.05% Tween 80 or on 7H10 solid agar medium with the same supplements without Tween 80. For growth in glycerol, cholesterol and palmitic acid as sole carbon sources, 7H9 minimal medium without supplements was used, and the carbon sources were added at 18, 1.8, and 3 mm, respectively. Stocks of 5 mm cholesterol and 8 mm palmitic acid were dissolved in 10% of tyloxapol with magnetic agitation at 80 °C and then autoclaved. Gentamicin and kanamycin were used, if required, at concentrations of 5 and 20 μg ml−1, respectively. M. smegmatis was always grown at 37 °C in an orbital shaker at 250 rpm.
TABLE 1.
Bacterial strains, plasmids, and primers used in this study
| Strain, plasmids, and primers | Genotype, description, or sequence | Source or reference |
|---|---|---|
| Mycobacterium smegmatis | ||
| mc2155 | ept-1, mc26 mutant efficient for electroporation | Ref. 54 |
| mc2155 ΔkstR | mc2155 strain containing a 646-bp pair deletion in the MSMEG_6042 gene | Ref. 2 |
| Escherichia coli | ||
| DH10B | F−, mcrA, Δ (mrr hsdRMS-mcrBC), Φ80lacZΔM15, ΔlacX74, deoR, recA1, araD139, Δ (ara-leu)7697, galU, galK, l−, rpsL, endA1, nupG | Invitrogen |
| BL21(DE3) | F−, ompT, hsdSB (rB − mB−), gal, dcm, λDE3 (harboring gene 1 of the RNA polymerase from the phage T7 under the PlacUV5 promoter) | Ref. 31 |
| Plasmids | ||
| pET6042 | pET29a (+) cloning and expression vector (KmR, oriColE1, T7 promoter) containing MSMEG_6042 gene | Ref. 20 |
| pUJ9 | Promoterless lacZ vector, ApR | Ref. 55 |
| pUJ9PQ3 | pUJ9 vector containing the chimeric promoter PQ3 cloned into EcoRI and BamHI restriction sites | This study |
| pUJ5228 | pUJ9 vector containing the P5228 promoter cloned into EcoRI and BamHI restriction sites | Ref. 20 |
| pJCD01 | pUC19 derivative, vector for in vitro transcription, ApR | Ref. 36 |
| pJCDPQ3 | pJCD01 vector containing the chimeric promoter PQ3 cloned into EcoRI and PstI restriction sites | This study |
| pSEVA651 | Promoterless cloning vector, GmR, RFS1010 | Ref. 33 |
| pSEVAP5228 | pSEVA651 vector containing the P5228::lacZ translational fusion | This study |
| pSEVAPQ3 | pSEVA651 vector containing the PQ3::lacZ translational fusion | This study |
| pMV261 | Shuttle expression vector for expressing genes under the control of pHsp60 promoter, KmR | Ref. 34 |
| pMV6042 | pMV261 containing MSMEG_6042 gene cloned into PstI and SalI restriction sites | This study |
| Primers | ||
| pUJ9PQ-F | GAATTCGTACTGAGAGTGCACCATAAG | This study |
| pUJ9PQ-R | CTGCAGGTTTTCCCAGTCACGACGTTG | This study |
| pMV6042-F | CATGCTGCAGTGACCTAAGGAGGTGAATATGGCCGGAAACTCACAG | This study |
| pET29bhisR | CATGGTCGACGTTAGCAGCCGGATCTCAGTG | This study |
| pJCD01-F | GCCCAGACCTGCGTTCAG | This study |
| pJCD01-R | GTCTTTCGACTGAGCCTTTC | This study |
| MSMEG_5925 int F | CGACAACGTCACCGACATGG | This study |
| MSMEG_5925 int F | CGTTGTGCAGGTACTGGCTG | This study |
| MSMEG_5941 int F | AGGTCTCGAACCGCCGTAC | This study |
| MSMEG_5941 int R | GACGAGGTTCTTGCCGCTG | This study |
| MSMEG_5995 int F | ATGTCGTCGTTCGAGCTGATC | This study |
| MSMEG_5995 int R | TCTGCGCGAACGCGATCATG | This study |
| MSMEG_5996 int F | GACATCGACATGCCCAACC | This study |
| MSMEG_5996 int R | TGTGGTGTCACGCAGACCC | This study |
Design and Cloning of the Chimeric Promoter PQ3
The chimeric promoter PQ3 was designed using the sequence of the lacUV5 promoter from E. coli, a mutated version of the lac promoter whose basal activity is dramatically less sensitive to intracellular levels of cyclic AMPc (32). The chimeric promoter PQ3 was synthesized by GenScript (Hong Kong) and contains a consensus KstR operator sequence (AACTGGAACGTGTTTCAGTT) (2, 20) overlapping the −35 and −10 boxes of the lacUV5 promoter (see Fig. 6A), according to footprinting assays previously described for the M. smegmatis P5228 native promoter (20). The six nucleotides located between the lacI operator and the Shine-Dalgarno sequence were substituted by the BamHI restriction site. In addition, two restriction sites for NdeI and SfoI were included four nucleotides downstream of the Shine-Dalgarno sequence. An EcoRI restriction site was also added five nucleotides upstream of the −35 box. The EcoRI-SfoI-digested fragment carrying the chimeric promoter PQ3 was cloned into the promoter-probe pUJ9 plasmid (Table 1). The resulting plasmid pUJ9PQ3 was used as a PCR template to amplify the synthetic promoter region using the primers pUJ9PQ-F and pUJ9PQ-R (Table 1) carrying the EcoRI and PstI restriction sites, respectively (indicated in bold). The PCR product was digested with EcoRI and PstI and subsequently cloned into the plasmid pJCD01, which contains the pUC19 polylinker flanked by the divergent terminators rpoCT and rrnBT1T2, respectively (Table 1). The resulting plasmid pJCDPQ3 was used as a template to amplify the PQ3 probe used in the EMSAs and for the transcription assays.
FIGURE 6.

KstR binding to the chimeric promoter PQ3 in the presence of 3OChA and palmitic acid. A, sequence of P5228, PlacUV5, and PQ3. The operator sequence for KstR at P5228 and PQ3 promoters is boxed in dark gray. The −35 and −10 boxes, the ribosome binding sites (RBS), and the transcription start site (+1) are indicated. LacI operator sequence at PlacUV5 and PQ3 is boxed in light gray. The direction of transcription is indicated by an arrow. B, analysis by EMSA of KstR binding to the PQ3 promoter. PQ3 probe concentration was 0.5 nm. The concentrations of purified KstR used were 0 nm (lanes 1 and 6), 100 nm (lane 2), 250 nm (lane 3), 500 nm (lane 4), 1 μm (lane 5), and 500 nm (lanes 7–13). Lanes 8–10 contain unlabeled PQ3 DNA probe (40-, 400-, and 4000-fold, respectively), and lanes 11–13 contain unrelated DNA from salmon sperm (0.5, 1.0, and 2.0 μg, respectively). C, analysis by EMSA of the KstR-PQ3 DNA probe complex in the presence of 3OChA and palmitic acid. KstR concentration was 500 nm, except in lane 1 (0 nm). 3OChA (lanes 4–9) was added at 1, 3, 6, 12, 25, and 50 μm. Palmitic acid (lanes 10–15) was added at 10, 50, 100, 250, and 500 μm and 1 mm. KstR containing 5% of methanol (lane 3) was also included as control. D, analysis by EMSA of the KstR-PQ3 DNA probe complex in the presence of 3OHChA. KstR concentration was 500 nm, except in lane 1 (0 nm). 3OHChA (lanes 4–9) was added at 10, 50, 100, 250, and 500 μm and 1 mm. KstR containing 5% methanol (lane 3) was also included as control. E, determination of apparent Kd for KstR binding to the PQ3 DNA probe in the presence of 3OChA and palmitic acid. The apparent Kd is the compound concentration at which 50% of the total probe was bound to KstR. This value was determined from the experiment in C.
P5228::lacZ and PQ3::lacZ Translational Fusion Construction
To perform the in vivo experiments, plasmids pUJ5228 (20) and pUJ9PQ3 (Table 1) harboring the P5228::lacZ and PQ3::lacZ translational fusions, respectively, were digested with NotI and ligated to a NotI-digested plasmid pSEVA651 (33) (Table 1) generating plasmids pSEVAP5228 and pSEVAPQ3, respectively. The resulting plasmids were extracted from E. coli DH10B and electroporated into competent M. smegmatis ΔkstR (2) cells generating the strains M. smegmatis mc2155 ΔkstR (pSEVAP5228) and M. smegmatis mc2155 ΔkstR (pSEVAPQ3), respectively. Then both strains were complemented with gene kstR. To do so, gene MSMEG_6042 was amplified using as a template the pET6042 plasmid and the oligonucleotides pMV6042-F and pET29bhisR (Table 1) carrying the PstI and SalI restriction sites, respectively (indicated in bold). The PCR product was digested with PstI and SalI and subsequently cloned into pMV261 (34) (Table 1). The resulting plasmid pMV6042 was extracted from E. coli DH10B and electroporated into competent cells of M. smegmatis ΔkstR (pSEVAP5228) and M. smegmatis ΔkstR (pSEVAPQ3), generating the strains M. smegmatis ΔkstR (pSEVAP5228 and pMV6042) and M. smegmatis ΔkstR (pSEVAPQ3 and pMV6042), respectively. As a control, the empty vector pMV261 was electroporated into both strains ΔkstR (pSEVAP5228) and ΔkstR (pSEVAPQ3) giving rise to strains ΔkstR (pSEVAP5228 and pMV261) and ΔkstR (pSEVAPQ3 and pMV261).
KstR Overexpression and Purification
The recombinant strain E. coli BL21 (DE3) carrying plasmid pET6042 (Table 1), constructed as previously described (20), was used to overexpress kstR. The recombinant strain was grown in LB containing kanamycin at 37 °C and 250 rpm until an A600 of 0.6. Then expression of kstR was induced by adding 200 μm isopropyl-1-thio-β-d-galactopyranoside, and the strain was grown for 3 h at 37 °C. Cells were harvested by centrifugation (15 min, 5000 × g, 4 °C) and stored frozen at −20 °C until used. The cell pellet from 1 liter of culture was thawed on ice and resuspended in 5 ml of buffer A (20 mm HEPES, pH 8.0, containing 0.5 m KCl) plus 1% Triton X-100 and disrupted by sonication using a Branson sonicator (four pulses of 1 min at 80% power, with 30 s of cooling on ice between each). Streptomycin sulfate (2%, w/v) was added to the protein extract and vortexed until complete dissolution to facilitate DNA precipitation. Cell debris was removed by ultracentrifugation at 50,000 × g for 45 min at 4 °C, and the soluble extract was loaded onto a HisTrap FF crude column (GE Healthcare) previously equilibrated with buffer B (buffer A plus 5 mm of imidazole). All purification steps were carried out at 4 °C. The column was washed with 100 ml of buffer B and 100 ml of buffer C (buffer A containing 50 mm of imidazole). Protein was eluted with 50 ml of buffer D (buffer A containing 150 mm of imidazole), and the column was washed with 50 ml of buffer A containing 500 mm of imidazole to ensure complete elution of the protein. The purity of the collected samples was analyzed by SDS-PAGE. The fractions containing KstR were concentrated to 10 mg ml−1 using AmiconUltra concentrating devices (Millipore). After concentration, imidazole was removed by dialysis against 20 mm HEPES, pH 8, 0.5 m KCl, 10 mm MgCl2, 2 mm β-mercaptoethanol using a 10,000 MVCO Slide-A-Lyzer dialysis cassette (Thermo) according to the manufacturer's specifications. The concentration of pure KstR was measured with a NanoPhotometer®Pearl (Implen, Munich, Germany) or an UV mini-1240 spectrophotometer (Shimadzu) by using the molar extinction coefficient at 280 nm (18,450 m−1 cm−1) calculated on the basis of its amino acid sequence using the ExPASy server. The purified protein was kept at 4 °C for immediate use or at −20 °C with glycerol 10% for longer periods of time.
Circular Dichroism Spectroscopy
CD measurements were carried out with a JASCO J-810 spectropolarimeter, equipped with a Peltier-type temperature controller and a thermostated cell holder and interfaced with a thermostatic bath. Far-UV spectra were recorded in 0.1-cm-path length quartz cells at a protein concentration of 3 μm in 20 mm potassium phosphate buffer containing 150 mm KCl. Five consecutive scans were accumulated, and the average spectra were stored. The data were corrected for the baseline contribution of the buffer. The observed ellipticities were converted into the mean residue ellipticities [θ] based on a mean molecular mass per residue of 110.5 Da. Thermal denaturation was performed by increasing the temperature from 20 to 80 °C at 20 °C/h, and ellipticities at 222 nm were measured in 0.1-cm-path length quartz cells at a protein concentration of 4 μm. Tm represents the temperature at the unfolding transition midpoint. The analysis of secondary structure composition of native proteins was performed using CDNN software with a reference data set of 33 proteins, as implemented in the program (35).
Analytical Ultracentrifugation
Sedimentation velocity experiments were carried out using an Optima XL-I analytical ultracentrifuge (Beckman-Coulter) equipped with UV-visible absorbance optics at 20 °C in an AnTi50 rotor and 12-mm double sector centerpieces. Experiments were performed using 1 mg ml−1 of KstR in 20 mm potassium phosphate buffer at pH 7.5 containing 150 mm KCl in the absence and in the presence of 250 μm of palmitic acid, 3OHChA, or 3OChA. The sedimentation coefficient distributions were calculated by least squares boundary modeling of sedimentation velocity data using the c(s) method, as implemented in the SEDFIT software (36, 37). Partial specific volume, v, for KstR samples without ligands was calculated at 0.7303 mg/ml based on the amino acid sequence and at 0.7305 mg/ml for the KstR-250 μm ligands as a sum of weight fractions of ν for protein (0.7334) and ν for ligand (0.9880) in solution (38). The value of ν for the ligands 3OHChA and 3OChA was assumed to be the same as cholesterol because of the high similarity of the molecules.
Dynamic Light Scattering
Dynamic light scattering experiments were performed with a DynaPro instrument (Protein Solutions Inc.). Measurements were taken at 25 °C. A solution of protein with a concentration of 0.25 mg ml−1 in 20 mm potassium phosphate buffer at pH 7.5 containing 150 mm KCl in the absence and in the presence of 250 μm of 3OHChA or 3OChA was used. The software provided by the manufacturer was used to calculate the diffusion coefficient of the protein.
Electromobility Shift Assays
Probe 5228FP was prepared as previously described (20). Probe PQ3, containing the chimeric PQ3 promoter, was prepared in the same way but using pJCD01-F and pJCD01-R (Table 1) as labeled and unlabeled oligonucleotides, respectively, and 10 ng of the plasmid pJCDPQ3 as a template. Varying amounts of purified KstR were incubated with 0.5 nm of labeled probes in binding buffer (20 mm Tris-HCl at pH 8, 150 mm KCl, 10 mm MgCl2, 10% glycerol, 2 mm β-mercaptoethanol, and 50 μg ml−1 BSA) in a final volume of 9 μl. For specific and nonspecific competition reaction mixtures, 40-, 400-, or 4000-fold excess of unlabeled probe and 0.5, 1, and 2 μg of unspecific DNA (salmon sperm) were added, respectively. To test the binding of KstR to DNA in the presence of the different inducers, the compounds were dissolved in methanol and were incubated with KstR for 10 min at room temperature before adding the DNA probe. The EMSA reaction mixtures were incubated for 20 min at room temperature and fractionated by electrophoresis on a 5% polyacrylamide gels buffered with 0.5× TBE (45 mm Tris borate, 1 mm EDTA). The gels were dried onto Whatman 3MM paper and exposed to Hyperfilm MP (Amersham Biosciences) using amplifying screens (Cronex DuPont Lightning Plus). Bands corresponding to free DNA probes and KstR-DNA complex were quantified using the program Multi Gauge V 3.0 (FUJIFILM). The apparent dissociation constants (Kd) for the binding of 5228FP DNA probe to KstR were estimated using data from EMSA titration experiments, where the amount of DNA was maintained constant, and the amount of protein was varied. The intensity of the bands served to estimate the percentage of 5228FP DNA probe shifted by the binding to KstR, and these data were plotted against the concentration of protein to calculate the apparent dissociation constant. Kd for the displacement of KstR from the 5228FP and PQ3 DNA probes was estimated using the intensity percentage of the nonshifted band in the presence of different concentrations of the putative inducers.
Run-off Transcription Assays
Multiple-round transcription by E. coli RNA polymerase (RNAP) was carried out under standard conditions (39), using buffer T (50 mm Tris-HCl at pH 7.5, 10 mm MgCl2, and 100 mm KCl) containing 1 mm DTT and 500 μg ml−1 BSA. The final volume of the reaction mixture was 20 μl, containing 1 nm supercoiled DNA plasmid pJCDPQ3 (or pJCD01 for control reactions) (Table 1), 0.5 μm KstR, 40 nm σ70-containing RNAP (USB), 1 mm ATP, 1 mm GTP, 1 mm CTP, 0.1 mm UTP (Roche), and 2.5 μCi of [α-32P]UTP (3000 Ci/mmol) (PerkinElmer Life Sciences). First, a reaction mixture containing KstR (8 μl) and DNA plasmid (5 μl) was incubated at 37 °C for 5 min. To test the effect of the inducers in the transcription reaction, they were dissolved in methanol and incubated with KstR for 10 min at room temperature before adding DNA. Elongation was started by the addition of 7 μl of prewarmed mixture containing cold nucleotides, [α-32P]UTP and RNAP in buffer T. The reactions were allowed to proceed for 5 min at 37 °C and were stopped by adding 10 μl of loading buffer (20 mm EDTA, pH 8, in 96% v/v formamide containing bromphenol blue and xylene cyanol blue). After heating samples to 70 °C, they were subjected to electrophoresis on denaturing 7 m urea, 4% polyacrylamide gels, buffered with 0.5× TBE at 300 V. Drying, exposition, and quantification were as described for EMSA experiments.
RNA Extraction
RNA for real time quantitative PCR was extracted from 15 ml of cultured M. smegmatis mc2155 growing in 1.8 mm cholesterol, 18 mm glycerol, or 3 mm palmitic acid as described previously (11). RNA was treated with the DNase I and removal treatment kit (Ambion) according to the manufacturer's instructions. RNA quantity was measured using a NanoPhotometer® Pearl (Implen).
Real Time Quantitative PCR
Reverse transcription was performed using the transcriptor first strand cDNA synthesis kit (Roche). Reactions were done in a volume of 20 μl containing 1 μg of purified RNA, 60 μm of random hexamer primer, 1 mm of dNTPs, and 10 units of reverse transcriptase. The template-primer mixture was first denaturated by heating for 10 min at 65 °C and immediately cooling on ice. The remaining components were added and then incubated 10 min at 25 °C followed by 30 min at 55 °C. Finally, the reverse transcriptase was inactivated by heating 5 min at 85 °C. Real time quantitative polymerase chain reactions for the analysis of the expression of single genes were performed using a LightCycler® 480 instrument (Roche). Reactions contained 5 μl of a 1:5 cDNA dilution, 0.25 μm of each primer (Table 1) and 10 μl of LightCycler® 480 SYBR Green I Master (Roche) in a total volume of 20 μl. The reactions were denatured at 95 °C for 5 min before cycling for 50 cycles of 95 °C for 10 s, 62 °C for 10 s, and 72 °C for 10 s. Each gene was measured in triplicate in three independent experiments. The relative amount of mRNA for each gene was determined using the mRNA levels of sigA (MSMEG_2758) as internal control (40).
RESULTS
KstR-Effector Interaction Analyzed by Thermal Denaturation
We assumed that the previous EMSA analyses to determine KstR interaction with its postulated inducers, i.e. cholesterol or cholestenone, did not render positive results because of the low solubility of these compounds and the presence of detergents interfering with the interactions (20). This assumption prompted us to study the KstR-effector interactions by CD to monitor the conformational changes produced by these interactions and effects on the thermal stability of the regulator in less complex conditions (i.e. in the absence of DNA) (35). In the absence of ligands, KstR showed a denaturation profile consistent with two states: folded and unfolded (Fig. 2A, black squares), and a Tm of 62.4 ± 0.1 °C (Table 2). The addition of 0.5 mm of cholesterol or cholestenone did not induce any significant changes in the thermal denaturation profile (Table 2), suggesting that these compounds do not interact with KstR, as previously reported (20).
FIGURE 2.

Interaction of KstR with palmitic acid, 3OHChA, and 3OChA induce a conformational change that destabilizes the protein. KstR thermal denaturation profiles were measured by circular dichroism in the presence of increasing concentrations of palmitic acid (A), 3OHChA (B), 3OChA (C), and 50 μm of sodium cholate, sodium deoxycholate, and palmitic acid (D).
TABLE 2.
Melting temperature (Tm) of KstR in the presence of different ligands measured by CD in thermal denaturation experiments
26OHCh was tested at 250 μm because it was not soluble in 1.5% of methanol.
| Compound | Tm | ΔTm |
|---|---|---|
| °C | °C | |
| No ligand | 62.4 ± 0.1 | |
| Palmitic acida | 41.0 ± 0.1 | 21.4 |
| Oleic acida | 48.5 ± 0.4 | 13.9 |
| 3OHChAa | 43.3 ± 0.4 | 19.1 |
| 3OChAa | 33.7 ± 0.5 | 28.7 |
| Cholesterolb | 63.3 ± 0.1 | −0.9 |
| Cholest-4-en-3-onab | 65.5 ± 0.1 | −3.1 |
| Palmitoyl alcoholb | 61.6 ± 0.1 | 0.8 |
| Oleyl alcoholb | 61.7 ± 0.0 | 0.7 |
| Octanoic acidb | 60.5 ± 0.3 | 1.9 |
| 1-Octanolb | 62.8 ± 0.1 | −0.4 |
| Decaneb | 63.7 ± 0.2 | −1.3 |
| 26OHCha | 63.7 ± 0.1 | −1.3 |
| ADb | 60.7 ± 0.1 | 1.7 |
| ADDb | 64.4 ± 0.1 | −2.0 |
a Tested at a concentration of 250 μm.
b Tested at a concentration of 500 μm.
In microarray assays, Schnappinger et al. (23) showed that palmitic acid induced the expression of several genes in the kstR regulon in M. tuberculosis, suggesting that perhaps this compound could be an effector of KstR. Surprisingly, when we tested the effect of palmitic acid on the thermal stability of KstR, we observed that higher concentrations of this compound resulted in lower KstR thermal stability, reaching a maximum of 41 °C at saturating concentrations (i.e. 250 μm) (Fig. 2A and Table 2). This reduced thermal stability clearly indicates drastic conformational changes, which occur upon binding of palmitic acid to KstR. This effect could only be reproduced with long chain fatty acids, like oleic acid (Table 2). The corresponding long chain alcohols, palmitoyl and oleyl alcohols, did not significantly affect the stability of KstR even at 500 μm. Neither did medium chain fatty acid nor its corresponding alcohols (octanoic acid and octanol) or alkanes (decane) (Table 2). These results indicated that only compounds with a long hydrophobic carbon chain and carboxylic moiety were able to induce the conformational changes that reduced the thermal stability of KstR.
To check whether the changes observed in the presence of palmitic acid might be due to detergent effects, we analyzed the influence of two typical detergents: cholic and deoxycholic acids (Fig. 2D). However, these molecules did not alter KstR stability, and therefore, the effect of palmitic acid cannot be ascribed to detergent effects.
We realized that two hydrophobic acid substances, 3OHChA and 3OChA (Fig. 1) that are produced in the initial steps of the cholesterol catabolic pathway (see Introduction) have structural similarities with palmitic acid, i.e. they have a carboxylic acid group at C26 and an aliphatic side chain at C17. When we tested both molecules by CD, they also induced a huge reduction in the Tm of KstR (43 and 34 °C, respectively, at a concentration of 250 μm) (Table 2). 3OHChA induced the same denaturation profile in KstR as palmitic acid, showing both states: folded and unfolded (Fig. 2B). However, the denaturation profile induced by 3OChA was very different, showing two denaturation states at lower concentrations (i.e. ≤50 μm) and a bimodal profile at higher concentrations (i.e. ≥100 μm) (Fig. 2C). The bimodal profile is consistent with the presence of at least three states (folded, intermediate, and unfolded). This bimodal behavior suggested that the conformational changes induced by the interaction of the ligand with the protein could affect both repressor domains (i.e. DNA- and effector-binding domains) differently and consequently relax the interactions between them and permit observation of two separate transitions, corresponding to two structurally independent domains. The clear effect of 3OHChA and 3OChA on the thermal stability of KstR suggested that they, or other related substances, could be inducers of the kstR regulon, rather than cholesterol or cholestenone, as postulated previously.
Therefore, we also checked whether KstR thermal stability was affected by other intermediate compounds of the catabolic pathway, such as 26OHCh, AD, and ADD (Fig. 1). Interestingly, 26OHCh is the first catabolic intermediate resulting from oxidation of the aliphatic side chain by the P450 cytochromes CYP125 and CYP142, whereas AD and ADD are central metabolites lacking the aliphatic side chain. None of these compounds showed any significant effect on the thermal stability of the regulator (Table 2). These results reinforced our hypothesis that the aliphatic side chain and the carboxylic group in the molecule are necessary to support the interaction of the effector with KstR.
To further analyze the effect of inducers in the KstR structure, we determined the far-UV CD spectra of KstR in both the absence and presence of palmitic acid, 3OHChA, and 3OChA (Fig. 3) and estimated its secondary structure content (Table 3). As expected, the spectrum of the free KstR (Fig. 3, black line) corresponds to a protein with a high α-helical content (63%), in reasonable agreement with the α-helical content of the crystallographic structure of M. tuberculosis KstR (84%, Protein Data Bank code 3MNL). The addition of palmitic acid (Fig. 3, red line), 3OHChA (Fig. 3, green line), and 3OChA (Fig. 3, blue line) at saturating concentrations (250 μm) showed a significant decrease in α-helical content of the protein by 50, 39, and 44%, respectively (Table 3). This reduction in α-helical content is consistent with the lower thermal stability of KstR observed on adding these compounds.
FIGURE 3.
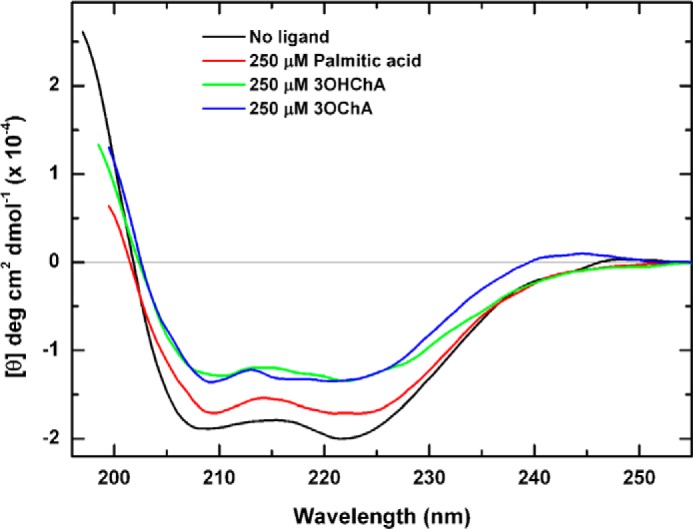
Effect of palmitic acid, 3OHChA, and 3OChA on the far-UV CD spectra of KstR. The addition of palmitic acid (red line), 3OHChA (green line), and 3OChA (blue line) induced a reduction in the amount of helical content of KstR (black line), as indicated by diminished intensity of the spectra in the presence of these compounds. The effect was greater with the addition of saturating concentrations of 3OChA or 3OHChA followed by a smaller effect for palmitic acid.
TABLE 3.
Estimation of the secondary structure content of KstR in the absence and in the presence of different ligands
| Secondary structure | No ligand | Palmitic acid | 3OHChA | 3OChA |
|---|---|---|---|---|
| α-Helix (%) | 63.4 | 50.2 | 39.6 | 44.4 |
| Antiparallel β-sheet (%) | 3.0 | 5.1 | 9.2 | 8.3 |
| Parallel β-sheet (%) | 5.1 | 5.2 | 5.8 | 5.9 |
| β-Turn (%) | 12.3 | 14.8 | 14.6 | 14.0 |
| Random coil (%) | 20.5 | 24.9 | 27.5 | 27.0 |
KstR Is Homodimeric in Solution
Many TetR-family regulators show a homodimeric arrangement (21). Given the major changes in secondary structure content of KstR induced upon binding of the putative effectors, we performed analytical ultracentrifugation and dynamic light scattering experiments to check whether, upon binding, these compounds were able to modify the homodimeric arrangement of free KstR observed in solution. The sedimentation velocity profiles (Fig. 4) and the calculated molecular mass obtained using the Svedberg equation with the values of the sedimentation and the diffusion coefficients (data not shown) showed that most of the KstR protein was present as a dimer in the solution, independent of the presence or absence of effectors. Curiously, a small fraction of KstR was present as a tetramer (∼ 14%), but the physiological relevance of this finding is uncertain given the high concentration of the purified protein in the assay.
FIGURE 4.

Sedimentation velocity profiles of KstR. The assay was performed in the absence (A) and presence of palmitic acid (B), 3OHChA (C), and 3OChA (D). The distribution pattern of concentration of the protein (c(s)) is represented in front of the sedimentation coefficient (S). The protein concentration used was 40 μm. There are no differences in the oligomerization state of KstR when ligands are present, and most of the protein was present as a dimer in solution.
3-β-Oxo-cholestenoic Acid Released KstR-DNA Interaction
To determine whether the putative inducers of KstR promoting thermal instability were able to release the KstR binding from its target DNA, we performed EMSA assays using the labeled 5228FP DNA probe containing the P5228 promoter (20). This interaction is specific because an excess of unlabeled 5228FP DNA probe abolishes its retardation, whereas unspecific DNA from salmon sperm did not (Fig. 5A). The apparent dissociation constant (Kd) of KstR for the 5228FP DNA probe (0.5 nm) deduced from EMSA experiments was 0.21 ± 0.07 μm (data not shown).
FIGURE 5.
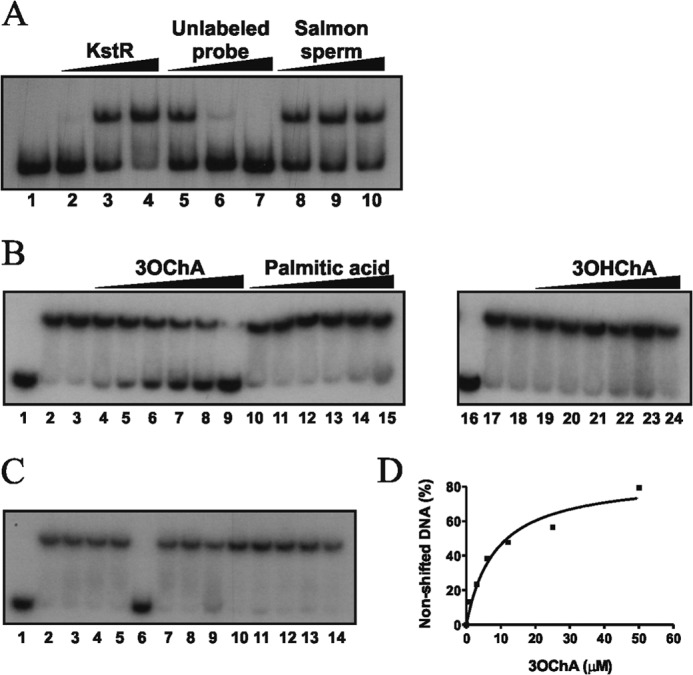
Inhibition of KstR-P5228 interaction by 3OChA. A, analysis by EMSA of KstR binding to the P5228 promoter. The 5228FP probe concentration was 0.5 nm. Purified KstR were used at 0 nm (lane 1), 100 nm (lane 2), 500 nm (lane 3), and 1 μm (lane 4). For lanes 5–10, the KstR concentration was 500 nm. Lanes 5–7 contained unlabeled 5228FP DNA probe (40-, 400-, and 4000-fold, respectively). Lanes 8–10 contained unrelated DNA from salmon sperm (0.5, 1.0, and 2.0 μg, respectively). B, analysis by EMSA of the KstR-5228FP DNA probe complex in the presence of 3OChA, palmitic acid, and 3OHChA. KstR concentration was 500 nm, except in lanes 1 and 16 (0 nm). 3OChA (lanes 4–9), palmitic acid (lanes 10–15), and 3OHChA (lanes 19–24) were added at 1, 3, 6, 12, 25, and 50 μm. KstR plus 5% of methanol (lane 3 and 18) was included as control. C, analysis by EMSA of the KstR-5228FP complex in the presence of related compounds at 250 μm: cholestenone (lane 4), cholesterol (lane 5), 3OChA (lane 6), 3OHChA (lane 7), ADD (lane 8), palmitic acid (lane 9), palmitoyl alcohol (lane 10), oleic acid (lane 11), oleyl alcohol (lane 12), 1-octanol (lane 13), and octanoic acid (lane 14). Controls without inducers (lane 2) and with 5% of methanol were included. KstR concentration was 500 nm except in lane 1 (0 nm). D, determination of the apparent Kd for KstR binding to the 5228FP probe in the presence of 3OChA. The apparent Kd is the 3OChA concentration at which 50% of the total DNA probe was bound to KstR. This value was determined from the experiment in B.
To check whether palmitic acid, 3OHChA, or 3OChA was able to release the KstR (500 nm) binding from its operator region, we used the 5228FP DNA probe (0.5 nm) in the EMSA assays. Fig. 5B shows that no significant decrease in affinity of KstR to the probe was observed in the presence of palmitic acid or 3OHChA, whereas KstR was clearly released from DNA in the presence of 3OChA at very low concentrations, i.e. from 3 to 50 μm with an estimated apparent Kd of 8.5 ± 2.2 μm (Fig. 5D). These results suggest that only 3OChA is able to induce the precise conformational change required to release the KstR-DNA interaction. However, when lower concentrations of KstR (250 nm) were used in the EMSA assays, interestingly, a release of the DNA probe was observed in the presence of high palmitic acid concentrations (1 mm), but not in the presence of 3OHChA (data not shown). The other compounds tested as putative effectors in CD experiments (Table 2) were also checked by gel retardation, but none of them released KstR from the 5228FP DNA probe (Fig. 5C).
In Vitro Activation of a Chimeric KstR-regulated Promoter by 3OChA
In vitro transcription experiments were performed to study the functionality of KstR as a transcriptional repressor and to analyze the induction effect of 3OChA, 3OHChA, and palmitic acid on the KstR-regulated promoters under conditions that could better mimic their physiological performances. It is noteworthy that previous experiments showed that the M. smegmatis P5228 promoter is hardly recognized in vitro by the E. coli RNAP (data not shown), and therefore, we designed a chimeric synthetic promoter PQ3 containing the −35 and −10 boxes of the lacUV5 promoter from E. coli and the consensus KstR operator sequence from M. smegmatis. Because the operator region of the P5228 promoter from M. smegmatis is located between the −10 and −35 boxes (20), we located the KstR operator recognition sequence in the same position of the chimeric PQ3 promoter (Fig. 6A).
To demonstrate that the PQ3 promoter is functional in M. smegmatis, the PQ3::lacZ translational fusion present in plasmid pUJ9PQ3 was cloned into the pSEVA651 vector (Table 1), which replicates in M. smegmatis, resulting in plasmid pSEVAPQ3. As expected, the deregulated M. smegmatis ΔkstR (pSEVAPQ3) transformants turned blue in X-Gal-containing medium, because of the expression of lacZ (Fig. 7). Moreover, when this recombinant strain was transformed with plasmid pMV6042, which expresses kstR, the resulting M. smegmatis ΔkstR (pSEVAPQ3 and pMV6042) cells turned white in X-Gal-containing medium, suggesting that KstR is able to repress the expression of PQ3::lacZ. Similar results were obtained using the lacZ fusion with the native promoter P5228 (Fig. 7).
FIGURE 7.
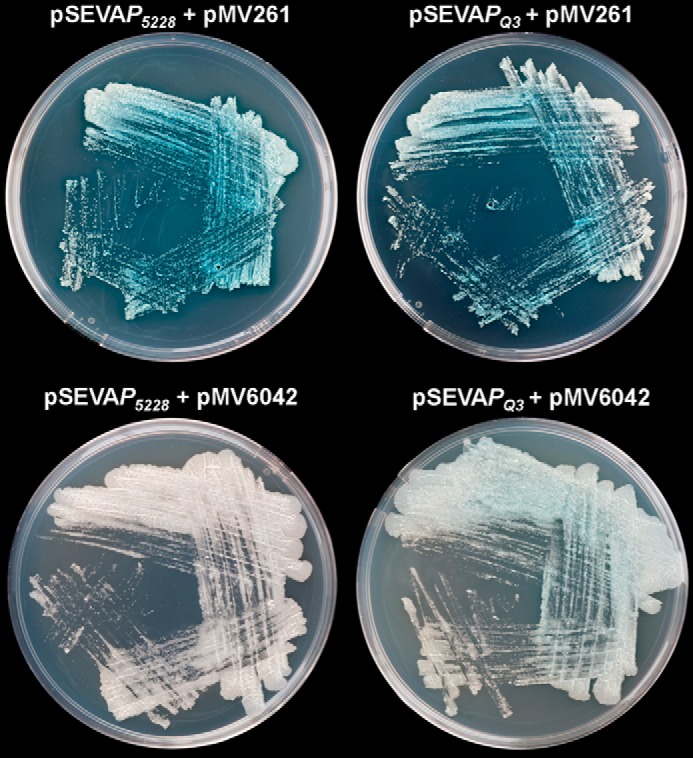
Top plates, β-galactosidase assays in M. smegmatis ΔkstR strains harboring the P5228::lacZ (top left plate) and PQ3::lacZ (top right plate) translational fusions. Bottom plates, repression of the transcription of the lacZ gene in the presence of KstR (pMV6042) in strains M. smegmatis ΔkstR (pSEVAP5228) (bottom left plate) and M. smegmatis ΔkstR (pSEVAPQ3) (bottom right plate).
To determine in vitro viability of the synthetic promoter, first we checked whether KstR was able to recognize the PQ3 promoter by EMSA assays, using the labeled PQ3 DNA probe containing this promoter. Fig. 6B shows that, as expected, KstR is able to bind to the PQ3 DNA probe in a protein concentration-dependent manner. Furthermore, the interaction is specific because an excess of unlabeled PQ3 DNA probe abolished its retardation, whereas the unrelated DNA from salmon sperm did not. Fig. 6C shows that, as described above for 5228FP DNA probe, KstR was also released from the PQ3 DNA probe in the presence of a low concentration of 3OChA. Remarkably, the effect of palmitic acid was greater for the PQ3 DNA probe than for the 5228FP DNA probe. Nonetheless, higher concentrations of palmitic acid than 3OChA are required to fully release KstR (Fig. 6C). The apparent Kd values estimated for 3OChA and palmitic acid were 7.3 ± 2.4 and 226 ± 26 μm, respectively, using the PQ3 DNA probe (0.5 nm) and KstR (500 nm) (Fig. 6E). The finding that 3OChA and palmitic acid released the KstR-PQ3 interaction more efficiently than the KstR-P5228 could simply be a consequence of a less effective interaction between KstR and the artificial PQ3 promoter. As described above for the 5228FP DNA probe, 3OHChA was unable to release KstR from the PQ3 DNA probe, suggesting that this compound is not an effector (Fig. 6D).
These results indicated the possible analysis of the effect of KstR and the putative inducer molecules on transcription initiation in the chimeric E. coli-M. smegmatis PQ3 promoter by multiple-round in vitro transcription using E. coli RNA polymerase. For these experiments, the PQ3 promoter was cloned into pJCD01 plasmid to yield pJCDPQ3 (Table 1). As expected, when this plasmid was used as a template, a 152-nucleotide transcript was observed because of the PQ3 promoter activity (Fig. 8, A, lanes 2 and 3, and B, lane 2), whereas the empty control plasmid pJCD01 only rendered the RNAI control transcript (108 nucleotides) (Fig. 8, A, lane 1, and B, lane 1).
FIGURE 8.

3OChA induces transcription from KstR-repressed promoters in vitro. Multiple-round in vitro transcription was performed in the presence of 40 nm of RNAP and 500 nm of KstR. + and − indicate the presence and absence, respectively, of KstR and methanol in each reaction. PQ3-derived mRNA (152 nucleotides) and the vector-derived mRNA control (RNAI, 108–109 nucleotides) are indicated. A, multiple-round in vitro transcription in the presence of increasing concentrations of 3OChA. Reactions were carried out with the plasmid pJCD01 as a control (lane 1) and plasmid pJCDPQ3 containing the PQ3 promoter (lanes 2–11). 3OChA was added at 1, 3, 6, 12, 25, and 50 μm (lanes 6–11). B, multiple-round in vitro transcription in the presence of 250 μm of cholesterol, cholestenone, 3OHChA, 3OChA, and palmitic acid (lanes 5–9). Reactions were performed with the plasmid pJCD01 (lane 1) and pJCDPQ3 (lanes 2–9). The picture is a representative example of four experiments. C, PQ3 transcription levels from pJCDPQ3 in the presence of KstR and inducers. The intensity of the bands observed in the in vitro transcription experiments (Fig. 8B) was used to calculated the transcription percentages, taking into account the intensity of the band in the absence of KstR (Fig. 8B, lane 2) as 100% of the transcription. Bars represent averages of four independent experiments, and errors bars indicate ± S.D. OL, cholesterol; ONE, cholestenone; PA, palmitic acid.
KstR addition to the reaction mixture repressed PQ3 activity (Fig. 8A, lanes 4 and 5, and B, lanes 3 and 4), demonstrating that KstR can repress the chimeric PQ3 promot2er in vitro. Increasing concentrations of 3OChA (1–50 μm) (Fig. 8A, lanes 6–11) restored the transcription level of the PQ3 promoter. However, the addition of palmitic acid, even at high concentrations (250 μm) did not cause such derepression (Fig. 8, B, lane 9, and C). The same negative result was observed in the presence of cholesterol, cholestenone, and 3OHChA (Fig. 8, B, lanes 5–7, and C). These results demonstrate that 3OChA was the only compound able to activate the KstR mediated repression at the PQ3 promoter (Fig. 8B, lane 8).
To further discard the palmitic acid as effector of the KstR protein, we analyzed the expression of several genes included in the KstR regulon that are up-regulated in the presence of cholesterol by quantitative real time-PCR experiments. As is shown in Fig. 9, we selected some genes involved in the cholesterol side chain degradation, cyp125A3 (MSMEG_5995) and fadA5 (MSMEG_5996), and also genes implicated in the first steps of the sterol ring catabolism, kstD (MSMEG_5941) and kshA (MSMEG_5925). All the genes tested were induced in the presence of cholesterol but not in the presence of palmitic acid. These results confirm the in vitro transcription results in which the palmitic acid is not able to activate repression mediated by KstR.
FIGURE 9.
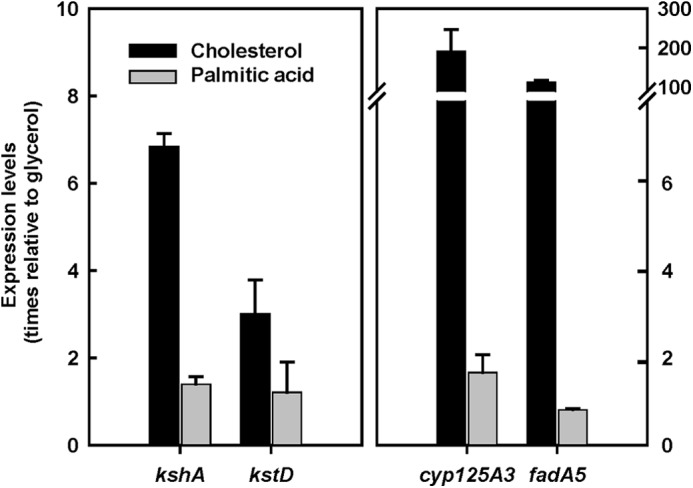
Effect of cholesterol and palmitic acid on the expression levels of kshA (MSMEG_5925), kstD (MSMEG_5941), cyp125A3 (MSMEG_5995), and fadA5 (MSMEG_5996) in M. smegmatis. The data represent the fold change relative to expression in glycerol. The error bars represent standard deviation calculated from the results of three independent experiments.
DISCUSSION
Bacterial catabolism of cholesterol, and other related steroid compounds, has acquired greater relevance in recent years, not only because of their importance as environmental pollutants (41, 42) but because of the fundamental role cholesterol plays in M. tuberculosis infections (22, 23, 26, 43, 44). Expression of the genes constituting the cholesterol catabolic pathway is controlled by two proteins: KstR and KstR2 (2, 3, 19). Previous studies have failed to identify the inducer of the pathway, but it was putatively ascribed to cholesterol or cholestenone (2, 3, 19). To date, all in vitro experiments attempting to show that these substances could interact with KstR to trigger the pathway have failed (20). Moreover, attempts to demonstrate the implication of these compounds in the induction of KstR, by constructing M. smegmatis mutants blocked in the first steps of the pathway, were unsuccessful because of the high redundancy of the enzymes involved in these processes (11, 18).
Here, the thermal denaturation analyses with palmitic acid constitute the first experimental evidence that KstR can selectively interact with large hydrophobic carboxylic acids. This led to the exploration of other carboxylic compounds as putative effectors, such as 3OHChA and 3OChA, which are the first intermediates of the cholesterol catabolic pathway. CD showed that the binding of these molecules caused a conformational change in KstR, drastically reducing its thermal stability. Such structural destabilization can most likely be ascribed to a decrease in the α-helix content, as confirmed by comparing the far-UV CD spectra of KstR with and without these compounds (Fig. 3). Conformational changes in the secondary structure caused by the binding of an effector have been described for other regulators, either repressors or activators. Interestingly, in most cases the effectors increased the stability of the protein (45–47), in contrast with the huge decrease in KstR stability. In this respect, most ligands stabilize proteins upon binding, thereby increasing their melting temperature; however, some ligands destabilize proteins by binding primarily to the unfolded state of the protein and destabilizing it (i.e. reducing protein melting temperature) (48). Ligands that stabilize proteins may be called N-binders (N-ligands, upshifters), and ligands that destabilize proteins may be called U-binders (U-ligands, downshifters) (48). Mathematical models that quantitatively describe protein destabilization by ligands consider ligand binding not only to the native state but also to the unfolded state of the protein. Consequently, the KstR ligands (i.e. palmitic, 3OHChA, and 3OChA acids) can be classified as U-binders and appear to stabilize the unfolded state.
The interaction between KstR and 3OChA appears to differ from that observed with palmitic acid or 3OHChA, as reflected by the atypical bimodal denaturation curve observed by CD. This result suggests that 3OChA induces a more complex effect on the KstR structure than the other compounds. Such a specific effect might be critical to release the regulator from the operator region of a KstR-dependent promoter. To test this hypothesis, we used EMSA to analyze the effect of these compounds on a system that facilitates the analysis of the triple interaction: effector-KstR-DNA. As expected, 3OChA was the only compound able to release the binding of KstR to the DNA probe at low concentrations, behaving as an inducer molecule of KstR. However, palmitic acid required higher concentrations to release KstR to the DNA, and 3OHChA did not have any effect, even at very high concentrations, at least under the in vitro test conditions.
The peculiar and specific bimodal denaturation curve observed by CD in the presence of 3OChA suggests that the structural changes induced in KstR by 3OChA differ greatly from those caused by the other acidic compounds, indicating conformational changes in both domains of the protein, i.e. DNA- and effector-binding domains. We propose that palmitic acid, oleic acid, and 3OHChA bind to KstR because of their structural homology with 3OChA, but they are unable to activate the cholesterol metabolism because they might not induce the specific conformational change in the DNA-binding domain of KstR required to release the KstR-DNA complex. Thus, we performed quantitative real time-PCR experiments, which demonstrated that several genes included in the kstR regulon and up-regulated in the presence of cholesterol (kstD, kshA, cyp125, and fadA5) were not induced in presence of palmitic acid in M. smegmatis. Nevertheless, we cannot completely rule out the possibility that these compounds, and particularly palmitic acid and other large hydrophobic acids (e.g. mycolic acids), might play a role in the expression of the kstR regulon by competing with 3OChA to reach the effector-binding site of free KstR.
Research has amply demonstrated the redundancy of enzymes involved in the first two steps of cholesterol catabolism (i.e. 3-β-hydroxysteroid dehydrogenases/isomerases and P450 cytochromes) in mycobacteria, and strains presenting deletions in these genes still retain their ability to grow on cholesterol using alternative enzymes (11, 15, 17, 18, 49). This redundancy, together with the detection of constitutive basal expression levels of these genes in the absence of cholesterol (18, 20, 22), ensures rapid production of the inducer, 3OChA, followed by complete transcription of the kstR regulon. In fact, the intermediate 3OChA can be detected by HPLC/MS when M. smegmatis is growing on cholesterol or 4-cholesten-3-one (18).
After complete oxidation of C26 to the corresponding carboxylic acid, the cholesterol side chain is shortened by a process similar to β-oxidation of fatty acids (22, 50, 51). This process is initiated by a steroid CoA ligase, which catalyzes the CoA activation of the C26 carboxylic acid intermediates (51, 52). Therefore, we cannot rule of the possibility that the corresponding CoA derivative of 3OChA, and even derivatives of 3OHChA (Fig. 1), could also be inducers of the KstR regulon. However, because these compounds are not commercially available, we could not test them as putative inducers. Moreover, a recent study suggests that side chain and ring degradation of cholesterol could occur simultaneously in M. tuberculosis (53); therefore, other ring- and side chain-degraded intermediates of the pathway might be alternative inducers.
Although other alternative inducers may exist, our results demonstrate, for the first time, that 3OChA (an intermediate of the cholesterol side chain degradation) acts as an inducer molecule of the KstR repressor, allowing the expression of genes in the kstR regulon. We do not fully understand why some regulatory systems select an intermediate metabolite as inducer rather than the initial substrate of the pathway. We could speculate that mycobacterial cells have selected 3OChA as inducer of the kstR regulon, instead of cholesterol, because 3OChA is more soluble than cholesterol. Solubility should facilitate its cytoplasmic diffusion, reaching the multiple KstR-regulated promoters distributed in different clusters all around the chromosome. It is worth mentioning that the bacterial regulators CmeR and BreR recognize soluble bile acids as effectors (27, 28).
In summary, our findings provide new insights into the transcriptional regulation mechanisms involved in the cholesterol catabolic pathway in mycobacteria. This is of great relevance given the critical role of cholesterol degradation in the survival of M. tuberculosis. The data presented here may represent the first step to developing new drugs aimed at disrupting the regulation of cholesterol catabolism and help to fight the infection caused by this pathogen.
Acknowledgments
We thank members of the Analytical Ultracentrifugation Facility of the Centro de Investigaciones Biológicas (Madrid, Spain): Jorge Martínez, Juan Román Luque, and Carlos Alfonso, for assistance with ultracentrifugation experiments. The technical work of Ana Valencia is greatly appreciated. We thank Fabiola Barraclough (Interglobe Languages Links) for kindly reviewing the manuscript.
This work was supported by Spanish Ministry of Economy and Competitiveness Grants BFU2009-11545-CO3-03, BFU2012-39695-CO2-01, BFU2011-24615, and CSD2009-00088.
- 3OHChA
- 3-β-hydroxy-5-cholestenoic acid
- 3OChA
- 3-oxo-4-cholestenoic acid
- AD
- 4-androstene-3,17-dione
- ADD
- 1,4-androstadiene-3,17-dione
- RNAP
- RNA polymerase
- 26OHCh
- choles-5-ene-3β,26-diol.
REFERENCES
- 1. Klepp L. I., Forrellad M. A., Osella A. V., Blanco F. C., Stella E. J., Bianco M. V., Santangelo M. L., Sassetti C., Jackson M., Cataldi A. A., Bigi F., Morbidoni H. R. (2012) Impact of the deletion of the six mce operons in Mycobacterium smegmatis. Microbes Infect. 14, 590–599 [DOI] [PMC free article] [PubMed] [Google Scholar]
- 2. Kendall S. L., Withers M., Soffair C. N., Moreland N. J., Gurcha S., Sidders B., Frita R., Ten Bokum A., Besra G. S., Lott J. S., Stoker N. G. (2007) A highly conserved transcriptional repressor controls a large regulon involved in lipid degradation in Mycobacterium smegmatis and Mycobacterium tuberculosis. Mol. Microbiol. 65, 684–699 [DOI] [PMC free article] [PubMed] [Google Scholar]
- 3. Kendall S. L., Burgess P., Balhana R., Withers M., Ten Bokum A., Lott J. S., Gao C., Uhia-Castro I., Stoker N. G. (2010) Cholesterol utilization in mycobacteria is controlled by two TetR-type transcriptional regulators: KstR and KstR2. Microbiology. 156, 1362–1371 [DOI] [PMC free article] [PubMed] [Google Scholar]
- 4. Griffin J. E., Gawronski J. D., Dejesus M. A., Ioerger T. R., Akerley B. J., Sassetti C. M. (2011) High-resolution phenotypic profiling defines genes essential for mycobacterial growth and cholesterol catabolism. PLoS Pathog. 7, e1002251. [DOI] [PMC free article] [PubMed] [Google Scholar]
- 5. Capyk J. K., Kalscheuer R., Stewart G. R., Liu J., Kwon H., Zhao R., Okamoto S., Jacobs W. R., Jr., Eltis L. D., Mohn W. W. (2009) Mycobacterial cytochrome P450 125 (Cyp125) catalyzes the terminal hydroxylation of C27 Steroids. J. Biol. Chem. 284, 35534–35542 [DOI] [PMC free article] [PubMed] [Google Scholar]
- 6. Lack N. A., Yam K. C., Lowe E. D., Horsman G. P., Owen R. L., Sim E., Eltis L. D. (2010) Characterization of a carbon-carbon hydrolase from Mycobacterium tuberculosis involved in cholesterol metabolism. J. Biol. Chem. 285, 434–443 [DOI] [PMC free article] [PubMed] [Google Scholar]
- 7. Yam K. C., D'Angelo I., Kalscheuer R., Zhu H., Wang J.-X., Snieckus V., Ly L. H., Converse P. J., Jacobs W. R., Jr., Strynadka N., Eltis L. D. (2009) Studies of a ring-cleaving dioxygenase illuminate the role of cholesterol metabolism in the pathogenesis of Mycobacterium tuberculosis. PLoS Pathog. 5, e1000344. [DOI] [PMC free article] [PubMed] [Google Scholar]
- 8. Oppermann U., Filling C., Hult M., Shafqat N., Wu X., Lindh M., Shafqat J., Nordling E., Kallberg Y., Persson B., Jörnvall H. (2003) Short-chain dehydrogenases/reductases (SDR): the 2002 update. Chem. Biol. Interact. 143–144, 247–253 [DOI] [PubMed] [Google Scholar]
- 9. Yang X., Dubnau E., Smith I., Sampson N. S. (2007) Rv1106c from Mycobacterium tuberculosis is a 3β-hydroxysteroid dehydrogenase. Biochemistry 46, 9058–9067 [DOI] [PMC free article] [PubMed] [Google Scholar]
- 10. Vrielink A. (2010) Cholesterol binding and cholesterol transport proteins. Subcell. Biochem. 51, 137–15820213543 [Google Scholar]
- 11. Uhía I., Galán B., Morales V., García J. L. (2011) Initial step in the catabolism of cholesterol by Mycobacterium smegmatis mc2155. Environ. Microbiol. 13, 943–959 [DOI] [PubMed] [Google Scholar]
- 12. Fernández de Las Heras L., Mascaraque V., García Fernández E., Navarro-Llorens J. M., Perera J., Drzyzga O. (2011) ChoG is the main inducible extracellular cholesterol oxidase of Rhodococcus sp. strain CECT3014. Microbiol. Res. 166, 403–418 [DOI] [PubMed] [Google Scholar]
- 13. Dermer J., Fuchs G. (2012) Molybdoenzyme that catalyzes the anaerobic hydroxylation of a tertiary carbon atom in the side chain of cholesterol. J. Biol. Chem. 287, 36905–36916 [DOI] [PMC free article] [PubMed] [Google Scholar]
- 14. García J. L., Uhía I., Galán B. (2012) Catabolism and biotechnological applications of cholesterol degrading bacteria. Microb. Biotechnol. 5, 679–699 [DOI] [PMC free article] [PubMed] [Google Scholar]
- 15. Driscoll M. D., McLean K. J., Levy C., Mast N., Pikuleva I. A., Lafite P., Rigby S. E., Leys D., Munro A. W. (2010) Structural and biochemical characterization of Mycobacterium tuberculosis CYP142: evidence for multiple cholesterol 27-hydroxylase activities in a human pathogen. J. Biol. Chem. 285, 38270–38282 [DOI] [PMC free article] [PubMed] [Google Scholar]
- 16. Ouellet H., Guan S., Johnston J. B., Chow E. D., Kells P. M., Burlingame A. L., Cox J. S., Podust L. M., de Montellano P. R. (2010) Mycobacterium tuberculosis CYP125A1, a steroid C27 monooxygenase that detoxifies intracellularly generated cholest-4-en-3-one. Mol. Microbiol. 77, 730–742 [DOI] [PMC free article] [PubMed] [Google Scholar]
- 17. Johnston J. B., Ouellet H., Ortiz de Montellano P. R. (2010) Functional redundancy of steroid C26-monooxygenase activity in Mycobacterium tuberculosis revealed by biochemical and genetic analyses. J. Biol. Chem. 285, 36352–36360 [DOI] [PMC free article] [PubMed] [Google Scholar]
- 18. García-Fernández E., Frank D. J., Galán B., Kells P. M., Podust L. M., García J. L., Ortiz de Montellano P. R. (2013) A highly conserved mycobacterial cholesterol catabolic pathway. Environ. Microbiol. 15, 2342–2359 [DOI] [PMC free article] [PubMed] [Google Scholar]
- 19. Uhía I., Galán B., Kendall S. L., Stoker N. G., García J. L. (2012) Cholesterol metabolism in Mycobacterium smegmatis. Environ. Microbiol. Rep. 4, 168–182 [DOI] [PubMed] [Google Scholar]
- 20. Uhía I., Galán B., Medrano F. J., García J. L. (2011) Characterization of the KstR-dependent promoter of the gene for the first step of the cholesterol degradative pathway in Mycobacterium smegmatis. Microbiology 157, 2670–2680 [DOI] [PubMed] [Google Scholar]
- 21. Ramos J. L., Martínez-Bueno M., Molina-Henares A. J., Terán W., Watanabe K., Zhang X., Gallegos M. T., Brennan R., Tobes R. (2005) The TetR family of transcriptional repressors. Microbiol. Mol. Biol. Rev. 69, 326–356 [DOI] [PMC free article] [PubMed] [Google Scholar]
- 22. Nesbitt N. M., Yang X., Fontán P., Kolesnikova I., Smith I., Sampson N. S., Dubnau E. (2010) A Thiolase of Mycobacterium tuberculosis is required for virulence and production of androstenedione and androstadienedione from cholesterol. Infect. Immun. 78, 275–282 [DOI] [PMC free article] [PubMed] [Google Scholar]
- 23. Schnappinger D., Ehrt S., Voskuil M. I., Liu Y., Mangan J. A., Monahan I. M., Dolganov G., Efron B., Butcher P. D., Nathan C., Schoolnik G. K. (2003) Transcriptional adaptation of Mycobacterium tuberculosis within macrophages: insights into the phagosomal environment. J. Exp. Med. 198, 693–704 [DOI] [PMC free article] [PubMed] [Google Scholar]
- 24. Chang J. C., Harik N. S., Liao R. P., Sherman D. R. (2007) Identification of mycobacterial genes that alter growth and pathology in macrophages and in mice. J. Infect. Dis. 196, 788–795 [DOI] [PubMed] [Google Scholar]
- 25. Ouellet H., Johnston J. B., de Montellano P. R. (2011) Cholesterol catabolism as a therapeutic target in Mycobacterium tuberculosis. Trends Microbiol. 19, 530–539 [DOI] [PMC free article] [PubMed] [Google Scholar]
- 26. Rengarajan J., Bloom B. R., Rubin E. J. (2005) Genome-wide requirements for Mycobacterium tuberculosis adaptation and survival in macrophages. Proc. Natl. Acad. Sci. U.S.A. 102, 8327–8332 [DOI] [PMC free article] [PubMed] [Google Scholar]
- 27. Cerda-Maira F. A., Ringelberg C. S., Taylor R. K. (2008) The bile response repressor BreR regulates expression of the Vibrio cholerae breAB efflux system operon. J. Bacteriol. 190, 7441–7452 [DOI] [PMC free article] [PubMed] [Google Scholar]
- 28. Lin J., Akiba M., Sahin O., Zhang Q. (2005) CmeR functions as a transcriptional repressor for the multidrug efflux pump CmeABC in Campylobacter jejuni. Antimicrob. Agents Chemother. 49, 1067–1075 [DOI] [PMC free article] [PubMed] [Google Scholar]
- 29. Lei H.-T., Shen Z., Surana P., Routh M. D., Su C.-C., Zhang Q., Yu E. W. (2011) crystal structures of CmeR-bile acid complexes from Campylobacter jejuni. Protein Sci. 20, 712–723 [DOI] [PMC free article] [PubMed] [Google Scholar]
- 30. Xiong G., Martin H.-J., Maser E. (2003) Characterization and recombinant expression of the translational repressor RepB of 3α-hydroxysteroid dehydrogenase/carbonyl reductase in Comamonas testosteroni. Chem. Biol. Interact. 143–144, 425–433 [DOI] [PubMed] [Google Scholar]
- 31. Sambrook J., Russell D. W. (2001) Molecular Cloning: A Laboratory Manual, 3rd Ed., Cold Spring Harbor Laboratory, Cold Spring Harbor, NY [Google Scholar]
- 32. Siebenlist U., Simpson R. B., Gilbert W. (1980) E. coli RNA polymerase interacts homologously with two different promoters. Cell 20, 269–281 [DOI] [PubMed] [Google Scholar]
- 33. Silva-Rocha R., Martínez-García E., Calles B., Chavarría M., Arce-Rodríguez A., de Las Heras A., Páez-Espino A. D., Durante-Rodríguez G., Kim J., Nikel P. I., Platero R., de Lorenzo V. (2013) The Standard European Vector Architecture (SEVA): a coherent platform for the analysis and deployment of complex prokaryotic phenotypes. Nucleic Acids Res. 41, D666–D675 [DOI] [PMC free article] [PubMed] [Google Scholar]
- 34. Stover C. K., de la Cruz V. F., Fuerst T. R., Burlein J. E., Benson L. A., Bennett L. T., Bansal G. P., Young J. F., Lee M. H., Hatfull G. F. (1991) New use of BCG for recombinant vaccines. Nature 351, 456–460 [DOI] [PubMed] [Google Scholar]
- 35. Böhm G., Muhr R., Jaenicke R. (1992) Quantitative analysis of protein far UV circular dichroism spectra by neural networks. Protein Eng. 5, 191–195 [DOI] [PubMed] [Google Scholar]
- 36. Dam J., Schuck P. (2005) Sedimentation velocity analysis of heterogeneous protein-protein interactions: sedimentation coefficient distributions c(s) and asymptotic boundary profiles from Gilbert-Jenkins theory. Biophys. J. 89, 651–666 [DOI] [PMC free article] [PubMed] [Google Scholar]
- 37. Schuck P. (2000) Size-distribution analysis of macromolecules by sedimentation velocity ultracentrifugation and lamm equation modeling. Biophys. J. 78, 1606–1619 [DOI] [PMC free article] [PubMed] [Google Scholar]
- 38. Reynolds J. A., McCaslin D. R. (1985) Determination of protein molecular weight in complexes with detergent without knowledge of binding. Methods Enzymol. 117, 41–53 [DOI] [PubMed] [Google Scholar]
- 39. Marschall C., Labrousse V., Kreimer M., Weichart D., Kolb A., Hengge-Aronis R. (1998) Molecular analysis of the regulation of csiD, a carbon starvation-inducible gene in Escherichia coli that is exclusively dependent on σS and requires activation by cAMP-CRP. J. Mol. Biol. 276, 339–353 [DOI] [PubMed] [Google Scholar]
- 40. Gomez M., Smith I. (2000) Determinants of mycobacterial gene expression. In Molecular Genetics of Mycobacteria (Hatfull G. F., Jacobs W. R., eds) pp. 111–129, American Society for Microbiology Press, Washington, D. C. [Google Scholar]
- 41. Veiga P., Juste C., Lepercq P., Saunier K., Béguet F., Gérard P. (2005) Correlation between faecal microbial community structure and cholesterol-to-coprostanol conversion in the human gut. FEMS Microbiol. Lett. 242, 81–86 [DOI] [PubMed] [Google Scholar]
- 42. Gagné F., Blaise C., André C. (2006) Occurrence of pharmaceutical products in a municipal effluent and toxicity to rainbow trout (Oncorhynchus mykiss) hepatocytes. Ecotoxicol. Environ. Saf. 64, 329–336 [DOI] [PubMed] [Google Scholar]
- 43. Pandey A. K., Sassetti C. M. (2008) Mycobacterial persistence requires the utilization of host cholesterol. Proc. Natl. Acad. Sci. 105, 4376–4380 [DOI] [PMC free article] [PubMed] [Google Scholar]
- 44. Chang J. C., Miner M. D., Pandey A. K., Gill W. P., Harik N. S., Sassetti C. M., Sherman D. R. (2009) igr genes and Mycobacterium tuberculosis cholesterol metabolism. J. Bacteriol. 191, 5232–5239 [DOI] [PMC free article] [PubMed] [Google Scholar]
- 45. Manso I., Torres B., Andreu J. M., Menéndez M., Rivas G., Alfonso C., Díaz E., García J. L., Galán B. (2009) 3-Hydroxyphenylpropionate and phenylpropionate are synergistic activators of the MhpR transcriptional regulator from Escherichia coli. J. Biol. Chem. 284, 21218–21228 [DOI] [PMC free article] [PubMed] [Google Scholar]
- 46. Tahlan K., Yu Z., Xu Y., Davidson A. R., Nodwell J. R. (2008) Ligand recognition by ActR, a TetR-like regulator of actinorhodin export. J. Mol. Biol. 383, 753–761 [DOI] [PubMed] [Google Scholar]
- 47. Carette X., Blondiaux N., Willery E., Hoos S., Lecat-Guillet N., Lens Z., Wohlkönig A., Wintjens R., Soror S. H., Frénois F., Dirié B., Villeret V., England P., Lippens G., Deprez B., Locht C., Willand N., Baulard A. R. (2012) Structural activation of the transcriptional repressor EthR from Mycobacterium tuberculosis by single amino acid change mimicking natural and synthetic ligands. Nucleic Acids Res. 40, 3018–3030 [DOI] [PMC free article] [PubMed] [Google Scholar]
- 48. Cimmperman P., Baranauskiene L., Jachimoviciūte S., Jachno J., Torresan J., Michailoviene V., Matuliene J., Sereikaite J., Bumelis V., Matulis D. (2008) A quantitative model of thermal stabilization and destabilization of proteins by ligands. Biophys. J. 95, 3222–3231 [DOI] [PMC free article] [PubMed] [Google Scholar]
- 49. Brzostek A., Rumijowska-Galewicz A., Dziadek B., Wojcik E. A., Dziadek J. (2013) ChoD and HsdD can be dispensable for cholesterol degradation in mycobacteria. J. Steroid Biochem. Mol. Biol. 134, 1–7 [DOI] [PubMed] [Google Scholar]
- 50. Wilbrink M. H., Petrusma M., Dijkhuizen L., van der Geize R. (2011) FadD19 of Rhodococcus rhodochrous DSM43269, a steroid-coenzyme A ligase essential for degradation of C-24 branched sterol side chains. Appl. Environ. Microbiol. 77, 4455–4464 [DOI] [PMC free article] [PubMed] [Google Scholar]
- 51. Sih C. J., Tai H. H., Tsong Y. Y. (1967) The mechanism of microbial conversion of cholesterol into 17-keto steroids. J. Am. Chem. Soc. 89, 1957–1958 [DOI] [PubMed] [Google Scholar]
- 52. Sih C. J., Tai H.-H., Tsong Y. Y., Lee S. S., Coombe R. G. (1968) Mechanisms of steroid oxidation by microorganism. XIV. Pathway of cholesterol side-chain degradation. Biochemistry 7, 808–818 [DOI] [PubMed] [Google Scholar]
- 53. Capyk J. K., Casabon I., Gruninger R., Strynadka N. C., Eltis L. D. (2011) Activity of 3-Ketosteroid 9α-Hydroxylase (KshAB) indicates cholesterol side chain and ring degradation occur simultaneously in Mycobacterium tuberculosis. J. Biol. Chem. 286, 40717–40724 [DOI] [PMC free article] [PubMed] [Google Scholar]
- 54. Snapper S. B., Melton R. E., Mustafa S., Kieser T., Jacobs W. R., Jr. (1990) Isolation and characterization of efficient plasmid transformation mutants of Mycobacterium smegmatis. Mol. Microbiol. 4, 1911–1919 [DOI] [PubMed] [Google Scholar]
- 55. de Lorenzo V., Herrero M., Jakubzik U., Timmis K. N. (1990) Mini-Tn5 transposon derivatives for insertion mutagenesis, promoter probing, and chromosomal insertion of cloned DNA in gram-negative eubacteria. J. Bacteriol. 172, 6568–6572 [DOI] [PMC free article] [PubMed] [Google Scholar]