Background: The scaffolding protein caveolin-1 coordinates membrane signaling clusters, but how this affects Ca2+ oscillations is unknown.
Results: Caveolin-1 accelerates the rundown of Ca2+ oscillations to the agonist leukotriene C4, which is prevented by modest inhibition of protein kinase C.
Conclusion: Caveolin-1 increases receptor desensitization through Ca2+-dependent stimulation of protein kinase C.
Significance: The findings reveal how caveolin-1 regulates receptor-dependent Ca2+ signaling.
Keywords: Calcium Signaling, Caveolin, G Protein-coupled Receptor (GPCR), Gene Transcription, Receptor Desensitization
Abstract
Cytoplasmic Ca2+ oscillations constitute a widespread signaling mode and are often generated in response to stimulation of G protein-coupled receptors that activate phospholipase C. In mast cells, repetitive Ca2+ oscillations can be evoked by modest activation of cysteinyl leukotriene type I receptors by the physiological trigger, leukotriene C4. The Ca2+ oscillations arise from regenerative Ca2+ release from inositol 1,4,5-trisphosphate-sensitive stores followed by Ca2+ entry through store-operated Ca2+ channels, and the latter selectively activate the Ca2+-dependent transcription factor NFAT. The cysteinyl leukotriene type I receptors desensitize through negative feedback by protein kinase C, which terminates the oscillatory Ca2+ response. Here, we show that the scaffolding protein caveolin-1 has a profound effect on receptor-driven Ca2+ signals and downstream gene expression. Overexpression of caveolin-1 increased receptor-phospholipase C coupling, resulting in initially larger Ca2+ release transients of longer duration but which then ran down quickly. NFAT-activated gene expression, triggered in response to the Ca2+ signal, was also reduced by caveolin-1. Mutagenesis studies revealed that these effects required a functional scaffolding domain within caveolin-1. Mechanistically, the increase in Ca2+ release in the presence of caveolin-1 activated protein kinase C, which accelerated homologous desensitization of the leukotriene receptor and thereby terminated the oscillatory Ca2+ response. Our results reveal that caveolin-1 is a bimodal regulator of receptor-dependent Ca2+ signaling, which fine-tunes the spatial and temporal profile of the Ca2+ rise and thereby its ability to activate the NFAT pathway.
Introduction
Receptor desensitization is a universal and conserved mechanism that attenuates responses evoked by prolonged stimulation. The kinetics of receptor desensitization vary over orders of magnitude. Kainate receptors desensitize within milliseconds (1), whereas the process develops over hundreds of milliseconds for NMDA receptors (2). By contrast, desensitization of G protein-coupled receptors develops over tens of seconds (3).
In many cell types, moderate stimulation of cell surface receptors that activate the phospholipase C pathway evokes a series of cytoplasmic Ca2+ oscillations (4). Information can be encoded in the amplitude, frequency, and spatial profile of the oscillatory signal, leading to activation of selective downstream responses including mitochondrial metabolism, secretion, and gene expression (5).
In mast cells, the activation of cysteinyl leukotriene type I (CysLT1)3 receptors with the proinflammatory agonist leukotriene C4 (LTC4) evokes cytoplasmic Ca2+ oscillations. The CysLT1 receptor shows homologous desensitization through which protein kinase C, including the Ca2+-dependent α isoform (6), phosphorylates three serine residues on the carboxyl terminus to uncouple the receptor from phospholipase C (7). Acute inhibition of protein kinase C, down-regulation of Ca2+-dependent protein kinase C isoforms, or siRNA knockdown of protein kinase Cα all convert the oscillatory Ca2+ response into a more sustained Ca2+ rise, demonstrating that the oscillatory Ca2+ signals are a consequence of reversible receptor desensitization (6), likely reflecting pulsatile increases in InsP3.
Reversible receptor desensitization enables phasic Ca2+ signals to occur, thereby bypassing the deleterious consequences of a sustained Ca2+ rise that include excitotoxicity and Ca2+-dependent inhibition of signaling molecules. Mechanisms that control the rate and extent of receptor desensitization will therefore have a profound influence on the spatiotemporal pattern of agonist-evoked Ca2+ signals and the subsequent activation of downstream targets. Here we report that the scaffolding protein caveolin-1 enhances desensitization of CysLT1 receptors. The amplitude of Ca2+ oscillations is initially increased by caveolin-1, because of enhanced coupling between the receptor and phospholipase C. However, the increased Ca2+ mobilization stimulates Ca2+-dependent protein kinase C, which then terminates the oscillatory response by accelerating receptor desensitization. Our work identifies caveolin-1 as a bimodal regulator of intracellular Ca2+ signals.
EXPERIMENTAL PROCEDURES
Cell Culture and Transfection
The rat mast cell line RBL-1 was purchased from ATCC (via United Kingdom supplier LCG Standards). For regular maintenance, cells were cultured in Dulbecco's modified Eagle's medium (DMEM) with 10% fetal bovine serum and 1% penicillin/streptomycin at 37 °C with 5% CO2 as described (8). For experiments, RBL-1 cells were transfected using the Amaxa system and then incubated overnight in medium without penicillin/streptomycin. Experiments were carried out 24–36 h after transfection.
Plasmid Constructs
Wild type caveolin-1 tagged with EGFP was kindly provided by Dr. Suetsugu (University of Tokyo, Japan) (9), and the pleckstrin homology domain linked to GFP (GFP-PHD) was kindly provided by Dr. Meyer (Stanford University) via Addgene. Both caveolin-1-myc-RFP and the tyrosine 14 phospho-inactive form (Y14F caveolin-1-myc-RFP mutant) were kind gifts from Dr. Nabi (University of British Columbia, Canada) (10). Transfection efficiency for these constructs was similar and varied between 30 and 45%.
The scaffolding domain mutant caveolin-1 (F92A,T95A) was generated by using the QuikChange Lightning site-directed mutagenesis kit (Agilent Technologies) with primers list as follows: for mouse caveolin-1 (tagged with EGFP), sense primer 5′-AAGGCCAGCTTCACCACCGCCACTGTGGCAAAATATTGGTTTTACCG-3′ and antisense primer 5′-CGGTAAAACCAATATTTTGCCACAGTGGCGGTGGTGAAGCTGGCCTT-3′; for human caveolin-1 (tagged with RFP), sense primer 5′- AAGGCCAGCTTCACCACCGCCACTGTGGCGAAATACTGGTTTTACC-3′ and antisense primer 5′- GGTAAAACCAGTATTTCGCCACAGTGGCGGTGGTGAAGCTGGCCTT-3′.
Cytoplasmic Ca2+ Measurements
Cells were loaded with Fura-2/AM for 40 min at room temperature in the dark and then washed three times with a solution composed of 145 mm NaCl, 2.8 mm KCl, 2 mm CaCl2, 2 mm MgCl2, 10 mm d-glucose, and 10 mm HEPES, pH 7.4, with NaOH as described (11). Cells were left for 15 min to allow further de-esterification. Ca2+-free solution contained 145 mm NaCl, 2.8 mm KCl, 2 mm MgCl2, 10 mm d-glucose, 10 mm HEPES, and 0.1 mm EGTA, pH 7.4, with NaOH. Cytoplasmic Ca2+ imaging experiments were carried out using a TILL Photonics system with an IMAGO CCD camera. Cells were excited alternately at 356 and 380 nm, and images were acquired every 2 s. Images were analyzed off line using IGOR Pro for Windows. Ca2+ signals are represented at a ratio of 356/380 nm. The experiments illustrated in Fig. 9 were carried out using the imaging system in the laboratory of Dr. Glitsch (Department of Physiology, Anatomy and Genetics, University of Oxford) while repair work was being carried out on our imaging system.
FIGURE 9.
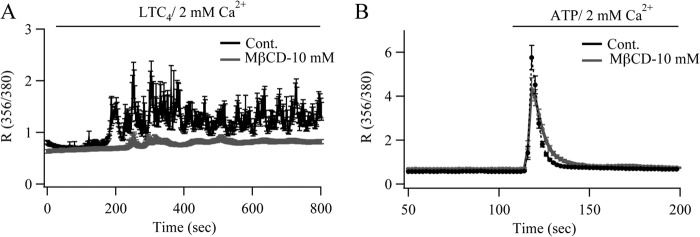
Disruption of lipid rafts with MβCD abolishes CysLT1 receptor signaling but not P2Y-evoked responses. A, Ca2+ signals to LTC4 were suppressed following 30 min of pretreatment with MβCD. B, MβCD had no clear effect on ATP-driven Ca2+ signals. Each graph is the average of between 45 and 60 cells from three independent experiments.
Immunocytochemistry and Image Analysis
For immunocytochemistry, cells were transfected with caveolin-1-RFP and FLAG-tagged CysLT1 receptor and then fixed 48 h later with 4% paraformaldehyde and permeabilized with 0.5% Triton X-100. After that, cells were incubated with blocking solution (Thermo Scientific) for 1 h and then incubated with specific primary antibody against FLAG tag (Sigma-Aldrich). Secondary antibody against rabbit IgG was conjugated with Alexa-488 purchased from Invitrogen. Images were obtained by using an Olympus confocal microscope. Relative fluorescence intensity was analyzed using ImageJ software. For cells transfected with GFP-PHD, immunofluorescence images were obtained with a Leica microscope, and the fluorescence intensity was analyzed by ImageJ software. For colocalization studies, confocal images were taken with an FV-1000 confocal microscope (Olympus, Melville, NY), and the colocalization coefficient between two different channels was assessed by the Olympus Fluoview FV1000 system. At least five representative images in each group were used for analysis and 10 different areas on the cell membrane and in the cytosol were selected to obtain Pearson's correlation coefficient.
Gene Reporter Assay
24–36 h following transfection with an EGFP-based reporter plasmid under an NFAT promoter, cells were stimulated with LTC4 (see text for specific times). The percentage of GFP-positive cells was measured as describe previously (8).
Statistical Analysis
All results were expressed as mean ± S.E. A two-tailed Student's t test was used to compare differences between two groups, and one-way analysis of variance was used to compare differences when groups numbered three or more (GraphPad Prism). Statistical significance was set at p < 0.05, with one, two, and three asterisks denoting p < 0.05, 0.01, and 0.001, respectively.
RESULTS
Endogenous levels of caveolin-1 were virtually undetectable in Western blots from RBL-1 cells (data not shown), so we overexpressed the GFP-tagged protein to study its impact on Ca2+ oscillations. In non-transfected (wild type) cells, stimulation with LTC4 evoked a series of cytoplasmic Ca2+ oscillations (Fig. 1A), which decreased slightly over time due to receptor desensitization (Fig. 1B) (6). Expression of caveolin-1-GFP substantially altered the pattern of the Ca2+ oscillations (Fig. 1A, dotted trace). The amplitudes of the initial Ca2+ oscillations evoked by LTC4 were now considerably larger than in non-transfected cells (Fig. 1, A and C), but the oscillations ran down more quickly and so were fewer in number over a 600 to 700-s recording period (Fig. 1B). Analysis of the various oscillatory parameters revealed that the total Ca2+ rise associated with each oscillation (area under the spike) was significantly larger in cells expressing caveolin-1-GFP (Fig. 1D); this reflected both an increase in the amplitude of each Ca2+ oscillation (Fig. 1C) as well as an increase in duration (Fig. 1E). Cytoplasmic Ca2+ during each oscillation was therefore elevated for a longer time in the presence of caveolin-1-GFP.
FIGURE 1.
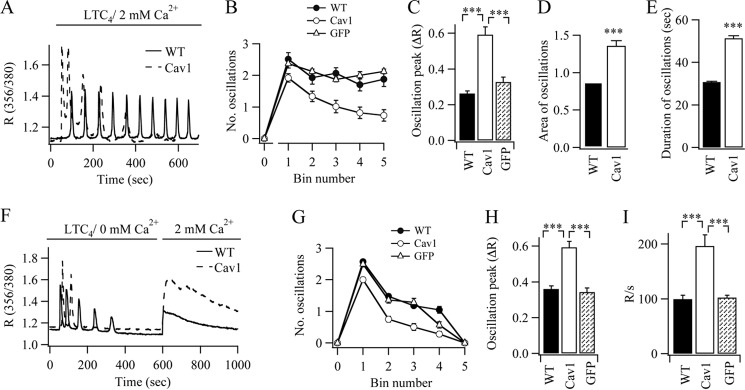
Caveolin-1 expression increases agonist-evoked Ca2+ release from internal stores. A, cytoplasmic Ca2+ oscillations to LTC4 (applied in the presence of 2 mm external Ca2+) are compared between a WT cell and one expressing caveolin-1-GFP (Cav1) (dotted trace). B, the number of oscillations/100-s bin (recording period) is compared for the conditions shown. GFP denotes expression of GFP alone. Each data point is the mean of between 21 and 30 cells from three independent experiments. C–E, the peak amplitude of the first Ca2+ oscillation (C), average area of the oscillations (D), and mean duration of the oscillations (E) are compared among WT (26 cells), GFP-expressing (34 cells), and caveolin-1-GFP-expressing cells (39 cells). For D and E, the area and duration of each oscillation was measured, and then the data were pooled together. F, store-operated Ca2+ influx measured following stimulation with LTC4 in Ca2+-free solution for 600 s followed by readmission of external Ca2+ was compared between the two conditions. G, the graph compares the rundown of Ca2+ oscillations among WT (24 cells), GFP-expressing (29 cells), and caveolin-1-expressing cells (26 cells) when cells were stimulated with LTC4 in the absence of external Ca2+ as shown in F. H, the amplitude of the first Ca2+ oscillation, evoked by LTC4 in Ca2+-free solution, is compared. I, the rates of store-operated Ca2+ entry, measured by differentiating the Ca2+ rise following readmission of 2 mm Ca2+ as in F, are compared for the conditions shown (each bar denotes >25 cells from three independent experiments).
The effects of caveolin-1-GFP were not mimicked by expression of GFP alone (Fig. 1, B and C). However, caveolin-1-RFP replicated the marked effects of caveolin-1-GFP on the pattern of Ca2+ oscillations (data not shown).
Responses in the presence of external Ca2+ reflect both InsP3-dependent Ca2+ release and Ca2+ influx through CRAC channels, the latter being required to replenish the stores with Ca2+ in readiness for the next oscillatory cycle. To see which of these processes was affected by caveolin-1, we separated Ca2+ release from Ca2+ entry by stimulating cells with LTC4 in the absence of external Ca2+ and then readmitting external Ca2+ once the oscillations had run down. Because of the lack of Ca2+ influx, Ca2+ oscillations decreased in size over time and were lost typically within 400 s after stimulation (the control cell is shown in Fig. 1F, and aggregate data are summarized in Fig. 1G). Readmission of external Ca2+ after 600 s resulted in Ca2+ entry through CRAC channels (Fig. 1F). Expression of caveolin-1-GFP increased the amplitude of the Ca2+ oscillations in Ca2+-free solution considerably (Fig. 1F; aggregate data are shown in Fig. 1H), but these oscillations ran down more quickly than the corresponding control recordings (Fig. 1G). Readmission of external Ca2+ led to a significantly larger rate of rise of Ca2+ (Fig. 1, F and I), indicating increased store-operated Ca2+ influx. Unlike the case of caveolin-1-GFP, expression of GFP alone had no effect on the number of Ca2+ oscillations (Fig. 1G), the size of the oscillations (Fig. 1H), or store-operated Ca2+ entry (Fig. 1I and Ref. 12).
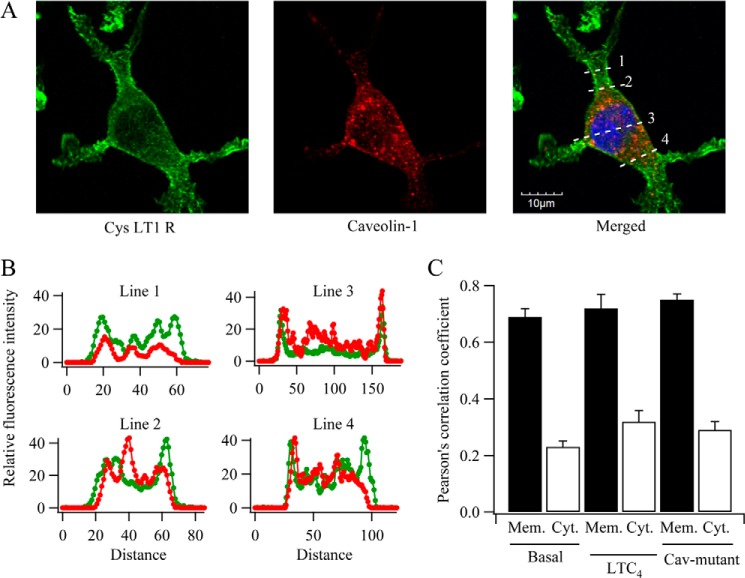
Caveolin-1 increases the interaction between the heterotrimeric GTP-binding protein Gq and phospholipase C (13), a mechanism that could explain the increase in amplitude of the Ca2+ oscillations. If so, caveolin-1 should be expressed in the plasma membrane. Immunocytochemical studies revealed the presence of both FLAG-tagged CysLT1 receptors and caveolin-1-RFP in the plasma membrane (Fig. 2A). A significant fraction of caveolin-1-RFP was also found in the cytoplasm, likely reflecting its contribution to vesicle sorting (14). To test for colocalization, at the level of resolution provided by confocal microscopy, we merged images and measured the subcellular distribution of each protein using line scanning (Fig. 2A, merged panel). CysLT1 receptor distribution showed two clear peaks, corresponding to plasma membrane at the two edges of the cell (Fig. 2B, green traces). Although caveolin-1-RFP was present within the cytoplasm, two peaks at the cell periphery were also resolvable, indicating a plasma membrane location. We quantified the extent of overlap of the two proteins using Pearson's correlation coefficient (Fig. 2C). Under both basal and stimulated conditions (LTC4 exposure for 10 min), there was a much better correlation between FLAG-tagged CysLT1 receptor and caveolin-1-RFP in the membrane than in the cytoplasm, and stimulation did not change the correlation coefficient (Fig. 2C).
FIGURE 2.
Subcellular distribution of caveolin-1 and CysLT1 receptors in RBL-1 cells. Cells were co-transfected with caveolin-1-RFP and FLAG-tagged CysLT1 receptor and then fixed 48 h later. A, confocal images for the conditions shown. Line scans are shown in the merged panel. B, fluorescence profiles from the line scans are shown. Caveolin-1-RFP distribution is shown in red, and FLAG-tagged CysLT1 receptors are in green. C, histogram compares Pearson's correlation coefficient for the conditions shown. CaV-mutant denotes caveolin-1 with point mutations in the scaffolding domain (see Fig. 4). Mem., membrane; Cyt., cytosol.
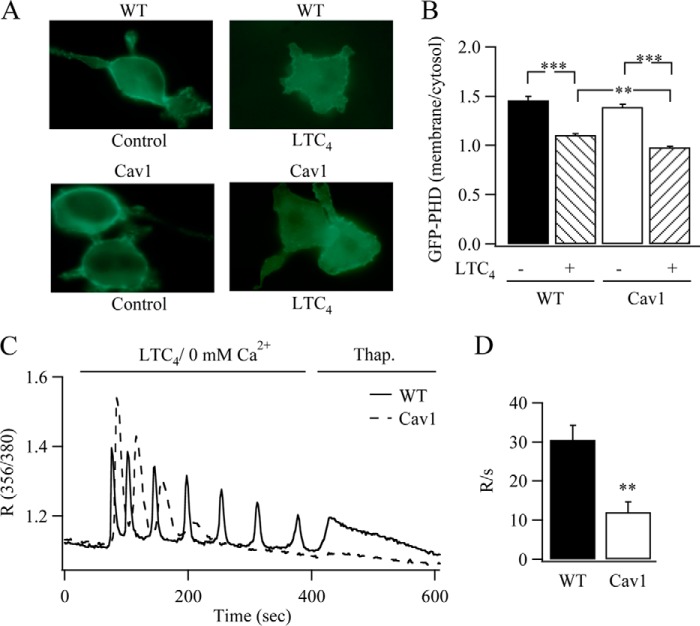
If caveolin-1 increases receptor-phospholipase C coupling, two predictions are that, first, InsP3 levels should increase more following stimulation in the presence of caveolin-1 than in wild type cells, and second, less Ca2+ should remain within the InsP3-sensitive store after the Ca2+ oscillations have run down in cells expressing caveolin-1. Using the GFP-PHD construct as a means for monitoring InsP3 levels in individual cells (15–17), we found that stimulation with LTC4 for 5 min resulted in a modest decrease in the membrane/cytosol ratio of GFP-PHD (decrease of 24.5 ± 1.7%; Fig. 3, A and B), and this was slightly more pronounced when caveolin-1-RFP was expressed (31.2 ± 1.4%, p < 0.05; Fig. 3, A and B). To test the second prediction, we stimulated cells with LTC4 in the absence of external Ca2+, and then once the oscillations had stopped, we applied thapsigargin in Ca2+-free solution to estimate how much Ca2+ remained within the store (Fig. 3C). The thapsigargin-mobilizable Ca2+ pool was significantly reduced in cells expressing caveolin-1-GFP (Fig. 3D, p < 0.01).
FIGURE 3.
Receptor-phospholipase C coupling increases in the presence of caveolin-1. A, stimulation with LTC4 increases the release of GFP-PHD from the plasma membrane when caveolin-1-RFP (Cav1) is present. B, aggregate data are summarized (9 and 13 cells for each condition on three separate preparations). C, following stimulation with LTC4 in Ca2+-free solution, the amount of Ca2+ remaining in the stores was estimated by application of thapsigargin (Thap.; 2 μm). D, aggregate data are summarized. The rate of rise of cytoplasmic Ca2+ following application of thapsigargin was measured as an indicator of the Ca2+ content of the stores. Data represent 44 caveolin-1-GFP-expressing cells and 39 wild type cells from two independent cell preparations. **, p < 0.01; ***, p < 0.001.
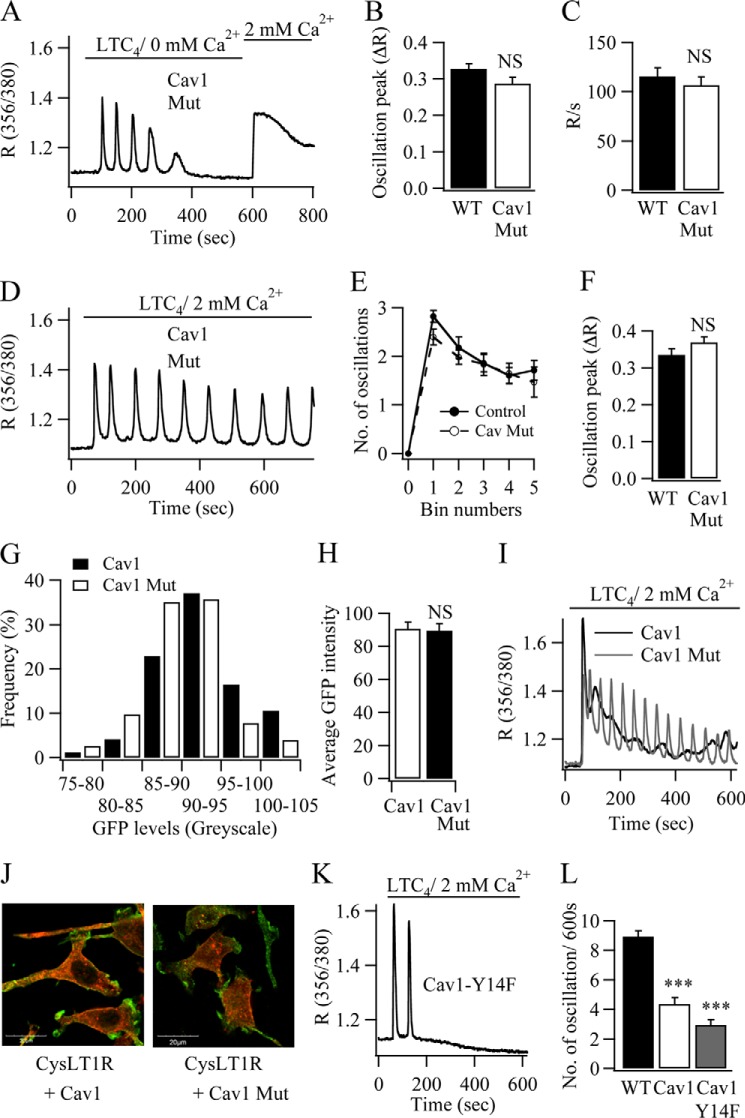
The scaffolding domain of caveolin-1, which involves amino acids between residues 82 and 101, is required for interaction with receptors, G proteins, and other signaling molecules (18, 19). A central core of four amino acids within this region, encompassing 92FTVT95, is critical for association with G proteins (20). To determine whether this central core was required for regulation of Ca2+ signals generated by CysLT1 receptors, we made mutations within the site to see the effect on Ca2+ oscillations. Following transfection of a GFP-tagged caveolin-1 construct in which phenylalanine (Phe-92) and threonine (Thr-95) had been mutated to alanines, several Ca2+ oscillations were seen in Ca2+-free solution (Fig. 4A); these were similar in size to those obtained in wild type cells (Fig. 4B). The number of oscillations in Ca2+-free solution (data not shown) and the rate of rise of the Ca2+ signal due to store-operated entry were also not significantly different from control cells (Fig. 4C). Cytoplasmic Ca2+ oscillations in response to LTC4 showed only modest rundown when transfected with the mutated caveolin-1 (Fig. 4D), which was not different from wild type cells (Fig. 4E). The size of these oscillations was also similar to that in wild type cells (Fig. 4F).
FIGURE 4.
Mutations within the scaffolding domain abolish the stimulatory effect of caveolin-1-GFP (Cav1) on Ca2+ release. A, numerous Ca2+ oscillations are obtained in Ca2+-free solution in response to LTC4 when the mutated caveolin-1-GFP protein is expressed. B and C, the amplitude of the first Ca2+ oscillation (B) and rate of store-operated Ca2+ entry (C) are compared between wild type cells and those expressing mutant Cav1-GFP (each bar represents between 21 and 31 cells from four independent experiments). D, Ca2+ oscillations to LTC4 in the presence of external Ca2+ do not run down in the presence of mutant caveolin-1. E, the graph compares the number of oscillations/100-s bin between wild type cells and those expressing the mutant caveolin-1-GFP protein. Each point is between 30 and 60 cells. F, the size of the first oscillation in 2 mm external Ca2+ is compared for the conditions shown. G, the histogram compares the GFP fluorescence for all cells transfected with either caveolin-1-GFP (137 cells) or mutant caveolin-1-GFP (140 cells). H, the averaged GFP intensity is compared for the two conditions. I, Ca2+ responses in two cells that expressed very similar levels of GFP are compared. J, merged confocal images showing the presence of FLAG-tagged CysLT1 receptors and either Cav1-RFP or mutant Cav1-RFP. K, Ca2+ oscillations run down quickly when a Cav1 protein is expressed with a mutation in the tyrosine phosphorylation site (Y14F). L, aggregate data comparing the number of oscillations over the entire 600-s recording for the conditions described are shown (each bar represents the mean of 10 and 17 cells from two independent experiments). NS, nonsignificant; ***, p < 0.001.
We considered the possibility that expression of F92A,T95A caveolin-1-GFP was considerably lower than caveolin-1-GFP, thereby explaining the lack of effect of mutant caveolin-1 on Ca2+ oscillations. We therefore compared GFP fluorescence in cells transfected with either caveolin-1-GFP or F92A,T95A caveolin-1-GFP. There was no difference in either the profile of GFP expression between the two groups (Fig. 4G) or the averaged GFP fluorescence between the groups (Fig. 4H). In Fig. 4I, Ca2+ signals evoked by LTC4 are compared between a cell expressing caveolin-1-GFP and one expressing F92A,T95A caveolin-1-GFP. The cells had almost identical levels of GFP expression (92 and 93 gray scale units, respectively). However, only the presence of caveolin-1-GFP altered the pattern of the Ca2+ oscillations. Confocal images showed that both caveolin-1-RFP and F92A,T95A caveolin-1-RFP were expressed at the plasma membrane with FLAG-tagged CysLT1 receptors (Fig. 4J). Pearson's correlation coefficient between mutant caveolin-1-RFP and CysLT1 receptors was similar to that seen for caveolin-1-RFP and the receptors (Fig. 2C). Collectively, these results show that the scaffolding domain of caveolin-1 is important for the modulation of agonist-evoked Ca2+ oscillations.
Phosphorylation of caveolin-1 on tyrosine 14 by Src family kinases potentiates growth factor signaling and is required for internalization of caveolae (21). Expression of an RFP-tagged caveolin-1 construct with a point mutation converting tyrosine to phenylalanine (Y14F) was expressed in the plasma membrane (Fig. 4J) and mimicked the effects of caveolin-1-GFP expression on agonist-induced Ca2+ oscillations. The initial Ca2+ transients were larger (Fig. 4K), and fewer oscillations were obtained (Fig. 4L). Internalization of caveolin-1 through phosphorylation of tyrosine 14 therefore does not contribute to the effects of caveolin-1 on LTC4-driven Ca2+ signals.
We designed experiments to identify the mechanism responsible for the accelerated rundown of Ca2+ oscillations seen in the presence of caveolin-1. To see whether this was dependent on Ca2+ release or Ca2+ entry, we stimulated cells in the absence of external Ca2+ but with the plasma membrane Ca2+ pump blocked with La3+. Under these conditions, Ca2+ release can no longer be exported out of the cell and instead is sequestrated back into the stores. Ca2+ oscillations therefore continue for several minutes, reflecting regenerative Ca2+ release in the absence of Ca2+ influx (11, 22). Stimulation with LTC4 in wild type cells evoked a series of repetitive Ca2+ oscillations that decreased slightly in number over time (Fig. 5, A and B). By contrast, in cells expressing caveolin-1-GFP, larger Ca2+ spikes were obtained initially, which then ran down quickly (Fig. 5, A and B). As with the responses in the presence of external Ca2+, the amplitude of the first oscillation (Fig. 5C), as well as the duration of the oscillations (Fig. 5D), was significantly increased in the presence of caveolin-1-GFP. Rundown of Ca2+ oscillations in the presence of caveolin-1 therefore arises from Ca2+ release.
FIGURE 5.

Ca2+ oscillations run down in the presence of caveolin-1-GFP (Cav1) under conditions of regenerative Ca2+ release. Cells were stimulated in Ca2+-free external solution supplemented with 1 mm La3+. A, whereas Ca2+ oscillations to LTC4 in wild type cells are sustained, they run down quickly when caveolin-1-GFP is expressed (dotted line). B, aggregate data summarizing the number of oscillations per 100 s bin is shown. Each point is the mean between 23 and 41 cells from four independent experiments. C and D, the amplitude of the first Ca2+ oscillation (C) and the duration of each oscillation (D) are compared. ***, p < 0.001.
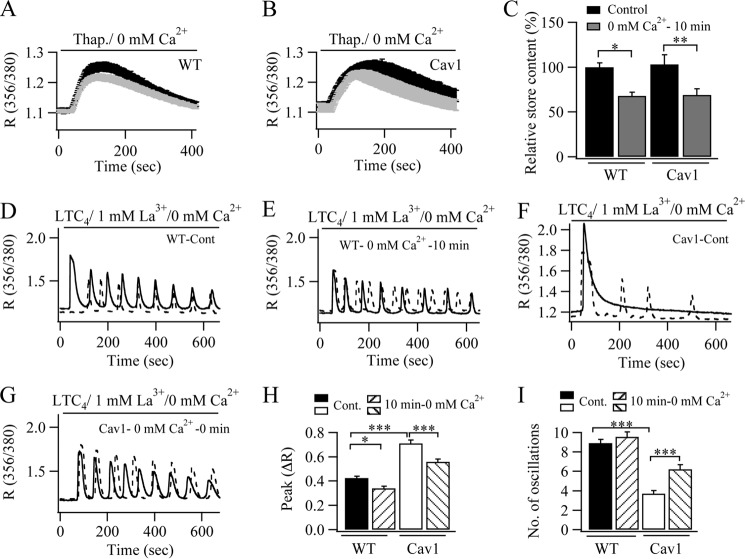
Further evidence that Ca2+ release from the stores in caveolin-1-expressing cells contributes to the rundown of the oscillations is shown in Fig. 6. In these experiments, we sought to partially lower the Ca2+ content of the stores in order to reduce the size of each Ca2+ oscillation upon stimulation. We therefore incubated control (non-transfected) cells in Ca2+-free solution for 10 min and found that this was sufficient to reduce the extent of Ca2+ release by thapsigargin by ∼ 30% when compared with control cells pre-exposed to Ca2+-free solution for just a few seconds prior to stimulation with thapsigargin (Fig. 6, A and C). We then stimulated cells in Ca2+-free solution containing 1 mm La3+ to eliminate the increased Ca2+ influx due to the reduced store Ca2+ content from affecting the oscillatory pattern. Oscillatory Ca2+ responses to LTC4 were sustained both in cells pretreated with Ca2+-free solution acutely (Fig. 6, D and I) and in those following 10 min of pretreatment (Fig. 6, E and I), although the size of the oscillations was smaller in the latter case (Fig. 6H), reflecting the reduced store Ca2+ content. In cells expressing caveolin-1-GFP and incubated in Ca2+-free solution for 10 min, the extent of Ca2+ release induced by thapsigargin was similar to control cells treated in the same way (Fig. 6, B and C). Whereas only a few Ca2+ oscillations were seen in response to LTC4 challenge in caveolin-1-GFP-expressing cells exposed to Ca2+-free solution for a few seconds prior to stimulation (Fig. 6, F and I), preincubation for 10 min with Ca2+-free external solution resulted in more prolonged oscillatory Ca2+ signals following agonist stimulation (Fig. 6, G and I). The amplitude of the first Ca2+ oscillation was reduced following the 10-min preincubation in Ca2+-free solution prior to stimulation (Fig. 6H). Hence, lowering the Ca2+ content of the stores results in prolonged oscillatory Ca2+ signals in the presence of caveolin-1-GFP. These results are consistent with the view that the enhanced Ca2+ release normally seen in caveolin-1-expressing cells is responsible for the accelerated rundown of the oscillations.
FIGURE 6.
Reducing the Ca2+ content of the stores prior to stimulation reduces the rundown of Ca2+ oscillations in caveolin-1-GFP (Cav1)- expressing cells. A, preincubation in Ca2+-free solution reduces the store Ca2+ content, as assessed by the extent of Ca2+ release to thapsigargin. The black trace is control (∼30 s in Ca2+-free solution). The dotted trace is the response after 10 min in Ca2+-free solution. Each trace represents the average of 15–35 cells from four independent experiments. B, same as in A, but for cells expressing caveolin-1. C, aggregate data from several recordings as in A and B are summarized. D, typical oscillatory responses to LTC4 obtained in Ca2+-free solution containing La3+. In each of the panels D–G, two cells (solid line and dotted line) treated the same way but from two different preparations are shown. E, typical oscillatory responses after preincubation in Ca2+-free solution for 10 min. F, oscillatory responses to LTC4 in cells expressing caveolin-1. G, oscillatory responses to LTC4 in caveolin-1-expressing cells after pre-exposure to Ca2+-free solution for 10 min. H, the amplitude of the first oscillation for each condition is shown. I, the average numbers of oscillations obtained over 600 s for each condition are compared. Each bar represents between 15–38 cells from three independent experiments. **, p < 0.01; ***, p < 0.001.
One way whereby enhanced Ca2+ release can increase the rundown of Ca2+ oscillations is through Ca2+-dependent inactivation of InsP3 receptors. However, the Ca2+ release transient following phospholipase C-coupled P2Y receptor activation after CysLT1 receptors had been desensitized was slightly larger in caveolin-1-expressing cells (Fig. 7B) than in the corresponding controls (Fig. 7A; aggregate data are shown in Fig. 7C). Inactivation of the InsP3 receptor therefore plays little role in the rundown of Ca2+ oscillations in the presence of caveolin-1.
FIGURE 7.

Rundown of Ca2+ oscillations is not associated with inactivation of InsP3 receptors. A and B, ATP (100 μm) was applied 600 s after stimulation with LTC4 (in Ca2+-free solution containing 1 mm La3+) in either wild type cells (A) or in cells expressing caveolin-1-GFP (Cav1) (B). C, aggregate data from several experiments are compared. Each bar represents 21–35 cells from two independent experiments. Black bars denote responses to ATP in the absence of prior stimulation with LTC4.
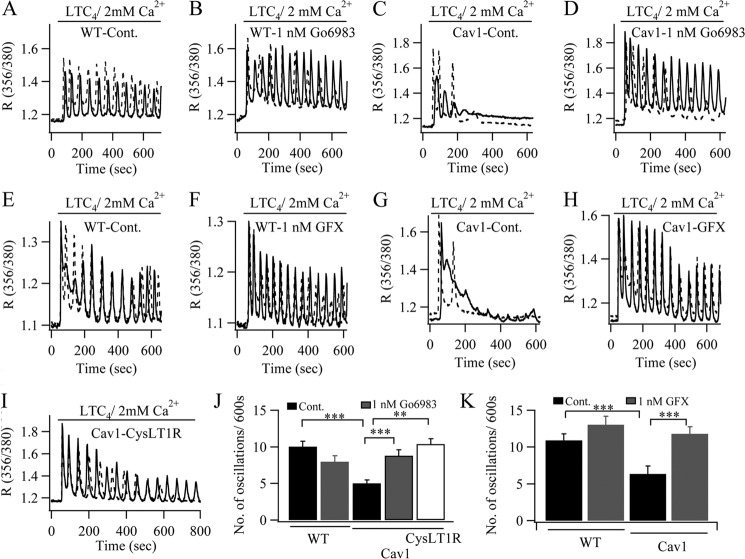
We considered that rundown of the Ca2+ oscillations was a consequence of the accelerated desensitization of the CysLT1 receptor. These receptors are desensitized following Ca2+-dependent protein kinase C-mediated phosphorylation of a series of serine residues on the carboxyl terminus of the receptor, and we had previously found a major role for protein kinase Cα in the desensitization process (6). Increased Ca2+ release following caveolin-1-GFP expression would lead to stronger activation of Ca2+-dependent protein kinase C isoforms and thus should result in more pronounced receptor desensitization. To test this possibility, we used a low concentration of the protein kinase C inhibitor Go6983 (1 nm) to reduce but not abolish kinase activity, as substantial block of the kinase results in non-oscillatory Ca2+ signals (6). The typical oscillatory Ca2+ response in wild type cells induced by LTC4 stimulation (Fig. 8A) was only weakly affected by the low concentration of Go6983 (Fig. 8, B and J). However, the rapid rundown of Ca2+ oscillations in cells expressing caveolin-1-GFP (Fig. 8C) was largely prevented by the protein kinase C inhibitor (Fig. 8, D and J). Identical results were obtained with a structurally different protein kinase C blocker, GF109203X (1 nm; Fig. 8, E–H and K). Many agonists of G protein-coupled receptors elicit responses by occupying only a fraction of the total receptors. We therefore reasoned that increasing the number of available CysLT1 receptors in the plasma membrane in cells expressing caveolin-1-GFP should lead to an increased likelihood for LTC4 to encounter a non-desensitized receptor, which should reduce the rate of rundown of Ca2+ oscillations. We therefore transfected cells with plasmids for caveolin-1-GFP and the CysLT1 receptor. Increased expression of CysLT1 receptors significantly prolonged the oscillatory Ca2+ response compared with cells transfected with caveolin-1-GFP alone (Fig. 8, I and J). Despite coupling to phospholipase C via Gq proteins, P2Y receptor-driven Ca2+ release was unaffected by caveolin-1-GFP expression (ATP responses measured at 600 s in wild type cells and in those expressing caveolin-1-GFP were similar (Fig. 7C, black bars)). This suggests that P2Y and CysLT1 receptors might couple to phospholipase C differently, with the leukotriene receptor more prominent in caveolin-1-rich domains. Lipid rafts can be disrupted by methyl-β-cyclodextrin (MβCD), a compound that removes cholesterol from the plasma membrane. Treatment with MβCD abolished LTC4-dependent Ca2+ responses (Fig. 9A) but had no significant effect on P2Y-evoked Ca2+ signals (Fig. 9B). Different agonists thus differ in their sensitivity to regulation by caveolin-1 and lipid rafts.
FIGURE 8.
Modest inhibition of protein kinase C rescues oscillatory Ca2+ signaling in cells expressing caveolin-1-GFP (Cav1). In A–I, two examples for each condition are shown (solid and dotted lines). A, typical oscillatory responses to LTC4 are depicted. B, responses from two wild type cells are shown, after pretreatment with Go6983 for 10 min. C, responses from two cells overexpressing caveolin-1-GFP are shown. D, responses from two caveolin-1-GFP-overexpressing cells pretreated with Go6983 are depicted. E–H, same as in A–D, but cells were exposed to 1 nm GF109203X instead. I, two recordings from cells co-transfected with plasmids encoding caveolin-1-GFP and CysLT1 receptor are shown. J, aggregate data from several experiments with Go6983 are summarized. Each bar represents between 18 and 25 cells from three independent experiments. K, results with GF109203X are compared. Each bar denotes 18–26 cells from two independent experiments. **, p < 0.01; ***, p < 0.001.
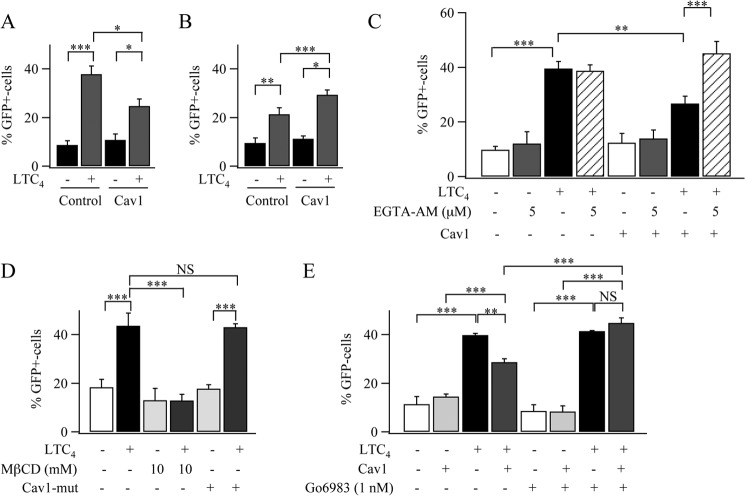
To see whether the altered pattern of Ca2+ signaling by caveolin-1 had functional relevance, we measured Ca2+-dependent gene expression using a GFP construct under a promoter driven by the Ca2+-dependent transcription factor NFAT (8, 23). In non-stimulated cells, expression of GFP was low (Fig. 10A), but it increased ∼4-fold after LTC4 was added to the culture medium. Basal gene expression was also low in caveolin-1-RFP-expressing cells, but stimulation resulted in a relatively weaker rise (∼ 2.5 fold, Fig. 10A; p < 0.01). Because NFAT activation is tightly linked to local Ca2+ entry through CRAC channels following physiological levels of stimulation in RBL cells (8, 24), we hypothesized that the larger size and longer duration of the Ca2+ release transients in the presence of caveolin-1 (Fig. 1, C and E) increased Ca2+-dependent slow inactivation of CRAC channels (25, 26) and thereby reduced NFAT-dependent gene expression. One way to reduce Ca2+-dependent slow inactivation of CRAC channels is to use a different stimulation protocol. Stimulation with LTC4 for 10 min in the absence of external Ca2+ fails to activate gene expression despite evoking several Ca2+ oscillations (8). Readmission of external Ca2+, a few minutes after the oscillations have run down, allows for recovery from slow inactivation. Using this protocol, we found that expression of caveolin-1-RFP now failed to reduce NFAT-dependent gene expression (Fig. 10B). In fact, expression increased somewhat, in accordance with the increase in store-operated Ca2+ entry that arises from the more extensive store depletion (Fig. 1F). Because Ca2+-dependent slow inactivation requires a rise in bulk Ca2+, it can be prevented by the slow Ca2+ chelator EGTA (25, 26). We therefore reduced the Ca2+ rise by loading the cytoplasm with EGTA. EGTA had no inhibitory effect on LTC4-induced gene expression in control cells (Fig. 10C), but it prevented the reduction in gene expression seen in the presence of caveolin-1-RFP (Fig. 10C). The reduction in LTC4-driven gene expression in caveolin-1-RFP-expressing cells was not seen when F92A,T95A caveolin-1-RFP was expressed instead (Fig. 10D). Gene expression was also impaired after lipid raft disruption with MβCD (Fig. 10D). The reduction in gene expression to LTC4 in cells expressing caveolin-1-RFP was prevented by pretreating cells with 1 nm Go6983 (Fig. 10E), a concentration that rescued repetitive Ca2+ signaling to agonist (Fig. 8).
FIGURE 10.
Caveolin-1 (Cav1) regulates Ca2+-dependent gene expression. A, expression of a GFP reporter gene under an NFAT promoter is reduced following stimulation with LTC4 in caveolin-1-RFP-expressing cells compared with control cells. Control denotes cells transfected only with GFP under the NFAT promoter. 24 h after NFAT-GFP transfection, cells were stimulated overnight with 160 nm LTC4. B, Cav1 does not impair LTC4-induced gene expression when slow inactivation is reduced. Here, cells were stimulated with LTC4 in Ca2+-free solution for 8 min, and then external Ca2+ was readmitted for 5 min before cells were placed in culture medium and left in the incubator overnight. C, aggregate data for the various conditions are compared. Stimulation with LTC4 was carried out as in A. D, aggregate data for the conditions shown are compared. Stimulation with LTC4 was as in A. E, the effects of a low concentration of Go6983 on gene expression induced by LTC4 is compared between control cells and those expressing Cav1-RFP. All data are aggregates from three independent experiments with between 50 and 80 cells from each experiment. Stimulation with LTC4 was as in A. NS, not significant; **, p < 0.01; ***, p < 0.001.
DISCUSSION
Caveolin-1 is a conserved plasma membrane scaffolding protein that facilitates interaction between signaling molecules within subcompartments of the membrane. One such interaction involves enhanced coupling between Gq and phospholipase C, thereby generating larger increases in InsP3 (13). Our data add a new aspect to this role for caveolin-1, namely in triggering receptor desensitization and thus terminating Ca2+-dependent responses following physiological levels of stimulation.
Stimulation of CysLT1 receptors with LTC4 leads to repetitive Ca2+ oscillations, which reflect regenerative Ca2+ release followed by transient Ca2+ entry through CRAC channels (11). The Ca2+ oscillations can be converted into a more prolonged non-oscillatory Ca2+ rise by interfering with protein kinase C activity (6). Protein kinase C triggers CysLT1 receptor desensitization through phosphorylation of three serine residues on the carboxyl terminus of the receptor (7). Overexpression of caveolin-1 resulted in Ca2+ oscillations with larger amplitude and greater duration, as expected from increased Gq-phospholipase C coupling. However, the oscillations ran down more quickly and Ca2+-dependent gene expression was reduced following overexpression of caveolin-1. The rundown was not due to compromised store refilling or inactivation of the InsP3 receptors. Rather, the increased Ca2+ release in the presence of caveolin-1 led to stronger Ca2+-dependent activation of protein kinase C, which resulted in increased leukotriene receptor desensitization. Partial block of protein kinase C reversed the effects of caveolin-1 on oscillation amplitude, duration, rundown, and gene expression. The increase in size and duration of Ca2+ release in the presence of caveolin-1 would lead to enhanced Ca2+-dependent inactivation of CRAC channels (25, 26). Because Ca2+ microdomains near these channels activate gene expression, larger or prolonged Ca2+ release impairs transcription by reducing CRAC channel activity.
CysLT1 receptors and caveolin-1 are co-expressed in various tissues, suggesting that the interaction we have described here might occur in other cell types as well. Airway smooth muscle expresses both CysLT1 receptors (27) and caveolin-1 (28), as do macrophages (29, 30), human umbilical vein endothelial cells (31, 32), and human colon, pancreas, and spleen (33, 34).
Our results reveal a novel mechanism for cytsteinyl leukotriene receptor desensitization involving caveolin-1. Enhanced Ca2+ release due to increased coupling between the receptor and phospholipase C both activates Ca2+-dependent protein kinase C, which leads to pronounced receptor desensitization, and accelerates Ca2+-dependent slow inactivation of CRAC channels. Activation of this pathway likely involves subcompartments within the membrane, as P2Y receptor-dependent Ca2+ release was unaffected by caveolin-1. By regulating desensitization, caveolin-1 is therefore an important determinant of the duration of receptor stimulation and thus of subsequent Ca2+-dependent downstream signaling.
Acknowledgment
We thank Clive Ellory for comments on the manuscript.
This work was supported by a Medical Research Council grant (to A. B. P.).
- CysLT1
- cysteinyl leukotriene type I
- LTC4
- leukotriene C4
- InsP3
- inositol 1,4,5-trisphosphate
- PHD
- pleckstrin homology domain
- RFP
- red fluorescent protein
- NFAT
- nuclear factor of activated T-cells
- CRAC
- Ca2+-activated Ca2+
- MβCD
- methyl-β-cyclodextrin.
REFERENCES
- 1. Dawe G. B., Musgaard M., Andrews E. D., Daniels B. A., Aurousseau M. R., Biggin P. C., Bowie D. (2013) Defining the structural relationship between kainate-receptor deactivation and desensitization. Nat. Struct. Mol. Biol. 20, 1054–1061 [DOI] [PMC free article] [PubMed] [Google Scholar]
- 2. Mayer M. L., Vyklicky L., Jr., Clements J. (1989) Regulation of NMDA receptor desensitization in mouse hippocampal neurons by glycine. Nature 338, 425–427 [DOI] [PubMed] [Google Scholar]
- 3. Kallal L., Benovic J. L. (2000) Using green fluorescent proteins to study G-protein-coupled receptor localization and trafficking. Trends Pharmacol. Sci. 21, 175–180 [DOI] [PubMed] [Google Scholar]
- 4. Thomas A. P., Bird G. S., Hajnóczky G., Robb-Gaspers L. D., Putney J. W., Jr. (1996) Spatial and temporal aspects of cellular calcium signalling. FASEB J. 10, 1505–1517 [PubMed] [Google Scholar]
- 5. Parekh A. B. (2011) Decoding cytosolic Ca2+ oscillations. Trends Biochem. Sci. 36, 78–87 [DOI] [PubMed] [Google Scholar]
- 6. Ng S. W., Bakowski D., Nelson C., Mehta R., Almeyda R., Bates G., Parekh A. B. (2012) Cysteinyl leukotriene type I receptor desensitization sustains Ca2+-dependent gene expression. Nature 482, 111–115 [DOI] [PMC free article] [PubMed] [Google Scholar]
- 7. Naik S., Billington C. K., Pascual R. M., Deshpande D. A., Stefano F. P., Kohout T. A., Eckman D. M., Benovic J. L., Penn R. B. (2005) Regulation of cysteinyl eukotriene type I receptor internalization and signaling. J. Biol. Chem. 280, 8722–8732 [DOI] [PubMed] [Google Scholar]
- 8. Kar P., Nelson C., Parekh A. B. (2011) Selective activation of the transcription factor NFAT1 by calcium microdomains near Ca2+ release-activated Ca2+ (CRAC) channels. J. Biol. Chem. 286, 14795–14803 [DOI] [PMC free article] [PubMed] [Google Scholar]
- 9. Senju Y., Itoh Y., Takano K., Hamada S., Suetsugu S. (2011) Essential role of PACSIN2/syndapin-II in caveolae membrane sculpting. J. Cell Sci. 124, 2032–2040 [DOI] [PubMed] [Google Scholar]
- 10. Joshi B., Bastiani M., Strugnell S. S., Boscher C., Parton R. G., Nabi I. R. (2012) Phosphocaveolin-1 is a mechanotransducer that induces caveola biogenesis via Egr1 transcriptional regulation. J. Cell Biol. 199, 425–435 [DOI] [PMC free article] [PubMed] [Google Scholar]
- 11. Di Capite J., Ng S. W., Parekh A. B. (2009) Decoding of cytoplasmic Ca2+ oscillations through the spatial signature drives gene expression. Curr. Biol. 19, 853–858 [DOI] [PubMed] [Google Scholar]
- 12. Moreau B., Straube S., Fisher R. J., Putney J. W., Jr., Parekh A. B. (2005) Ca2+ -calmodulin-dependent facilitation and Ca2+ inactivation of Ca2+ release-activated Ca2+ channels. J. Biol. Chem. 280, 8776–8783 [DOI] [PubMed] [Google Scholar]
- 13. Sengupta P., Philip F., Scarlata S. (2008) Caveolin-1 alters Ca2+ signal duration through specific interaction with the Gαq family of G proteins. J. Cell Sci. 121, 1363–1372 [DOI] [PMC free article] [PubMed] [Google Scholar]
- 14. Dupree P., Parton R. G., Raposo G., Kurzchalia T. V., Simons K. (1993) Caveolae and sorting in the trans-Golgi network of epithelial cells. EMBO J. 12, 1597–1605 [DOI] [PMC free article] [PubMed] [Google Scholar]
- 15. Stauffer T. P., Ahn S., Meyer T. (1998) Receptor-induced transient reduction in plasma membrane PtdIns(4,5)P2 concentration monitored in living cells. Curr. Biol. 8, 343–346 [DOI] [PubMed] [Google Scholar]
- 16. Hirose K., Kadowaki S., Tanabe M., Takeshima H., Iino M. (1999) Spatiotemporal dynamics of inositol 1,4,5-trisphosphate that underlies complex Ca2+ mobilization. Science 284, 1527–1530 [DOI] [PubMed] [Google Scholar]
- 17. Nash M. S., Young K. W., Willars G. B., Challiss R. A., Nahorski S. R. (2001) Single-cell imaging of graded Ins(1,4,5)P3 production following G-protein-coupled-receptor activation. Biochem. J. 356, 137–142 [DOI] [PMC free article] [PubMed] [Google Scholar]
- 18. Li S., Okamoto T., Chun M., Sargiacomo M., Casanova J. E., Hansen S. H., Nishimoto I., Lisanti M. P. (1995) Evidence for a regulated interaction between heterotrimeric G proteins and caveolin. J. Biol. Chem. 270, 15693–15701 [DOI] [PubMed] [Google Scholar]
- 19. Li S., Couet J., Lisanti M. P. (1996) Src tyrosine kinases, Gα subunits, and H-Ras share a common membrane-anchored scaffolding protein, caveolin. J. Biol. Chem. 271, 29182–29190 [DOI] [PMC free article] [PubMed] [Google Scholar]
- 20. Couet J., Li S., Okamoto T., Ikezu T., Lisanti M. P. (1997) Identification of peptide and protein ligands for the caveolin-scaffolding domain. J. Biol. Chem. 272, 6525–6533 [DOI] [PubMed] [Google Scholar]
- 21. Lee H., Volonte D., Galbiati F., Iyengar P., Lublin D. M., Bregman D. B., Wilson M. T., Campos-Gonzalez R., Bouzahzah B., Pestell R. G., Scherer P. E., Lisanti M. P. (2000) Constitutive and growth factor-regulated phosphorylation of caveolin-1 occurs at the same site (Tyr-14) in vivo: identification of a c-src/Cav-1/Grb7 signaling cassette. Mol. Endocrinol. 14, 1750–1775 [DOI] [PubMed] [Google Scholar]
- 22. Putney J. W., Bird G. S. (2008) Cytoplasmic calcium oscillations and store-operated calcium influx. J. Physiol. 586, 3055–3059 [DOI] [PMC free article] [PubMed] [Google Scholar]
- 23. Kim M. S., Usachev Y. M. (2009) Mitochondrial Ca2+ cycling facilitates activation of the transcription factor NFAT in sensory neurons. J. Neurosci. 29, 12101–12114 [DOI] [PMC free article] [PubMed] [Google Scholar]
- 24. Kar P., Bakowski D., Di Capite J., Nelson C., Parekh A. B. (2012) Different agonists recruit different stromal interaction molecule proteins to support cytoplasmic Ca2+ oscillations and gene expression. Proc. Natl. Acad. Sci. U.S.A. 109, 6969–6974 [DOI] [PMC free article] [PubMed] [Google Scholar]
- 25. Zweifach A., Lewis R. S. (1995) Slow Calcium-dependent inactivation of depletion-activated calcium current. J. Biol. Chem. 270, 14445–14451 [DOI] [PubMed] [Google Scholar]
- 26. Parekh A. B. (1998) Slow feedback inhibition of calcium release-activated calcium current by calcium entry. J. Biol. Chem. 273, 14925–14932 [DOI] [PubMed] [Google Scholar]
- 27. Lynch K. R., O'Neill G. P., Liu Q., Im D. S., Sawyer N., Metters K. M., Coulombe N., Abramovitz M., Figueroa D. J., Zeng Z., Connolly B. M., Bai C., Austin C. P., Chateauneuf A., Stocco R., Greig G. M., Kargman S., Hooks S. B., Hosfield E., Williams D. L., Jr., Ford-Hutchinson A. W., Caskey C. T., Evans J. F. (1999) Characterization of the human cysteinyl leukotriene CysLT1 receptor. Nature 399, 789–793 [DOI] [PubMed] [Google Scholar]
- 28. Gosens R., Baarsma H. A., Heijink I. H., Oenema T. A., Halayko A. J., Meurs H., Schmidt M. (2010) De novo synthesis of β-catenin via H-Ras and MEK regulates airway smooth muscle growth. FASEB J. 24, 757–768 [DOI] [PubMed] [Google Scholar]
- 29. Maekawa A., Austen K. F., Kanaoka Y. (2002) Targeted gene disruption reveals the role of cysteinyl leukotriene 1 receptor in the enhanced vascular permeability of mice undergoing acute inflammatory responses. J. Biol. Chem. 277, 20820–20824 [DOI] [PubMed] [Google Scholar]
- 30. Kiss A. L., Túri A., Müllner N., Tímár J. (2000) Caveolin isoforms in resident and elicited rat peritoneal macrophages. Eur. J. Cell Biol. 79, 343–349 [DOI] [PubMed] [Google Scholar]
- 31. Sjöström M., Jakobsson P. J., Heimburger M., Palmblad J., Haeggström J. Z. (2001) Human umbilical vein endothelial cells generate leukotriene C4 via microsomal glutathione S-transferase type 2 and express the CysLT1 receptor. Eur. J. Biochem. 268, 2578–2586 [DOI] [PubMed] [Google Scholar]
- 32. Schwartz E. A., Reaven E., Topper J. N., Tsao P. S. (2005) Transforming growth factor-β receptors localize to caveolae and regulate endothelial nitric oxide synthase in normal human endothelial cells. Biochem. J. 390, 199–206 [DOI] [PMC free article] [PubMed] [Google Scholar]
- 33. Sarau H. M., Ames R. S., Chambers J., Ellis C., Elshourbagy N., Foley J. J., Schmidt D. B., Muccitelli R. M., Jenkins O., Murdock P. R., Herrity N. C., Halsey W., Sathe G., Muir A. I., Nuthulaganti P., Dytko G. M., Buckley P. T., Wilson S., Bergsma D. J., Hay D. W. (1999) Identification, molecular cloning, expression and characterization of a cysteinyl leukotriene receptor. Mol. Pharmacol. 56, 657–663 [DOI] [PubMed] [Google Scholar]
- 34. Li W. P., Liu P., Pilcher B. K., Anderson R. G. (2001) Cell-specific targeting of caveolin-1 to caveolae, secretory vesicles, cytoplasm or mitochondria. J. Cell Sci. 114, 1397–1408 [DOI] [PubMed] [Google Scholar]


