Abstract
In the mammalian cerebral cortex, neural responses are highly variable during spontaneous activity and sensory stimulation. To explain this variability, the cortex of alert animals has been hypothesized to be in an asynchronous high conductance state in which irregular spiking arises from the convergence of large numbers of uncorrelated excitatory and inhibitory inputs onto individual neurons1–4. Signatures of this state are that a neuron’s membrane potential (Vm) hovers just below spike threshold, and its aggregate synaptic input is nearly Gaussian, arising from many uncorrelated inputs1–4. Alternatively, irregular spiking could arise from infrequent correlated input events that elicit large Vm fluctuations5,6. To distinguish these hypotheses, we developed a technique to carry out whole-cell Vm measurements from the cortex of behaving monkeys, focusing on primary visual cortex (V1) of monkeys performing a visual fixation task. Contrary to the predictions of an asynchronous state, mean Vm during fixation was far from threshold (14 mV) and spiking was triggered by occasional large spontaneous fluctuations. Distributions of Vm values were skewed beyond that expected for a range of Gaussian input6,7, but were consistent with synaptic input arising from infrequent correlated events5,6. Furthermore, spontaneous Vm fluctuations were correlated with the surrounding network activity, as reflected in simultaneously recorded nearby local field potential (LFP). Visual stimulation, however, led to responses more consistent with an asynchronous state: mean Vm approached threshold, fluctuations became more Gaussian, and correlations between single neurons and the surrounding network were disrupted. These observations demonstrate that sensory drive can shift a common cortical circuitry from a synchronous to an asynchronous state.
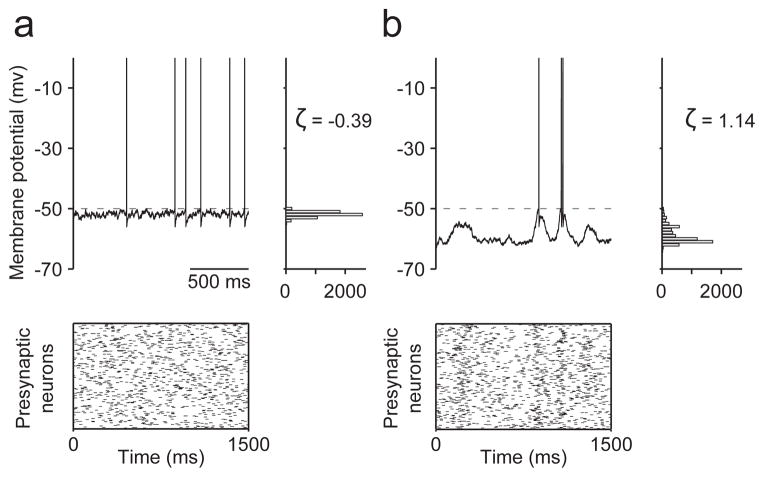
Cortical neurons exhibit variable activity even after efforts are taken to fix temporal variations in sensory stimuli and attentional state8. This ongoing activity affects stimulus encoding and synaptic plasticity9, but its neural basis is not well understood. One hypothesis is that the variable activity in alert animals arises from connections between numerous uncorrelated excitatory and inhibitory inputs1–4. Such a network is consistent with studies of neural architecture10, and exhibits spiking statistics similar to those measured in extracellular studies8. Predictions of this hypothesis2–4,6,7 are that numerous uncorrelated inputs (Fig. 1a, bottom) cause Vm to hover near spike threshold (Fig. 1a, top left) and to exhibit distributions that are near Gaussian or skewed with tails at hyperpolarized potentials (Fig. 1a, top right). In contrast, neurons may receive correlated input5,6 (Fig. 1b, bottom) such that Vm lies far below threshold and exhibits infrequent large excursions (Fig. 1b, top left), forming skewed distributions with tails at depolarized potentials (Fig. 1b, top right). Measurements of Vm from awake, non-behaving cats are suggestive of an asynchronous state11, but are also consistent with correlated input12. Data from behaving rodents in varying attentional states have suggested different pictures13–16, but equivocally, because of the potential contributions of uncontrolled sensory inputs and attentional states to Vm dynamics. Extracellular recordings in drowsy humans have demonstrated correlated spontaneous cortical activity, leaving open the possibility that correlations are absent during alertness17. Accordingly, we carried out the first whole-cell Vm measurements from the cortex of monkeys actively engaged in a visual fixation task, allowing us to examine Vm in single V1 neurons of alert primates while minimizing variability due to sensory stimuli, eye movements, and attentional state.
Figure 1. Vm characteristics depend on network state.
a, Cartoon of an asynchronous high conductance state. A neuron receives numerous uncorrelated inputs (bottom), Vm hovers near spike threshold (top left), forming distributions with low or negative skewness ζ (top right). b, A neuron may instead receive correlated inputs (bottom) such that Vm lies further from spike threshold and exhibits occasional large fluctuations (top left), forming distributions with high skewness ζ (top right).
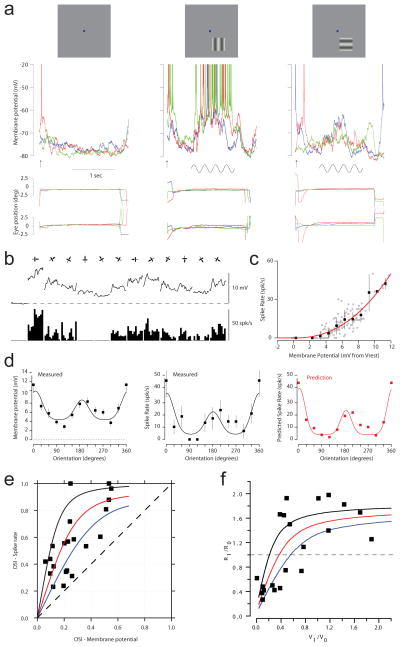
We obtained intracellular18, whole-cell19,20, current-clamp measurements of Vm from 31 V1 neurons in 3 macaque monkeys while they viewed gratings of different orientations (see Supplementary Section 1 and Supplementary Video). Each trial began when a fixation spot was displayed at the centre of a monitor in front of the monkey. The monkey had to shift gaze to the fixation point and maintain tight fixation for at least 1500 ms to receive a reward. A drifting sinusoidal grating was presented for 1000 ms while the monkey was maintaining strict fixation. We analysed Vm during the fixation period only from trials in which the monkey performed the task successfully. V1 neurons were orientation-selective, and classified as simple or complex (Supplementary Section 2 and Extended Data Fig. 1).
Extended Data Figure 1. Orientation tuning of Vm and spike rate.
a, Vm responses (top traces), eye position traces (bottom pairs of traces) from 3 blank trials (left), 3 trials at the preferred orientation (centre), and 3 trials at the orthogonal orientation (right). b, Trial averaged Vm (top) and spike rate (bottom) for all orientation, from the neuron in a. c, Spike rate versus membrane potential, and best-fit thresholded power law, from the neuron in a. d, Orientation tuning curves for Vm and spike rate, and predicted spike rate orientation tuning curve using the Vm orientation tuning curve and the best-fit thresholded power law in c, from the neuron in a. e, Orientation selectivity index (OSI) for spike rate versus OSI for Vm. Lines represent expected relationships between spike rate OSI and Vm OSI for thresholded power laws with exponents 2, 3, and 5 (blue, red, black respectively). f, Fourier component of the response with the same temporal frequency as the moving sinusoidal grating visual stimulus divided by the time averaged response for spike rate (R1/R0) versus that for Vm (V1/V0) Lines represent expected relationships between R1/R0 and V1/V0 for thresholded power laws with exponents 2, 3, and 5 (blue, red, black respectively).
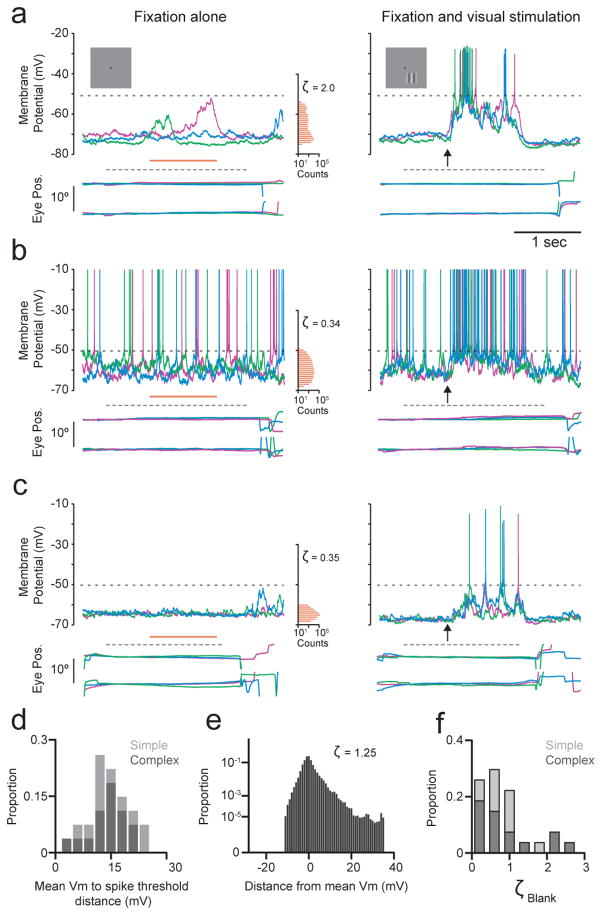
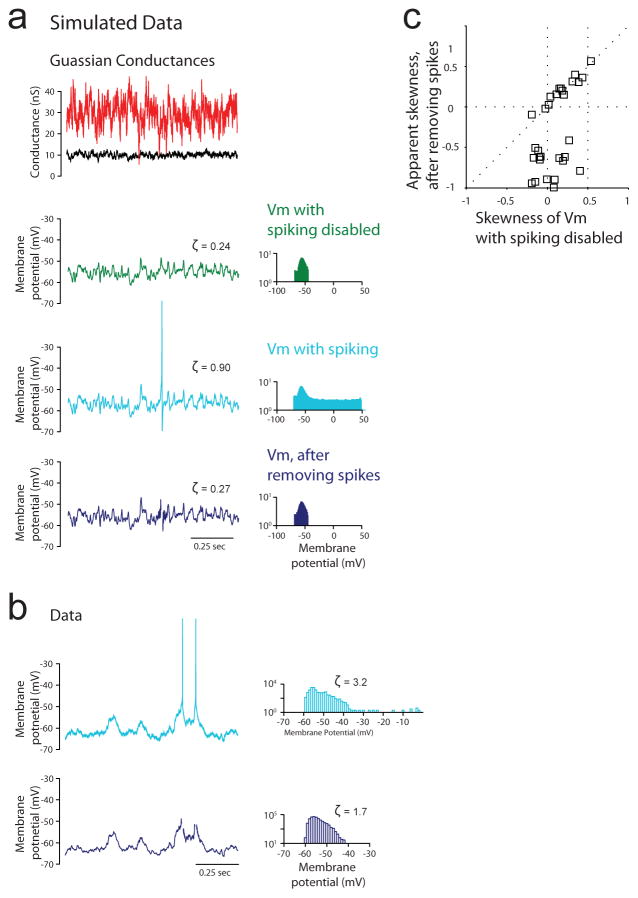
Comparing Vm in blank trials in which no visual stimulus was presented (Fig 2a–c, left) with suprathreshold responses evoked by preferred orientation gratings (Fig. 2a–c, right) shows that blank trial Vm was generally far from spike threshold. There were occasional large depolarizations during blank trials, which manifested in the positive skewness of Vm amplitude histograms, which had longer tails at depolarized potentials, even though traces had had spikes removed (Fig. 2a–c, left, orange histograms; see also Supplementary Section 3 and Extended Data Fig. 2). Across neurons, the median distance between blank trial Vm and spike threshold was 13.9 mV (Fig. 2d). The median skewness of 0.72 (Fig. 2e, f) differs from the near zero or negative skewness expected for a range of Gaussian input (Fig. 1a; see also Supplementary Section 3 and Extended Data Fig. 2c), but is consistent with synaptic input arising from infrequent correlated events (Fig. 1b). These data show that in the absence of visual stimulation, V1 of macaques performing a visual fixation task is not in an asynchronous high conductance state1–4.
Figure 2. Occasional large spontaneous Vm fluctuations during fixation.
a–c, Vm (top), horizontal and vertical eye position (bottom) from 3 blank trials, and corresponding histograms from the period indicated by the orange line (left); traces from 3 preferred orientation trials, arrow indicates stimulus onset (right); lower and upper dashed lines respectively indicate the period of required fixation, and spike threshold; a–c are different neurons. d, Distribution across neurons of distance between mean Vm during blank trials and spike threshold (n=26). e, The population Vm distribution for blank trials is the average of each neuron’s normalized mean-subtracted distribution. f, Distribution across neurons of blank trial Vm skewness. Light and dark bars in d, f indicate simple and complex cells respectively.
Extended Data Figure 2. Estimation and implication of Vm skewness during blank trials.
a, Gaussian excitatory (black) and inhibitory (red) conductances, Vm with spiking disabled (green), Vm with spiking enabled (light blue), and Vm with spikes removed (dark blue), and corresponding Vm amplitude histograms and skewness values ζ, for a simulated neuron with Hodgkin-Huxley conductances. b, Vm with spiking (light blue) and with spikes removed (dark blue) and corresponding Vm amplitude histograms and skewness values ζ, for a recorded neuron. c, Apparent skewness from Vm with spikes removed versus skewness from with spiking disabled from a simulated neuron with Hodgkin-Huxley conductances, for a range of Gaussian input.
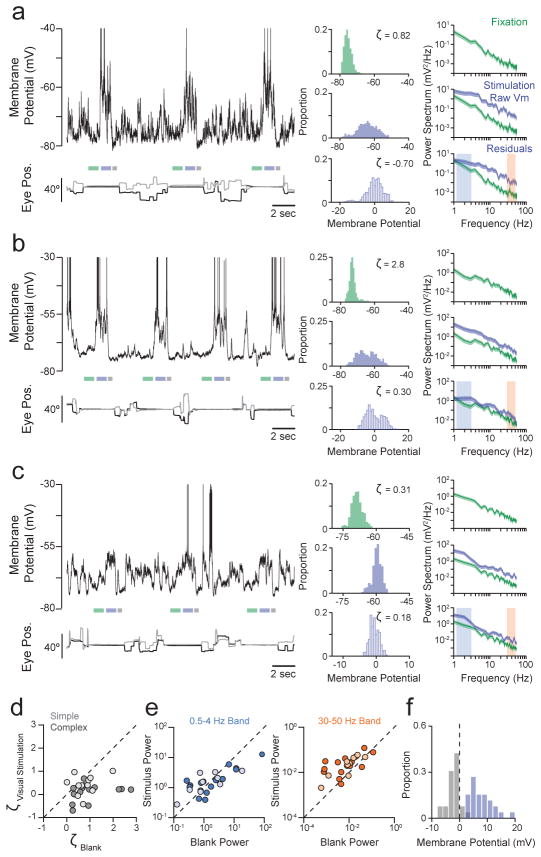
By comparison, visual stimulation depolarized neurons (Fig. 2a–c, right; Fig. 3a–c) and decreased the skewness of Vm deviations from the mean (Fig. 3a–c; see also Supplementary Section 3 and Extended Data Fig. 3), an effect significant across the population (Fig. 3d; Wilcoxon sign rank test, p<0.0001; see also Supplementary Section 3 and Extended Data Fig. 4). Together with observed increases in membrane conductance during visual stimulation21,22 (Supplementary Section 4 and Extended Data Fig. 5), these results suggest that visual stimulation shifts the cortical network towards an asynchronous high conductance state1–4.
Figure 3. Visually-evoked Vm is closer to threshold and has more Gaussian fluctuations.
a–c, Vm (top) and eye position (bottom) over pre-stimulus, stimulus and post-stimulus periods during fixation (green, lavender and grey bars respectively) and inter-trial periods; pre-stimulus, stimulus period raw value and residual (green, lavender-filled and lavender-outlined respectively) histograms and power spectra; shaded areas: low and high frequency ranges; a–c are different neurons. d, Skewness of Vm residuals during the preferred orientation versus during blank trials, for each neuron. e, Mean power in Vm residuals during blank versus visual stimulation at low (0.5–4 Hz, left) and high frequencies (30–50 Hz, right). f, Distribution across neurons of mean Vm during stimulus (lavender) and post-stimulus periods (grey), relative to mean pre-stimulus Vm. Light and dark circles in d, e indicate simple and complex cells respectively.
Extended Data Figure 3. Estimation of Vm skewness during visual stimulation trials.
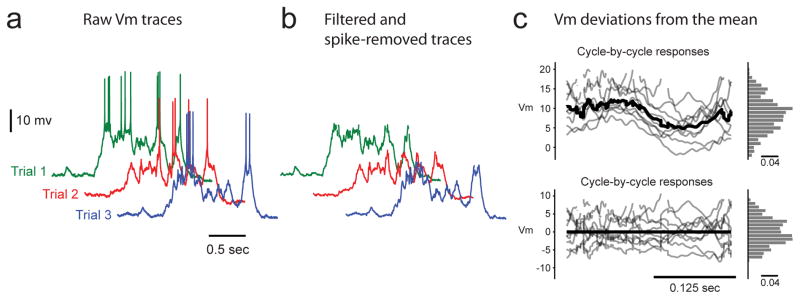
a, Raw traces from several trials. b, Traces after bandpass filtering and spike removal. c, Vm responses from each cycle (top grey traces), cycle-averaged response (top black trace), and histogram of Vm responses (top histogram); residual traces from each cycle after subtraction of cycle-averaged response (bottom grey traces), cycle-averaged residuals (bottom black trace), and histogram of Vm residuals (bottom histogram); note the change in vertical scale from top to bottom panels.
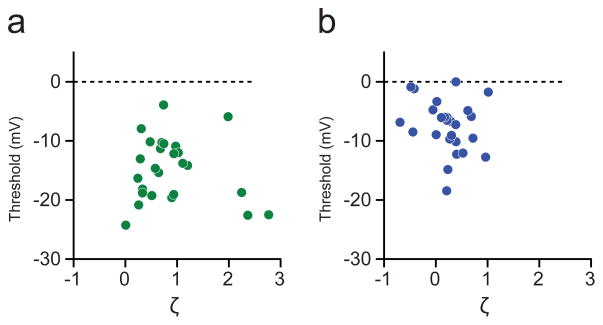
Extended Data Figure 4. Joint distribution of Vm-threshold distance and skewness.
a, Joint distribution of Vm-threshold distance and skewness ζ during blank trials. b, Joint distribution of Vm-threshold distance and skewness ζ during preferred orientation trials.
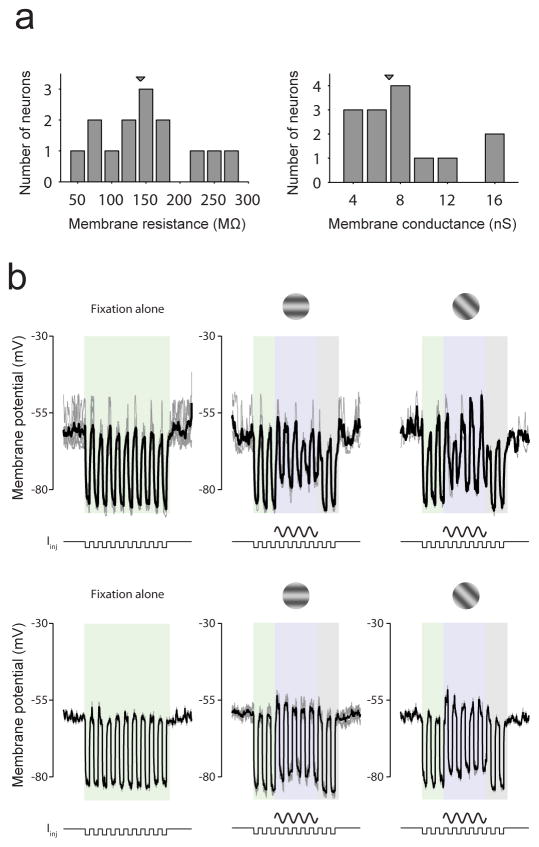
Extended Data Figure 5. Membrane conductance during blank and visual stimulation trials.
a, Distribution of membrane resistance (left) and corresponding membrane conductance (right) during blank trials. b, Change in membrane conductance during visual stimulation in 2 example neurons during blank (left), preferred (centre) and 45° from preferred (right) trials. Each row shows data from a different neuron.
Visual stimulation also caused significant changes in the power of Vm fluctuations. Membrane potential exhibited greater power at low frequencies than high frequencies during fixation, both before and during visual stimulation. Visual stimulation increased the power of Vm fluctuations from the trial-average (i.e., residuals) at high frequencies (30–50 Hz) but did not cause systematic changes at low frequencies (0.5–4 Hz) (Fig. 3a–c; Fig 3e; Wilcoxon sign rank test, p=0.76 (0.5–4 Hz), p=0.001 (30–50 Hz); see also Supplementary Section 5 and Extended Data Fig. 6). Interestingly, post-stimulus Vm was typically below pre-stimulus levels (Fig. 3f; Wilcoxon sign rank test p<0.0001).
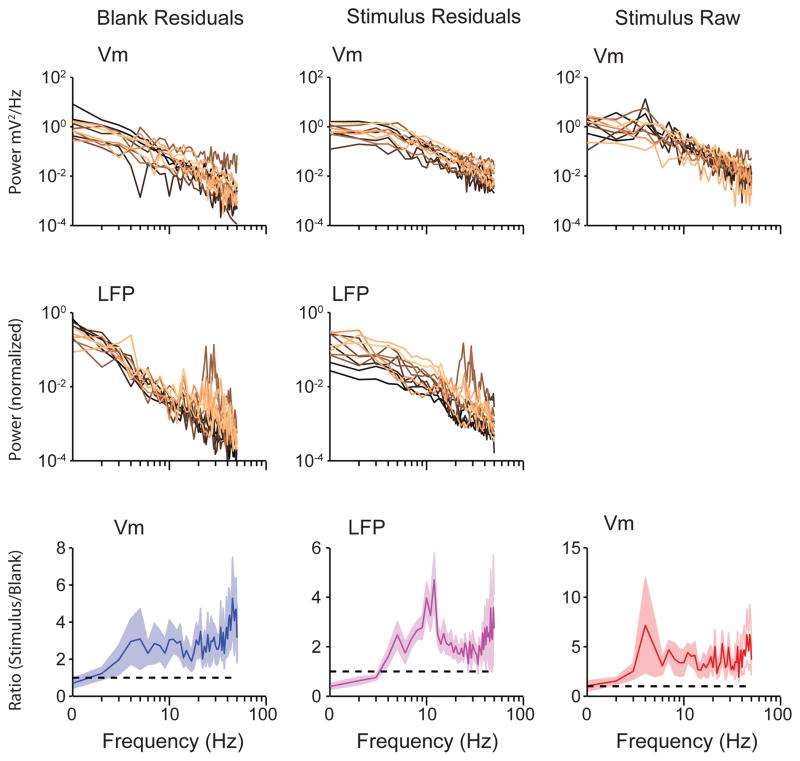
Extended Data Figure 6. Power spectra of Vm and LFP fluctuations from the trial average.
Power spectrum of Vm (top panels) and LFP (bottom panels) fluctuations from the trial average (residuals) during blank trials (left panels) and preferred orientation (right panels) for each recorded neuron. b, Population-averaged ratio of power spectrum at the preferred orientation to power spectrum for blank trials for raw Vm (top panel), Vm fluctuations from the trial average (‘Vm residuals’, middle panel), and LFP fluctuations from the trial average (‘LFP residuals’, bottom panel). Error bars are jackknifed standard errors.
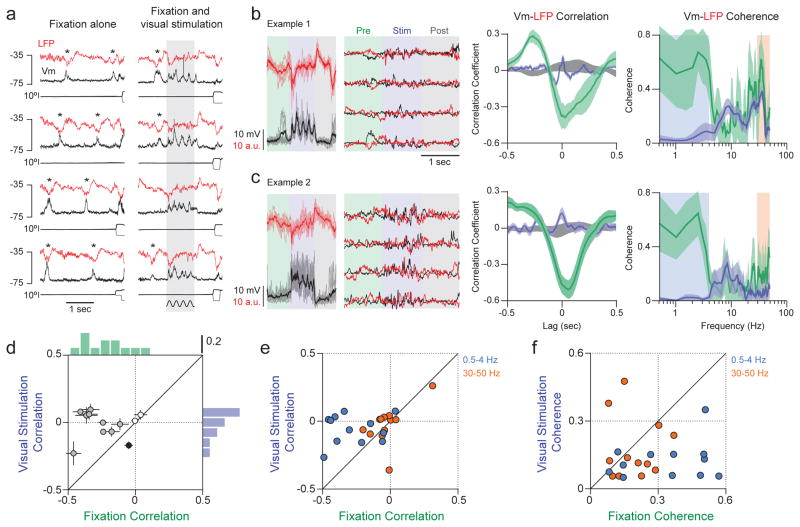
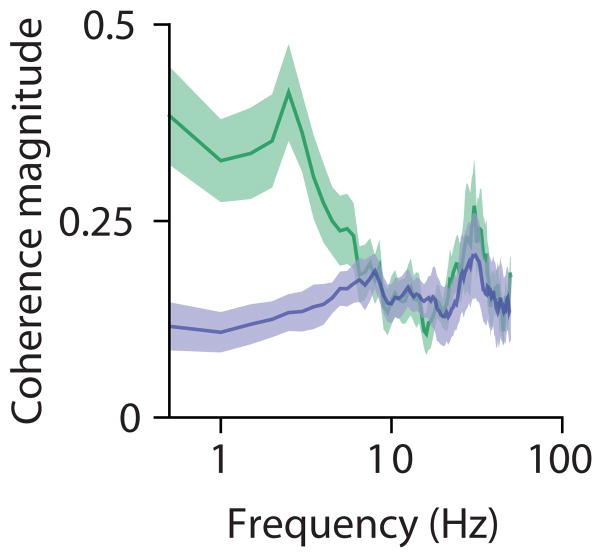
If, as our intracellular recordings suggest, visual stimulation shifts V1 towards an asynchronous state, there should be a concomitant reduction in the correlation between Vm and the surrounding network, as reflected in the simultaneously recorded nearby LFP. This was the case. During fixation with no visual stimulus, deflections indicating spontaneous increases in activity are evident in Vm and LFP (Fig. 4a, left, depolarization for Vm, downward deflections for LFP). These deflections are coincident in both signals (Fig. 4a asterisks); across our population, the zero-lag Vm-LFP cross-correlation was negative during blank trials, reflecting coincident activation of the network and individual neurons, (Fig. 4d, green, median cross-correlation = −0.24, Wilcoxon sign rank test, p<0.01). To determine whether visual stimulation alters this relationship we examined Vm-LFP correlations after trial averages were subtracted (Fig. 4b, c, centre panels). Correlations declined when drifting gratings were presented (Fig. 4b, c, and Fig. 4d; Wilcoxon sign rank test, p<0.01), such that the median cross-correlation was nearer zero (Fig. 4d, lavender; Wilcoxon sign rank test, p=0.91), providing further evidence that visual stimulation drives V1 towards an asynchronous state. The visually-evoked decline in Vm-LFP correlation was apparent for low frequency (0.5–4 Hz), but not high frequency fluctuations (Fig. 4e; Wilcoxon sign rank test, p<0.01 (0.5–4 Hz), p=0.13 (30–50 Hz)); Vm-LFP coherence decreased at low (0.5–4 Hz), but not high frequencies (30–50 Hz) (Fig. 4b, c, right; Fig. 4f; Wilcoxon sign rank test, p<0.05 (0.5–4 Hz), p=0.34 (30–50 Hz); see also Supplementary Sections 5 and Extended Data Fig. 7).
Figure 4. Magnitude of Vm-LFP cross-correlation decreases during visual stimulation.
a, 4 trials of Vm (black) with simultaneously recorded LFP (red) and eye position (thin, black traces) during the blank (left) and the preferred orientation (right) from 1 neuron. b–c, Vm and LFP from 4 trials with superimposed trial average (left panels); traces with trial-averages subtracted (middle panels); Vm-LFP cross-correlation functions and coherence magnitudes for blank (green) and stimulus (lavender) periods, and shuffled stimulus trials (grey); error bars: bootstrapped standard errors for cross-correlation functions and jackknifed 95% confidence intervals for coherence magnitudes (right); b, c are different neurons. d, Zero-lag Vm-LFP cross-correlation during visual stimulation (lavender) versus blank trials (green) for each neuron, and corresponding marginal histograms; medium and dark filled circles indicate cross-correlations that were respectively greater or less during visual stimulation than blank trials (Wilcoxon sign rank test, p<0.05). e, Zero-lag Vm-LFP cross correlation at low (0.5–4 Hz, blue) and high frequencies (30–50 Hz, orange). f, Root mean square Vm-LFP coherence magnitudes at low (0.5–4 Hz, blue) and high frequencies (30–50 Hz, orange).
Extended Data Figure 7. Vm-LFP coherence magnitude for blank trials and visual stimulation.
b, Population-averaged coherence magnitudes for blank trials (green) and at the preferred orientation (lavender). Error bars are jackknifed standard errors.
We have shown that in the absence of visual stimulation, V1 in alert behaving primates is not in an asynchronous high conductance state1–4. Rather, spontaneous Vm fluctuations are non-Gaussian and characterized by occasional excursions from rest, consistent with synaptic input arising from infrequent correlated events5,6. In our recordings, sensory stimulation drove V1 towards an asynchronous state, as visually-evoked Vm was closer to spike threshold, exhibited more Gaussian fluctuations, and became less correlated with low-frequency LFP. The visually-evoked reduction in correlation between Vm and LFP is consistent with previously reported decreases in spiking correlations23,24. In an analogous fashion, the correlated activity patterns observed in mouse sensory cortex14 during quiet wakefulness are disrupted by thalamic activation25. (See also Supplementary Sections 6, 7 and Extended Data Fig. 8.) Our records focused on activity in superficial cortical layers; membrane potential characteristics may differ across layers, potentially reflecting laminar specificity in network state26.
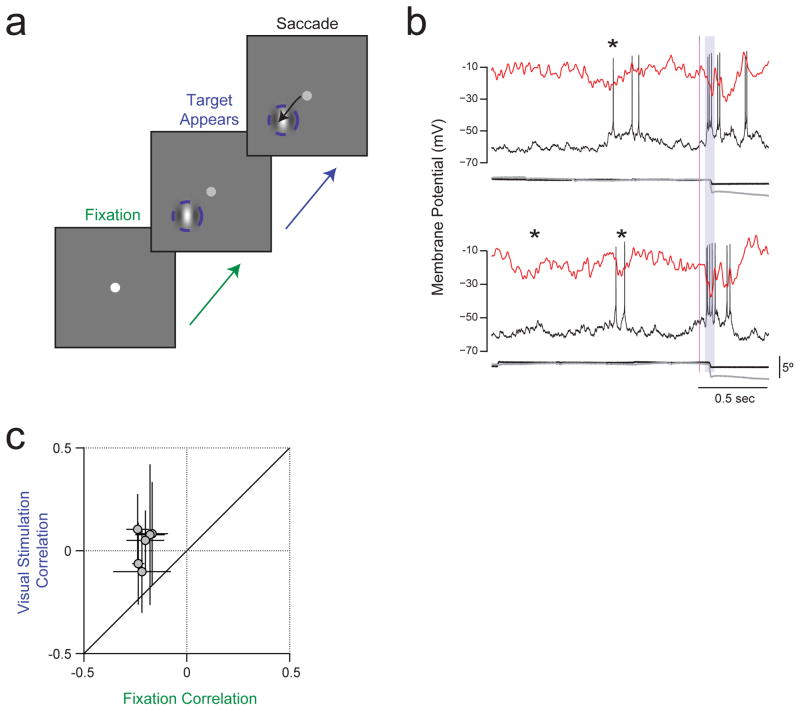
Extended Data Figure 8. Decreased magnitude of Vm-LFP correlation during a flashed stimulus in a visual saccade task.
a, Each trial began when a fixation spot was displayed at the centre of a monitor in front of the monkey. The monkey had to shift gaze to the fixation point and maintain tight fixation for at least 1500 ms. A flashed Gabor target stimulus appeared at a random time between 1000 ms and 1500 ms after the monkey established tight fixation. The monkey had to saccade to target stimulus within 600 ms to receive a reward. We analysed Vm and LFP only from trials in which the monkey performed the task successfully. b, Simultaneously recorded Vm and LFP, as well as eye movement traces, in 2 trials from an example neuron. Asterisks indicate near simultaneous deflections in Vm and LFP during the pre-stimulus fixation period. Grey shading indicates the analysis period for correlations during the flashed Gabor stimulus; we included 30 ms after saccade onset in this period, because the visual latency for spike responses in the lateral geniculate nucleus is greater than 30 ms. c, Zero-lag cross-correlation between Vm and LFP fluctuations from the trial average during the flashed Gabor versus during the pre-stimulus period.
How can cortical circuitry support synchronous and asynchronous states? One salient difference between the states was the amount of external input: without visual stimulation thalamic drive to cortex is weak, whereas visual stimulation activates those afferents. We propose that this difference in afferent drive explains the shift in network state. Our proposal unifies observation and theory: a lower input spike rate reduces synaptic input so that Vm lies further from threshold; postsynaptic potentials due to different sources are less likely to overlap in time and appear instead as distinct events. Crucially, theory indicates that a low thalamic spike rate destabilizes the asynchronous state towards low frequency correlations4,27,28, but higher thalamic spike rates drive the network towards an asynchronous state in which correlations weaken4,27,28, as observed in our data. It is clear that external drive alters the cortical state25, but internal factors also play an essential role. In extrastriate cortex, attention causes an increase in overall response that is also accompanied by a decline in the correlation between neurons29,30. Elucidating how these external and internal drives are synthesized will require understanding how V1 interacts with downstream areas.
ONLINE METHODS
All procedures were approved by the University of Texas Institutional Animal Care and Use Committee and conformed to National Institutes of Health standards. Our general experimental procedures in behaving macaque monkeys have been previously described in detail31,32.
Behavioral task and visual stimulus
Three adult male Macaque monkeys (Macaca mulatta) were trained to perform a visual fixation task in which gratings of different orientations were presented. Each trial began when a fixation spot was displayed at the centre of a monitor in front of the monkey. The monkey had to shift gaze to the fixation point and maintain fixation within a small window (< 2° full width) for at least 1500 ms to receive a reward. A drifting sinusoidal grating was presented at a randomized orientation for 1000 ms while the monkey was maintaining strict fixation, thus minimizing variability due to eye movements. (See Supplementary Section 8 and Supplementary Fig. 10 for characteristics of post-fixation saccades.)
Visual stimuli were presented on a gamma-corrected high-end 21 inch color display (Sony Trinitron GDM-F520) at a fixed mean luminance of 30 cd/m2. The display subtended 20.5° × 15.4° at a viewing distance of 108 cm and had a pixel resolution of 1024 × 768, 30-bit color depth, and a refresh rate of 100 Hz. Visual stimuli were generated using a high-end graphics card on a dedicated PC, using custom-designed software. Behavioral measurements and data acquisition were controlled by a PC running a software package for neurophysiological recordings from alert animals (Reflective Computing, St. Louis, MO, USA). Eye movements were measured using an infrared eye-tracking device (Dr. Bouis, Karlsruhe, Germany).
Whole cell recordings
Recording chambers were located on the dorsal portion of V1, with the anterior portion of the chamber reaching close to the lunate sulcus and the border between V1 and V2. We verified the retinotopic organization by voltage-sensitive dye imaging33, and by recording multiunit activity or local field potential with tungsten microelectrodes (Alpha Omega Co, Alpharetta, GA, USA; MicroProbes for Life Sciences, Gaithersburg, MD, USA). The cortex in our cranial windows represents stimuli that are approximately 2.5–5° away from the fovea in the lower quadrant of the contralateral hemifield.
Intracellular records of Vm18,34,35 were obtained with blind in vivo whole cell recordings19–22. The recording chamber was filled with 2–4% agarose in artificial cerebrospinal fluid. Intracellular records were from neurons in the top 1300 μm of V1. As a reference electrode, a silver–silver chloride wire was inserted into the agarose. The potential of the CSF was assumed to be uniform and equal to that of the reference electrode. Pipettes (6–12 MΩ) were pulled from 1.2 mm outer diameter, 0.70 mm inner diameter KG-33 borosilicate glass capillaries (King Precision Glass, Claremont, CA, USA) on a P-2000 micropipette puller (Sutter Instruments, Novato, CA, USA). Patch pipettes were filled with (in mM) 135 K-gluconate, 4 NaCl, 0.5 EGTA, 2 MgATP, 10 phosphocreatine disodium, and 10 HEPES, pH adjusted to 7.3 with KOH (Sigma–Aldrich, St. Louis, MO, USA). Whole cell current-clamp recordings were performed with an Axoclamp 2B Microelectrode Amplifier (Molecular Devices, Sunnyvale, CA, USA). We subtracted 7 mV from all raw membrane potential values to compensate for the liquid junction potential36. (See Supplementary Section 9 and Supplementary Fig. 11 for intrinsic properties of recorded neurons.)
Data Analysis
We analyzed Vm during the fixation period in trials on which the monkey performed the task successfully, and provided mean Vm in the absence of a visual stimulus was less than −50 mV. Vm was detrended by high pass filtering at 0.1 Hz. Data was analyzed with MATLAB (Mathworks, Natick, MA, USA). Shot noise contributions to Vm were assessed by the skewness6,38–40 of Vm distributions. Coherence estimates were performed with Chronux41, a MATLAB library freely available from http://chronux.org/.
Data Analysis for Supplementary Information
The relationship between spike rate and Vm was described with a threshold followed by a power law42–44: R= [θ(Vm−Vr)]α, where θ(x) is the Heaviside step function, Vr is the resting membrane potential, and α is the fitted exponent. Orientation selectivity was assessed with an orientation selectivity index45,46 (vector average = 1−circular variance). Temporal modulation was assessed with the Fourier component of the response with the same temporal frequency as the moving sinusoidal grating visual stimulus divided by the time averaged response47 (F1/F0). Simulations of Hodgkin-Huxley neurons used parameters adapted from Destexhe et al (2001)48 and Pospischil et al (2008)49, and were carried out with Brian50,51. We estimated membrane conductance from voltage responses to hyperpolarizing current pulses of constant amplitude, and a fit of a sum of two exponentials to the voltage response52: V(t) = Iinj[(RM(1−exp(−t/τM))) + (RE(1−exp(−t/τE))) ], where V is the voltage response, t is time, Iinj is injected current, RM is membrane resistance, τM is membrane time constant, RE is electrode resistance, and τE is electrode time constant. Membrane conductance is 1/RM.
Supplementary Material
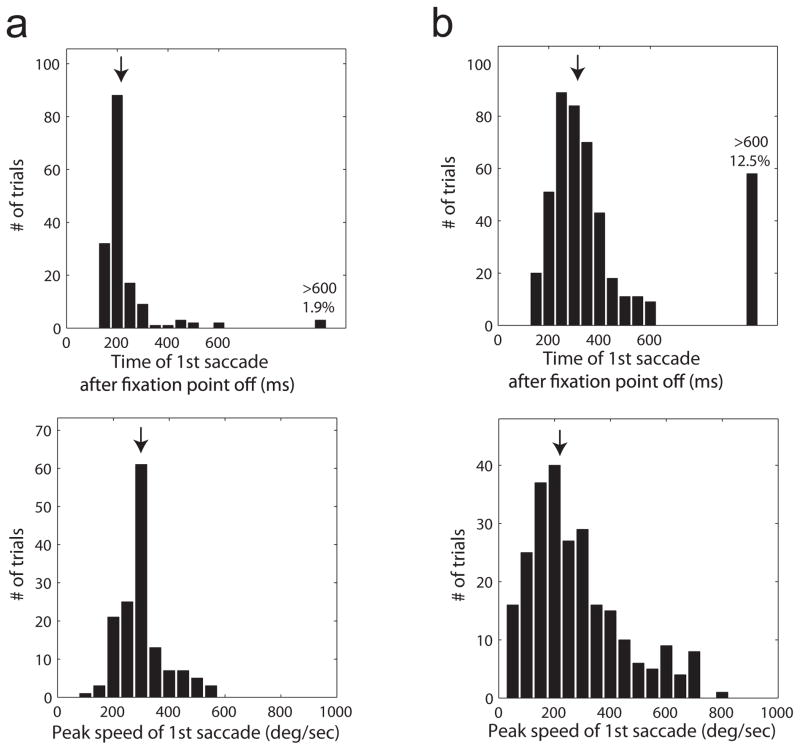
Extended Data Figure 9. Summary of first saccade latency and peak velocity in monkeys T and W which together contributed the majority of the recorded data.
a, Top panel: Histogram of latency of first saccade after fixation point termination in 3 neurons (158 trials) in monkey W. Arrow indicates median latency (217 ms). In 1.9% of the trials no saccade was detected in the 600 ms after fixation point termination. Bottom panel: Histogram of peak eye velocity for first saccades during the 600 ms after fixation point offset. Arrow indicates median peak velocity (292 deg/sec). b, Results from 8 neurons (464 trials) in monkey T. Same format as (a). Median latency is 314 ms and median peak velocity is 229 deg/sec. Monkey W tended to make larger saccade away from fixation while monkey T tended to make smaller saccade and in a small subset of the trials remained close to the fixation point location until the next trial was initiated. This may reflect the fact that the minimal inter-trial interval was shorted in monkey T than in monkey W. The short latency of the saccades following fixation point termination in the vast majority of the trials indicates that both monkeys were alert and attentive and were actively engaged in maintaining tight fixation.
Extended Data Figure 10. Regular-spiking neurons.
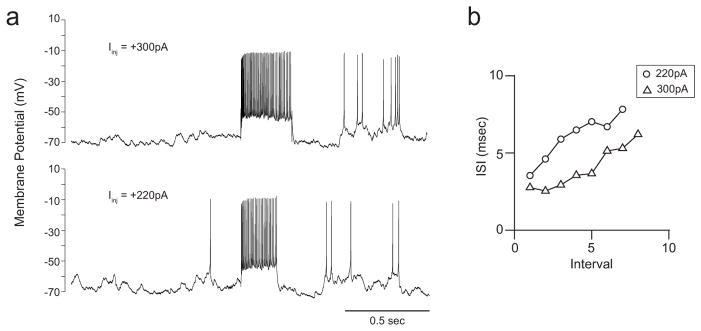
a, Vm response to injections of current steps of different magnitudes in an example neuron. b, Interspike interval during the current step versus interval ordinal. The interspike interval increased with interval ordinal, indicating that this neuron was regular-spiking.
Acknowledgments
We thank T. Cakic for assistance with this project. We are grateful to J. Hanover and D. Ferster for helpful discussions and comments. A.Y.Y.T., B.S. and N.J.P were supported by grants from the NIH (EY-019288) and The Pew Charitable Trusts; Y.C. and E.S were supported by grants from the NIH (EY-016454 and EY-16752).
Footnotes
Author Contributions
The study was initiated and designed by A.Y.Y.T., E.S. and N.J.P. A.Y.Y.T., Y.C., B.S.,E.S & N.J.P. collected the data. A.Y.Y.T., B.S.,Y.C. and N.J.P. analyzed and modeled the data. A.Y.Y.T., B.S.,Y.C., E.S. and N.J.P. discussed the findings and wrote the paper.
Competing financial interests
The authors declare no competing financial interests.
References
- 1.van Vreeswijk C, Sompolinsky H. Chaos in neuronal networks with balanced excitatory and inhibitory activity. Science. 1996;274:1724–1726. doi: 10.1126/science.274.5293.1724. [DOI] [PubMed] [Google Scholar]
- 2.van Vreeswijk C, Sompolinsky H. Chaotic balanced state in a model of cortical circuits. Neural Comput. 1998;10:1321–1371. doi: 10.1162/089976698300017214. [DOI] [PubMed] [Google Scholar]
- 3.Kumar A, Schrader S, Aertsen A, Rotter S. The high-conductance state of cortical networks. Neural Comput. 2008;20:1–43. doi: 10.1162/neco.2008.20.1.1. [DOI] [PubMed] [Google Scholar]
- 4.Renart A, et al. The asynchronous state in cortical circuits. Science. 2010;327:587–590. doi: 10.1126/science.1179850. [DOI] [PMC free article] [PubMed] [Google Scholar]
- 5.DeWeese MR, Zador AM. Non-Gaussian membrane potential dynamics imply sparse, synchronous activity in auditory cortex. J Neurosci. 2006;26:12206–12218. doi: 10.1523/JNEUROSCI.2813-06.2006. [DOI] [PMC free article] [PubMed] [Google Scholar]
- 6.Richardson MJ, Gerstner W. Synaptic shot noise and conductance fluctuations affect the membrane voltage with equal significance. Neural Comput. 2005;17:923–947. doi: 10.1162/0899766053429444. [DOI] [PubMed] [Google Scholar]
- 7.Rudolph M, Destexhe A. Characterization of subthreshold voltage fluctuations in neuronal membranes. Neural Comput. 2003;15:2577–2618. doi: 10.1162/089976603322385081. [DOI] [PubMed] [Google Scholar]
- 8.Tolhurst DJ, Movshon JA, Thompson ID. The dependence of response amplitude and variance of cat visual cortical neurones on stimulus contrast. Exp Brain Res. 1981;41:414–419. doi: 10.1007/BF00238900. [DOI] [PubMed] [Google Scholar]
- 9.Legenstein R, Pecevski D, Maass W. A learning theory for reward-modulated spike-timing-dependent plasticity with application to biofeedback. PLoS Comput Biol. 2008;4:e1000180. doi: 10.1371/journal.pcbi.1000180. [DOI] [PMC free article] [PubMed] [Google Scholar]
- 10.Thomson AM, Lamy C. Functional maps of neocortical local circuitry. Front Neurosci. 2007;1:19–42. doi: 10.3389/neuro.01.1.1.002.2007. [DOI] [PMC free article] [PubMed] [Google Scholar]
- 11.Steriade M, Timofeev I, Grenier F. Natural waking and sleep states: a view from inside neocortical neurons. J Neurophysiol. 2001;85:1969–1985. doi: 10.1152/jn.2001.85.5.1969. [DOI] [PubMed] [Google Scholar]
- 12.Destexhe A, Pare D. Impact of network activity on the integrative properties of neocortical pyramidal neurons in vivo. J Neurophysiol. 1999;81:1531–1547. doi: 10.1152/jn.1999.81.4.1531. [DOI] [PubMed] [Google Scholar]
- 13.Crochet S, Petersen CC. Correlating whisker behavior with membrane potential in barrel cortex of awake mice. Nat Neurosci. 2006;9:608–610. doi: 10.1038/nn1690. [DOI] [PubMed] [Google Scholar]
- 14.Poulet JF, Petersen CC. Internal brain state regulates membrane potential synchrony in barrel cortex of behaving mice. Nature. 2008;454:881–885. doi: 10.1038/nature07150. [DOI] [PubMed] [Google Scholar]
- 15.Okun M, Naim A, Lampl I. The subthreshold relation between cortical local field potential and neuronal firing unveiled by intracellular recordings in awake rats. J Neurosci. 2010;30:4440–4448. doi: 10.1523/JNEUROSCI.5062-09.2010. [DOI] [PMC free article] [PubMed] [Google Scholar]
- 16.Hromadka T, Zador AM, Deweese MR. Up states are rare in awake auditory cortex. J Neurophysiol. 2013;109:1989–1995. doi: 10.1152/jn.00600.2012. [DOI] [PMC free article] [PubMed] [Google Scholar]
- 17.Peyrache A, et al. Spatiotemporal dynamics of neocortical excitation and inhibition during human sleep. Proc Natl Acad Sci USA. 2012;109:1731–1736. doi: 10.1073/pnas.1109895109. [DOI] [PMC free article] [PubMed] [Google Scholar]
- 18.Matsumura M, Chen D, Sawaguchi T, Kubota K, Fetz EE. Synaptic interactions between primate precentral cortex neurons revealed by spike-triggered averaging of intracellular membrane potentials in vivo. J Neurosci. 1996;16:7757–7767. doi: 10.1523/JNEUROSCI.16-23-07757.1996. [DOI] [PMC free article] [PubMed] [Google Scholar]
- 19.Pei X, Volgushev M, Vidyasagar TR, Creutzfeldt OD. Whole cell recording and conductance measurements in cat visual cortex in-vivo. Neuroreport. 1991;2:485–488. doi: 10.1097/00001756-199108000-00019. [DOI] [PubMed] [Google Scholar]
- 20.Ferster D, Jagadeesh B. EPSP-IPSP interactions in cat visual cortex studied with in vivo whole-cell patch recording. J Neurosci. 1992;12:1262–1274. doi: 10.1523/JNEUROSCI.12-04-01262.1992. [DOI] [PMC free article] [PubMed] [Google Scholar]
- 21.Borg-Graham LJ, Monier C, Fregnac Y. Visual input evokes transient and strong shunting inhibition in visual cortical neurons. Nature. 1998;393:369–373. doi: 10.1038/30735. [DOI] [PubMed] [Google Scholar]
- 22.Hirsch JA, Alonso JM, Reid RC, Martinez LM. Synaptic integration in striate cortical simple cells. J Neurosci. 1998;18:9517–9528. doi: 10.1523/JNEUROSCI.18-22-09517.1998. [DOI] [PMC free article] [PubMed] [Google Scholar]
- 23.Kohn A, Smith MA. Stimulus dependence of neuronal correlation in primary visual cortex of the macaque. J Neurosci. 2005;25:3661–3673. doi: 10.1523/JNEUROSCI.5106-04.2005. [DOI] [PMC free article] [PubMed] [Google Scholar]
- 24.Nauhaus I, Busse L, Carandini M, Ringach DL. Stimulus contrast modulates functional connectivity in visual cortex. Nat Neurosci. 2009;12:70–76. doi: 10.1038/nn.2232. [DOI] [PMC free article] [PubMed] [Google Scholar]
- 25.Poulet JF, Fernandez LM, Crochet S, Petersen CC. Thalamic control of cortical states. Nat Neurosci. 2012;15:370–372. doi: 10.1038/nn.3035. [DOI] [PubMed] [Google Scholar]
- 26.de Kock CP, Sakmann B. Spiking in primary somatosensory cortex during natural whisking in awake head-restrained rats is cell-type specific. Proc Natl Acad Sci USA. 2009;106:16446–16450. doi: 10.1073/pnas.0904143106. [DOI] [PMC free article] [PubMed] [Google Scholar]
- 27.Brunel N. Dynamics of sparsely connected networks of excitatory and inhibitory spiking neurons. J Comput Neurosci. 2000;8:183–208. doi: 10.1023/a:1008925309027. [DOI] [PubMed] [Google Scholar]
- 28.Mehring C, Hehl U, Kubo M, Diesmann M, Aertsen A. Activity dynamics and propagation of synchronous spiking in locally connected random networks. Biol Cybern. 2003;88:395–408. doi: 10.1007/s00422-002-0384-4. [DOI] [PubMed] [Google Scholar]
- 29.Cohen MR, Maunsell JH. Attention improves performance primarily by reducing interneuronal correlations. Nat Neurosci. 2009;12:1594–1600. doi: 10.1038/nn.2439. [DOI] [PMC free article] [PubMed] [Google Scholar]
- 30.Mitchell JF, Sundberg KA, Reynolds JH. Spatial attention decorrelates intrinsic activity fluctuations in macaque area V4. Neuron. 2009;63:879–888. doi: 10.1016/j.neuron.2009.09.013. [DOI] [PMC free article] [PubMed] [Google Scholar]
- 31.Chen Y, Geisler WS, Seidemann E. Optimal decoding of correlated neural population responses in the primate visual cortex. Nat Neurosci. 2006;9:1412–1420. doi: 10.1038/nn1792. [DOI] [PMC free article] [PubMed] [Google Scholar]
- 32.Chen Y, Geisler WS, Seidemann E. Optimal temporal decoding of neural population responses in a reaction-time visual detection task. J Neurophysiol. 2008;99:1366–1379. doi: 10.1152/jn.00698.2007. [DOI] [PMC free article] [PubMed] [Google Scholar]
- 33.Yang Z, Heeger DJ, Seidemann E. Rapid and precise retinotopic mapping of the visual cortex obtained by voltage-sensitive dye imaging in the behaving monkey. J Neurophysiol. 2007;98:1002–1014. doi: 10.1152/jn.00417.2007.. [DOI] [PMC free article] [PubMed] [Google Scholar]
- 34.Matsumura M. Intracellular synaptic potentials of primate motor cortex neurons during voluntary movement. Brain Res. 1979;163:33–48. doi: 10.1016/0006-8993(79)90149-5. [DOI] [PubMed] [Google Scholar]
- 35.Chen D, Fetz EE. Characteristic membrane potential trajectories in primate sensorimotor cortex neurons recorded in vivo. J Neurophysiol. 2005;94:2713–2725. doi: 10.1152/jn.00024.2005. [DOI] [PubMed] [Google Scholar]
- 36.Margrie TW, Brecht M, Sakmann B. In vivo, low-resistance, whole-cell recordings from neurons in the anaesthetized and awake mammalian brain. Pflugers Arch. 2002;444:491–498. doi: 10.1007/s00424-002-0831-z. [DOI] [PubMed] [Google Scholar]
- 37.Richardson MJ, Gerstner W. Statistics of subthreshold neuronal voltage fluctuations due to conductance-based synaptic shot noise. Chaos. 2006;16:026106. doi: 10.1063/1.2203409. [DOI] [PubMed] [Google Scholar]
- 38.Richardson MJ, Swarbrick R. Firing-rate response of a neuron receiving excitatory and inhibitory synaptic shot noise. Phys Rev Lett. 2010;105:178102. doi: 10.1103/PhysRevLett.105.178102. [DOI] [PubMed] [Google Scholar]
- 39.Wolff L, Lindner B. Method to calculate the moments of the membrane voltage in a model neuron driven by multiplicative filtered shot noise. Phys Rev E. 2008;77:041913. doi: 10.1103/PhysRevE.77.041913. [DOI] [PubMed] [Google Scholar]
- 40.Mitra P, Bokil H. Observed brain dynamics. Oxford University Press; 2008. [Google Scholar]
- 41.Miller KD, Troyer TW. Neural noise can explain expansive, power-law nonlinearities in neural response functions. J Neurophysiol. 2002;87:653–659. doi: 10.1152/jn.00425.2001. [DOI] [PubMed] [Google Scholar]
- 42.Hansel D, van Vreeswijk C. How noise contributes to contrast invariance of orientation tuning in cat visual cortex. J Neurosci. 2002;22:5118–5128. doi: 10.1523/JNEUROSCI.22-12-05118.2002. [DOI] [PMC free article] [PubMed] [Google Scholar]
- 43.Priebe NJ, Mechler F, Carandini M, Ferster D. The contribution of spike threshold to the dichotomy of cortical simple and complex cells. Nat Neurosci. 2004;7:1113–1122. doi: 10.1038/nn1310. [DOI] [PMC free article] [PubMed] [Google Scholar]
- 44.Swindale NV. Orientation tuning curves: empirical description and estimation of parameters. Biol Cybern. 1998;78:45–56. doi: 10.1007/s004220050411. [DOI] [PubMed] [Google Scholar]
- 45.Ringach DL, Shapley RM, Hawken MJ. Orientation selectivity in macaque V1: diversity and laminar dependence. J Neurosci. 2002;22:5639–5651. doi: 10.1523/JNEUROSCI.22-13-05639.2002. [DOI] [PMC free article] [PubMed] [Google Scholar]
- 46.Skottun BC, et al. Classifying simple and complex cells on the basis of response modulation. Vision Res. 1991;31:1079–1086. doi: 10.1016/0042-6989(91)90033-2. [DOI] [PubMed] [Google Scholar]
- 47.Destexhe A, Rudolph M, Fellous JM, Sejnowski TJ. Fluctuating synaptic conductances recreate in vivo-like activity in neocortical neurons. Neuroscience. 2001;107:13–24. doi: 10.1016/s0306-4522(01)00344-x. [DOI] [PMC free article] [PubMed] [Google Scholar]
- 48.Pospischil M, et al. Minimal Hodgkin-Huxley type models for different classes of cortical and thalamic neurons. Biol Cybern. 2008;99:427–441. doi: 10.1007/s00422-008-0263-8. [DOI] [PubMed] [Google Scholar]
- 49.Goodman D, Brette R. Brian: a simulator for spiking neural networks in python. Front Neuroinform. 2008;2:5. doi: 10.3389/neuro.11.005.2008. [DOI] [PMC free article] [PubMed] [Google Scholar]
- 50.Goodman DF, Brette R. The brian simulator. Front Neurosci. 2009;3:192–197. doi: 10.3389/neuro.01.026.2009. [DOI] [PMC free article] [PubMed] [Google Scholar]
- 51.Anderson JS, Carandini M, Ferster D. Orientation tuning of input conductance, excitation, and inhibition in cat primary visual cortex. J Neurophysiol. 2000;84:909–926. doi: 10.1152/jn.2000.84.2.909. [DOI] [PubMed] [Google Scholar]
Associated Data
This section collects any data citations, data availability statements, or supplementary materials included in this article.


