
Fig. 7.
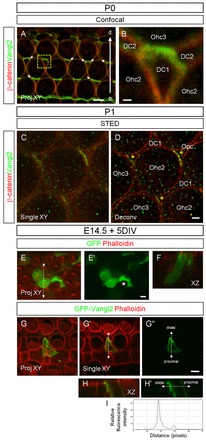
Vangl2 is enriched on the SC side at P0. (A ,B) Vangl2 (green) is asymmetrically accumulated at the junction between SC and HC (phalloidin, red). Arrows point to zones where SC membranes that are not in contact with a HC with strong Vangl2 enrichment. B shows a magnification of the boxed region in A. (C,D) STED microscopy (single plane view, XY) reveals numerous foci of Vangl2 expression and shows a strong enrichment of Vangl2 on the SC side. Asterisks indicate Vangl2 enrichment in SCs. D is the same image as in C after 3D deconvolution. (E-H′) Surface view projection (Proj XY), single plane view (single XY) and z-stack series (XZ) of the organ of Corti from rat cochlear cultures electroporated with GFP and GFP-Vangl2 constructs (left panels), and labeled with anti-GFP antibody (green) and phalloidin (red). (E-F) The empty vector expressing GFP alone fills the cytoplasm of transfected HCs and SCs (E′, asterisk). (G-H′) Full-length GFP-Vangl2 accumulates distally at the membrane of a SC. (H,H′) z-stack series along the dotted line in G′ and G″, respectively, showing the basolateral plasma membrane localization of GFP-Vangl2. (I) The corresponding line scan for GFP-Vangl2 expression along the dotted line in H′. Scale bars: in A,E-H′, 4 μm; in B, 0.5 μm; in C,D, 1 μm.