

Abstract
OBJECTIVE
Liver enzymes are independent predictors of type 2 diabetes. Although liver fat content correlates with features of insulin resistance, a risk factor for developing gestational diabetes mellitus (GDM), the relationship between liver enzymes and GDM is unclear. The objective of this study was to assess whether pregravid liver enzyme levels are associated with subsequent risk of GDM.
RESEARCH DESIGN AND METHODS
A nested case-control study was conducted among women who participated in the Kaiser Permanente Northern California multiphasic health checkup (1984–1996) and had a subsequent pregnancy (1984–2009). Case patients were 256 women who developed GDM. Two control subjects were selected for each case patient and matched for year of blood draw, age at examination, age at pregnancy, and number of intervening pregnancies.
RESULTS
Being in the highest quartile versus the lowest quartile of γ-glutamyl transferase (GGT) levels was associated with a twofold increased risk of subsequent GDM (odds ratio 1.97 [95% CI 1.14–3.42]), after adjusting for race/ethnicity, prepregnancy BMI, family history of diabetes, and alcohol use. This result was attenuated after adjusting for homeostasis model assessment of insulin resistance (HOMA-IR), fasting status, and rate of gestational weight gain. There was significant interaction between GGT and HOMA-IR; the association with GGT was found among women in the highest tertile of HOMA-IR. Aspartate aminotransferase and alanine aminotransferase were not associated with increased GDM risk.
CONCLUSIONS
Pregravid GGT level, but not alanine aminotransferase or aspartate aminotransferase level, predicted the subsequent risk of GDM. Markers of liver fat accumulation, such as GGT level, are present years before pregnancy and may help to identify women at increased risk for subsequent GDM.
Introduction
Gestational diabetes mellitus (GDM), defined as carbohydrate intolerance with first onset or recognition in pregnancy, affects 4–7% of women in the U.S. (1–3). GDM is associated with adverse perinatal outcomes and is a risk factor for the development of type 2 diabetes in both the mother and her offspring. Strategies to prevent GDM hold great potential as a means by which to prevent or delay the onset of diabetes. Insulin resistance and inadequate insulin response are two known mechanisms underlying the pathophysiology of both GDM and type 2 diabetes.
Laboratory tests for γ-glutamyl transferase (GGT), alanine aminotransferase (ALT), and aspartate aminotransferase (AST) are commonly performed to assess the overall health of the liver. Liver fat content has been shown to correlate with features of insulin resistance independent of BMI and abdominal obesity. While the gold standard for measuring nonalcoholic fatty liver disease is a liver biopsy, testing of ALT, AST, and GGT seems to provide reasonable noninvasive surrogate measures for use in epidemiologic studies (4). The liver is crucial to maintaining glucose homeostasis, both during fasting and postprandial states, and thereby plays a role in the development of type 2 diabetes. Serum GGT level is also a marker of oxidative stress (5,6). Oxidative stress is the condition of increased free radical activity and high lipid oxidation, and it plays a role in the etiology of type 2 diabetes by inducing insulin resistance in the peripheral tissues and impairing insulin secretion from the pancreatic β-cells (7,8). GGT catabolizes extracellular glutathione (GSH), which has an antioxidant function; therefore, GGT levels may become elevated in order to produce more GSH in response to oxidative stress (9).
Past research suggests that during a normal pregnancy, liver enzyme levels may change in response to the increased insulin resistance induced by pregnancy (10,11); therefore, it is important to determine whether prepregnancy levels of liver enzymes are related to subsequent risk of GDM, in order to clarify the temporal sequence of the association. Although liver enzymes are known to correlate with features of insulin resistance, a risk factor for the development of GDM, the relationship between prepregnancy liver enzyme levels and GDM is unclear. Thus, the aim of this case-control study is to examine the association between prepregnancy ALT, AST, and GGT levels and the risk of the subsequent development of GDM.
Research Design and Methods
The setting is Kaiser Permanente Northern California (KPNC), an integrated health care delivery system that provides medical care for about one-third of the underlying population in the San Francisco Bay Area. KPNC subscribers are representative of the region (12).
The source population consisted of female KPNC members who completed a voluntary multiphasic health checkup (MHC) at the Kaiser Permanente Oakland Medical Center between 1984 and 1996. KPNC members at this facility were invited to complete a comprehensive health checkup upon study enrollment. The MHC consisted of a clinic visit for the completion of questionnaires and clinical measurements, including blood pressure, weight, and serum glucose and cholesterol levels (measured in serum obtained from a random blood draw). An extra serum sample was collected and stored at −40°C for future use. The goal of the MHC was to provide health maintenance through early diagnosis (13). BMI was calculated as kilograms per square meter; height and weight were measured using a stadiometer and a balance beam scale, respectively. Information on age, sex, race/ethnicity, education level, cigarette smoking, family history of diabetes, medical history, alcohol consumption (≥1 vs. <1 drink/day), coffee consumption, use of medications, and hours since last food ingestion was collected using self-administered questionnaires (13). Serum glucose was measured in serum obtained from a random blood draw using the hexokinase method, and total cholesterol was assessed by the regional laboratory of KPNC at the time of the MHC using a Kodak Ektachem chemistry analyzer. This laboratory participates in the College of American Pathologists accreditation and monitoring program.
Among women 15–45 years of age (median age 34 years) who participated in the MHC from 1985 to 1996 (n = 27,743 with clinical and questionnaire data, as well as an extra serum sample), we identified 4,098 women who subsequently delivered an infant by 2010 by searching the KPNC hospitalization database and the Pregnancy Glucose Tolerance and GDM Registry (3), an active surveillance registry that annually identifies all pregnancies resulting in a livebirth or stillbirth among KPNC members. Women with recognized pregravid diabetes (14) are excluded from the GDM Registry; therefore, women in whom diabetes had been diagnosed prior to the index pregnancy were not eligible to be included in the study. The Pregnancy Glucose Tolerance and GDM Registry captures the results of all screening and diagnostic tests for GDM from the KPNC electronic laboratory database (data available since 1994).
Study Design
This is a nested case-control study, within a cohort of 4,098 women who took part in an MHC examination, had an extra tube of serum stored for future use, and had a subsequent pregnancy, on average, 7 years after the MHC examination. All cohort members in whom GDM subsequently developed were included as case patients; two control subjects were selected for each case patient from among women not meeting the GDM case definition.
GDM Case Definition
We identified 267 women with GDM according to the KPNC electronic databases. Case patients had either 1) glucose values obtained during a standard 100-g, 3-h oral glucose tolerance test (OGTT) that met the Carpenter-Coustan plasma glucose thresholds for GDM (as outlined by the American College of Obstetricians and Gynecologists) (15) in the laboratory database (n = 228), or 2) a hospital discharge diagnosis of GDM in the electronic hospital discharge database for pregnancies occurring before the electronic laboratory data were available (prior to 1994; n = 39). Standardized medical chart review was conducted by trained abstractors to confirm that these 267 women had 100-g, 3-h OGTT results meeting the Carpenter-Coustan criteria (15) for GDM (plasma glucose thresholds: fasting 5.3 mmol/L [95 mg/dL]; 1-h 10.0 mmol/L [180 mg/dL]; 2-h 8.6 mmol/L [155 mg/dL]; 3-h 7.8 mmol/L [140 mg/dL]). Case patients were excluded if, at the time of the MHC examination, they had a random glucose levels of >200 mg/dL (n = 6), no indication of GDM during the index pregnancy (n = 4), or they had impaired glucose tolerance with insufficient follow-up testing (n = 1), leaving a total of 256 confirmed cases of GDM.
Control Selection and Matching Criteria
Among women without an indication of GDM, control subjects were randomly selected; two control subjects were individually matched to each case patient based on the year of MHC serum collection date (±3 months), age at MHC serum collection (±2 years), the number of intervening pregnancies (0, 1, ≥2), and age at delivery of the index pregnancy (±2 years). We matched for the year of serum collection to account for any potential degradation in the quality of the serum over time, thereby assuring that the sample storage time was approximately the same for case patients and control subjects. Since GDM is more common in older women, we matched on age at serum collection and age at delivery. We matched on the number of pregnancies to account for any differences in pregnancies between the initial examination and the index pregnancy. Control subjects were excluded from the analysis if they had glucose values that were diagnostic of GDM found during medical chart abstraction (n = 5); an abnormal screening glucose level but no follow-up diagnostic glucose test (n = 5); or one abnormal glucose value on the diagnostic glucose test (n = 5), suggestive of “mild” GDM. Of the 512 matched control subjects identified, 497 were eligible.
Exposure Variables
Serum Biomarker Assays
Serum samples were thawed, aliquoted, and transported in batches on dry ice to the laboratory of Dr. Peter Havel at the University of California, Davis, for analysis. GGT, ALT, and AST were measured on a Poly-Chem analyzer (MedTest DX, Cortlandt Manor, NY). The intra-assay and interassay coefficients of variation were 4.7% and 5.6% (GGT), 4.5% and 11.7% (ALT), and 2.7% and 9.5% (AST), respectively. Insulin was measured with a radioimmunassay (Millipore). The intra-assay and interassay coefficients of variation were <4.0% and <10%, respectively. Insulin resistance was calculated based on the homeostasis model assessment of insulin resistance (HOMA-IR) using the following equation: (fasting glucose × fasting insulin)/22.5, where glucose was measured in millimoles per liter and insulin in milliunits per milliliter (16).
Rate of Gestational Weight Gain per Week
The rate of gestational weight gain per week was calculated as follows: (weight measured at or before the glucose screening test − prepregnancy weight)/weeks of gestation attained at the time of the weight measurement.
Statistical Analysis
Conditional logistic regression was used to obtain odds ratios (ORs) to estimate the relative risk of GDM in relation to prepregnancy GGT, ALT, and AST levels. Women were categorized by quartile of GGT, ALT, and AST levels, as defined among control subjects. Variables evaluated for confounding included race/ethnicity, pregravid BMI (in kilograms per square meter), parity, cigarette smoking, alcohol use, maternal education, and family history of diabetes, all assessed at the time of liver enzyme measurement. To examine the effect of weight gain during pregnancy up to the time of GDM diagnosis, we added this variable to the fully adjusted conditional logistic regression model.
To assess confounding, we entered covariates into a logistic regression model, one at a time, and compared the adjusted and unadjusted estimates. We included covariates that altered unadjusted estimates by ≥10%.
To assess the potential modifying effects of the prepregnancy tertile of HOMA-IR (dichotomized as ≥67th percentile vs. <67th percentile), prepregnancy BMI, racial/ethnic group, and time since MHC examination, we included appropriate cross-product (interaction) terms in regression models. This study was approved by the human subjects committee of the Kaiser Foundation Research Institute.
Results
Table 1 summarizes the demographic, anthropometric, reproductive, and metabolic characteristics of the study participants, by case/control status. Women in whom GDM developed were more likely to have <12 years of education, to be Asian or Hispanic, to have two or more children at the time of the MHC, to abstain from alcohol, and to have a family history of type 2 diabetes compared with women in whom GDM did not develop. Women in whom GDM developed also had higher levels of several cardiometabolic risk factors at the MHC examination, including BMI, serum glucose, total cholesterol, systolic and diastolic blood pressure, and serum insulin concentrations, and weight gain from the MHC examination to the index pregnancy. Mean prepregnancy GGT and ALT levels (in units per liter) were significantly higher in women in whom GDM developed, when compared with those in whom GDM did not develop (28.0 vs. 22.4 and 8.5 vs. 6.7 units/L, respectively; P value <0.001). The mean prepregnancy AST level was also higher among women in whom GDM developed versus those in whom it did not (13.9 vs. 11.8 units/L), although the difference was not significant.
Table 1.
Characteristics of case patients and control subjects
| Characteristics | GDM case patients (n = 256) | Control subjects (n = 497) | P value |
|---|---|---|---|
| Age at MHC examination | 28.2 ± 5.5 | 28.4 ± 5.2 | 0.78a |
| Age at delivery (years) | 35.4 ± 5.1 | 35.1 ± 4.9 | 0.43b |
| <30 | 39 (15.2) | 80 (16.1) | |
| 30–34 | 73 (28.5) | 145 (29.2) | |
| 35–39 | 102 (39.8) | 183 (36.8) | |
| ≥40 | 42 (16.4) | 89 (17.9) | |
| Time between examination and delivery | 7.1 ± 4.4 | 6.7 ± 4.4 | 0.21a |
| Education (years) | 0.24b | ||
| ≤12 | 74 (28.9) | 119 (23.9) | |
| 13–15 | 85 (33.2) | 157 (31.6) | |
| ≥16 | 92 (35.9) | 214 (43.1) | |
| Unknown | 5 (2.0) | 7 (1.4) | |
| Race/ethnicity | <0.001b | ||
| Non-Hispanic White | 50 (19.5) | 186 (37.4) | |
| African American | 91 (35.5) | 184 (37.0) | |
| Asian/Pacific Islander | 80 (31.3) | 84 (16.9) | |
| Hispanic | 35 (13.7) | 43 (8.7) | |
| Parity | <0.001b | ||
| 0 | 142 (55.5) | 278 (55.9) | |
| 1 | 47 (18.4) | 106 (21.3) | |
| ≥2 | 44 (17.2) | 70 (14.1) | |
| Unknown | 23 (9.0) | 43 (8.7) | |
| Gestational age at birth (weeks) | 0.01b | ||
| ≥37 | 218 (84.8) | 460 (90.7) | |
| <37 | 39 (15.2) | 39 (7.7) | |
| Large-for-gestational age at birthc | <0.01b | ||
| No | 198 (81.1) | 427 (89.5) | |
| Yes | 46 (18.9) | 50 (10.5) | |
| Alcohol use | <0.001b | ||
| None | 74 (28.9) | 81 (16.3) | |
| Occasional or more drinks/day | 149 (58.2) | 346 (69.6) | |
| Unknown | 33 (12.9) | 70 (14.1) | |
| Smoking | 0.40b | ||
| Never | 150 (58.6) | 277 (55.7) | |
| Former | 37 (14.5) | 92 (18.5) | |
| Current | 38 (14.8) | 61 (12.3) | |
| Unknown | 31 (12.1) | 67 (13.5) | |
| Hypertension status at index pregnancy | <0.001b | ||
| No hypertension | 138 (53.9) | 326 (65.5) | |
| Preexisting hypertensiond | 28 (10.9) | 18 (3.6) | |
| Gestational hypertension | 33 (12.9) | 68 (13.7) | |
| Preeclampsia | 42 (16.4) | 37 (7.4) | |
| Family history of diabetes | 151 (59.0) | 192 (38.6) | <0.001b |
| BMI (kg/m2) | 26.0 ± 6.5 | 23.7 ± 4.6 | <0.001a |
| Weight change from MHC to pregnancy (kg) | 8.9 ± 9.9 | 4.4 ± 8.2 | <0.001a |
| Rate of gestational weight gain (kg/week)e | 0.3 ± 0.2 | 0.4 ± 0.2 | <0.07a |
| Serum glucose (mg/dL) | 89.6 ± 13.5 | 83.6 ± 8.3 | <0.001a |
| Serum cholesterol (mg/dL) | 182.9 ± 33.2 | 176 ± 32.6 | <0.01a |
| Systolic blood pressure (mmHg) | 115.6 ± 14.7 | 113.3 ± 13.4 | <0.05a |
| Diastolic blood pressure (mmHg) | 69.9 ± 10.4 | 68.3 ± 9.0 | <0.05a |
| White blood cell count (1,000 cells per mm3) | 6.9 ± 1.9 | 6.5 ± 1.9 | <0.01a |
| GGT (units/L) | 28.0 ± 21.7 | 22.4 ± 16.6 | <0.001f |
| ALT (units/L) | 8.5 ± 9.5 | 6.7 ± 3.8 | <0.001f |
| AST (units/L) | 13.9 ± 25.3 | 11.8 ± 6.6 | 0.18f |
| HOMA-IR index | 4.1 ± 3.5 | 2.9 ± 2.9 | <0.001a |
| Insulin (µU/mL) | 25.8 ± 28.6 | 17.5 ± 16.7 | <0.001f |
Data are mean ± SD or N (%), unless otherwise indicated.
at Test to compare differences in mean values of continuous variables except as noted below for Wilcoxon test.
bχ2 Test for categorical variables.
cSubset of women with singleton births; large-for-gestational age >90th percentile based on race and gestational age-specific quantiles.
dIncludes women who experienced preeclampsia superimposed on preexisting hypertension.
eWeight change in kilograms per week from beginning of index pregnancy until screening glucose (measurement obtained 1 h after the 50-g oral challenge). Data were available for 235 case patients and 446 control subjects.
fWilcoxon test for differences in median values.
Table 2 shows the ORs and 95% CIs for risk of GDM determined by pregravid liver enzyme levels. The first model adjusted for race/ethnicity, BMI, family history of diabetes, and alcohol use at the time of the MHC. For GGT, there was a trend of increasing risk of GDM as the quartile increased. Being in the fourth versus the first quartile of GGT resulted in a twofold increase in the odds of the development of GDM, and the association was significant (OR 1.97 [95% CI 1.14–3.42]) (Table 2). After further adjusting for HOMA-IR (in tertiles), fasting status (≥6 h since the last food at the time of MHC examination), and rate of gestational weight gain (in tertiles) among the full cohort, the association was no longer significant (OR 1.57 [95% CI 0.84–2.93]). Similar results were found when restricted to women who were fasting for ≥6 h. We also conducted a sensitivity analysis excluding women who drank one or more alcoholic drinks per day at the time of the MHC examination, and the results were similar.
Table 2.
Association of GDM with prepregnancy ALT, AST, and GGT levels, from conditional logistic regression models
| Prepregnancy risk factor | Case patients (n = 256) | Control subjects (n = 497) | Conditional logistic regression models |
||
|---|---|---|---|---|---|
| Crude | Multivariable-adjusted1 | Multivariable-adjusted2 | |||
| ALT (units/L) | |||||
| Quartile 1 (0.5–3.9) | 44 (17.2) | 124 (25.0) | 1.00 | 1.00 | 1.00 |
| Quartile 2 (4.0–5.9) | 61 (23.8) | 124 (25.0) | 0.90 (0.55–1.47) | 0.79 (0.45–1.39) | 0.80 (0.43–1.50) |
| Quartile 3 (6.0–8.4) | 70 (27.3) | 124 (25.0) | 1.25 (0.76–2.04) | 1.04 (0.59–1.82) | 1.18 (0.62–2.23) |
| Quartile 4 (8.5–35.0) | 81 (31.6) | 125 (25.0) | 1.55 (0.92–2.59) | 1.10 (0.61–1.99) | 1.12 (0.57–2.23) |
| AST (units/L) | |||||
| Quartile 1 (2.0–7.9) | 73 (28.5) | 124 (25.0) | 1.00 | 1.00 | 1.00 |
| Quartile 2 (8.0–10.4) | 53 (20.7) | 124 (25.0) | 0.63 (0.40–0.97) | 0.47 (0.28–0.79) | 0.38 (0.21–0.68) |
| Quartile 3 (10.5–14.4) | 58 (22.7) | 124 (25.0) | 0.73 (0.45–1.18) | 0.62 (0.36–1.07) | 0.51 (0.27–0.96) |
| Quartile 4 (14.5–92.0) | 72 (28.1) | 125 (25.0) | 0.84 (0.48–1.45) | 0.59 (0.31–1.11) | 0.53 (0.25–1.13) |
| GGT (units/L) | |||||
| Quartile 1 (8.0–13.4) | 37 (14.5) | 124 (25.0) | 1.00 | 1.00 | 1.00 |
| Quartile 2 (13.5–17.9) | 47 (18.4) | 124 (25.0) | 1.41 (0.84–2.36) | 1.28 (0.73–2.25) | 1.20 (0.63–2.26) |
| Quartile 3 (18.0–24.9) | 74 (28.9) | 124 (25.0) | 2.03 (1.23–3.37) | 1.72 (0.99–2.97) | 1.55 (0.84–2.87) |
| Quartile 4 (25.0–173.0) | 98 (38.3) | 125 (25.0) | 2.91 (1.77–4.77) | 1.97 (1.14–3.42) | 1.57 (0.84–2.93) |
Data are n (%) or OR (95% CI).
1Adjusted for race/ethnicity, prepregnancy BMI, family history of diabetes, and alcohol use at time of the MHC examination (one or more vs. less than one drink/day).
2Further adjusted for HOMA-IR (in tertiles), fasting status (defined as ≥6 h since ingestion of the last food at the time of the MHC examination), and rate of gestational weight gain up to screening test (in tertiles).
HOMA-IR was calculated both in women who had fasted for at least 6 h (n = 419) and in those who had not fasted (n = 306). There were no significant differences by fasting status in correlations between HOMA-IR and BMI, GGT, ALT, AST, and glucose levels. Among women who were fasting, the correlations between HOMA-IR and the liver enzymes were as follows: GGT r = 0.32, P < 0.0001; AST r = 0.10, P = 0.05; and ALT r = 0.22, P < 0.0001. Among women who were not fasting, the correlations between HOMA-IR and the liver enzymes were as follows: GGT r = 0.16, P < 0.01; AST r = 0.09, P = 0.12; and ALT r = 0.18, P < 0.01. While women who were not fasting for ≥6 h had higher HOMA-IR levels, there remained a significant difference between case patients and control subjects ([mean ± SD] women fasting <6 h: case patients 9.0 ± 11.5; control subjects 4.5 ± 3.8; P < 0.001; women fasting ≥6 h: case patients 4.1 ± 3.5; control subjects 2.9 ± 2.9; P < 0.001); therefore, we chose to include everyone in the analytic cohort regardless of fasting status.
Neither ALT nor AST was associated with an increased risk of GDM, and no clear trend was observed. The interaction between BMI and race/ethnicity did not reach statistical significance.
Figure 1 displays the ORs for GDM stratified by prepregnancy tertile of HOMA-IR, dichotomized (≥67th percentile vs. <67th percentile). There was significant interaction by prepregnancy HOMA-IR (P = 0.082), and the associations with being in the top three quartiles of GGT level were stronger for women in the highest tertile of HOMA-IR (≥67th percentile) before pregnancy (Quartile 2 OR 2.71 [95% CI 1.05–7.01]; Quartile 3 3.78 [1.42–10.08]; and Quartile 4 4.93 [1.93–12.60] vs. Quartile 1 1.00). No significant associations were observed among women in the lower two tertiles of HOMA-IR.
Figure 1.
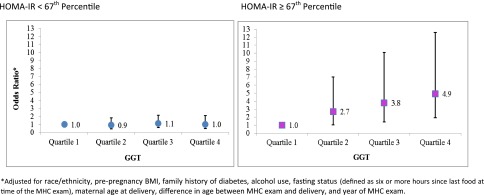
ORs for association between pregravid liver enzyme levels and HOMA-IR and the risk of GDM.
Figure 2 displays the ORs for GDM stratified by prepregnancy BMI, dichotomized (BMI ≥25 vs. <25 kg/m2). There was increasing risk of GDM as the tertile of GGT increased, and being in the highest tertile of GGT with a prepregnancy BMI of <25 kg/m2 resulted in the greatest risk of GDM (OR 2.44 [95% CI 1.23–4.83]).
Figure 2.
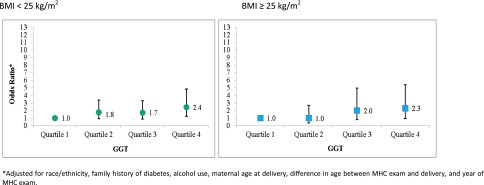
ORs for association between pregravid liver enzyme levels and BMI and the risk of GDM.
Conclusions
In this case-control study, pregravid GGT, but not ALT or AST, was found to be associated with an increased risk of the development of GDM. The association appeared to be moderated by increased insulin resistance, and in the stratified analysis, it was present only among women who were in the top tertile of HOMA-IR before pregnancy.
Our findings with GGT are consistent with previous research examining liver enzymes and type 2 diabetes. Several cohort studies have found that higher GGT levels predict the development of type 2 diabetes (17–22). The association between GGT and type 2 diabetes has been found to have a dose-response relationship (19,21) and to be independent of known risk factors for diabetes (17,20). One study (23) found that GGT concentrations were independently associated with the risk of prediabetes and were positively associated with insulin resistance. Few studies have examined liver enzyme levels during pregnancy in relation to GDM risk, and findings have been inconsistent. In a study of 2,610 women in Malaysia in 2012 (24), GGT, ALT, and AST levels were measured at the time of the 50-g glucose challenge test, prior to the 2-h, 75-g OGTT. The study found no association between the levels of pregnancy liver enzymes and the risk of GDM. Another study (25) assessed GGT levels at the time of the OGTT and found that they were positively correlated with the 2-h glucose level. Additionally, increased GGT level was significantly associated with GDM risk in the multivariable logistic regression analysis. The authors of the two aforementioned studies justified the use of liver enzymes levels during pregnancy (on average, up to 2 weeks before the OGTT) for the purpose of predicting the development of GDM, given that elevated transaminase levels are a chronic reflection of diabetes risk, “predictive of events sometimes years ahead” (24). To our knowledge, no study other than the current study has examined the association between prepregnancy liver enzyme levels and GDM. Liver enzyme levels are relatively inexpensive to measure and can be used to identify women who are at risk for the development of GDM.
Among patients without hepatitis, increased levels of GGT indicate deposition of excess fat in the liver (26), which is known to be characterized by insulin resistance (23). Some researchers speculate that elevations in liver enzyme levels may reflect an underlying insulin resistance that is localized to the liver, independent of peripheral insulin sensitivity or resistance (23). A 2011 study by Bonnet et al. (27) found that increased plasma GGT level, even within the normal reference range, was a biomarker of both systemic and hepatic insulin resistance, as well as increased insulin secretion and decreased hepatic insulin clearance among both healthy men and women in a nonpregnant, nondiabetic state. The authors concluded that even a minimal increase in GGT level could serve as an indirect marker of enhanced hepatic insulin resistance and impaired glucose disposal in skeletal muscles (27). Our finding that elevated pregravid GGT levels resulted in an increased risk of GDM, to a greater degree among women in the highest tertile of HOMA-IR, lends support to the hypothesis that insulin resistance underlies this association. Additionally, elevated GGT level could be a response to oxidative stress, which plays a critical role in the pathogenesis of diabetes by impairing insulin secretion. Elevations in GGT, thought to be produced in part as a result of oxidative stress, result in increased transport of the tripeptide GSH into cells, where it can protect the cells from oxidative damage (28). It is thought that GGT level may also be a marker of exposure to certain environmental pollutants. Lee et al. (29) hypothesize that persistent organic pollutants may reside in adipose tissue and act as endocrine disruptors, and the persistent organic pollutants may further interact with obesity to impact diabetes risk. GGT activity could reflect the formation of GSH conjugates during xenobiotic metabolism. The authors recommend prospective studies and toxicological studies to test their hypotheses.
In the current study, neither ALT nor AST was associated with GDM. AST is present throughout the body and levels can be elevated in a multitude of clinical disorders (30); it has also not been consistently associated with diabetes (24). ALT is found primarily in the liver and is thought to be a marker of liver fat accumulation (31). The lack of association between ALT level and GDM in the current study is surprising, given that ALT has been considered a marker of risk for the development of type 2 diabetes (24); however, several studies have found no association between ALT and type 2 diabetes (32,33). Additionally, a 2013 meta-analysis (34) concluded that associations of liver aminotransferase levels and type 2 diabetes risk appear to have been overestimated in previous studies. It is possible that the lack of association is due to the relatively younger age of our study participants, as older age may be a risk factor for increased susceptibility to certain liver diseases. Alternatively, the lack of association may be due to a different mechanistic effect of ALT in the development of GDM and type 2 diabetes. Further studies are needed.
The strengths of this study include our ability to exclude women with glucose values indicative of recognized pregestational diabetes. We had the unique ability to look at liver enzyme levels measured, on average, 7 years before pregnancy in a large number of GDM case patients and matched control subjects in a diverse cohort. Assessing the liver enzyme concentrations before pregnancy is vital to establishing the temporal sequence of the association between liver enzymes and GDM, particularly given the fact that liver enzyme concentrations may change during pregnancy, in part due to increases in sex steroid levels, which affect metabolic and hepatic functions (10). While strong evidence links elevated liver enzyme concentrations to insulin resistance, it is unclear which one is the antecedent, and this represents an avenue on which future studies should focus. The study was limited by the lack of data on hepatic insulin resistance, liver fat content, and body fat mass and distribution; the latter might have provided insight as to whether the association between GGT and GDM was mediated by visceral fat. Past research indicates that fatty liver is associated with insulin resistance and inflammation in women with a history of GDM, and higher levels of biomarkers (as measured by a validated fatty liver index) estimating excess liver fat in these women was associated with an increased risk of the development of type 2 diabetes within 10 years of follow-up (35). This supports the hypothesis that excess liver fat is one potential biologic mechanism explaining the association between GGT and GDM.
Based on our findings, the liver enzyme GGT, which is known to be associated with an increased risk of the development of type 2 diabetes, appears to also be associated with subsequent GDM, which is characterized by decreased insulin sensitivity and increased insulin resistance. This study, which is, to our knowledge, the first of its kind, demonstrates that elevations in GGT levels may be present many years before a pregnancy characterized by GDM. Monitoring GGT levels before pregnancy may help to identify women who are at increased risk for the subsequent development of GDM.
Article Information
Acknowledgments. The authors thank Monica Highbaugh, Mamie Ford, and Jean Lee, all from Kaiser Permanente Northern California, Division of Research, for their help in reviewing medical records.
Funding. A.F. was supported by National Institutes of Health grant P30-DK-092924. This research was also supported by Eunice Kennedy Shriver National Institute of Child Health and Human Development grant R01-HD-065904 to M.M.H.
Duality of Interest. No potential conflicts of interest relevant to this article were reported.
Author Contributions. S.B.S. assisted with data collection and wrote and edited the manuscript. F.X. and J.D. conducted the data analysis and contributed to the writing of the manuscript. C.P.Q. contributed to the study design, provided statistical expertise, and contributed to the writing of the manuscript. A.F. designed the study and edited the manuscript. M.M.H. designed the study, oversaw the data collection, and wrote and edited the manuscript. M.M.H. is the guarantor of this work and, as such, had full access to all the data in the study and takes responsibility for the integrity of the data and the accuracy of the data analysis.
Prior Presentation. Parts of this study were presented in abstract form at the 7th International Symposium on Diabetes, Hypertension, Metabolic Syndrome, and Pregnancy, Florence, Italy, 14–16 March 2013.
References
- 1.Metzger BE. Summary and recommendations of the Third International Workshop-Conference on Gestational Diabetes Mellitus. Diabetes 1991;40(Suppl. 2):197–201 [DOI] [PubMed] [Google Scholar]
- 2.American Diabetes Association Gestational diabetes mellitus. Diabetes Care 2000;23(Suppl. 1):S77–S79 [PubMed] [Google Scholar]
- 3.Ferrara A, Kahn HS, Quesenberry CP, Riley C, Hedderson MM. An increase in the incidence of gestational diabetes mellitus: Northern California, 1991-2000. Obstet Gynecol 2004;103:526–533 [DOI] [PubMed] [Google Scholar]
- 4.Clark JM, Diehl AM. Defining nonalcoholic fatty liver disease: implications for epidemiologic studies. Gastroenterology 2003;124:248–250 [DOI] [PubMed] [Google Scholar]
- 5.Kugelman A, Choy HA, Liu R, Shi MM, Gozal E, Forman HJ. gamma-Glutamyl transpeptidase is increased by oxidative stress in rat alveolar L2 epithelial cells. Am J Respir Cell Mol Biol 1994;11:586–592 [DOI] [PubMed] [Google Scholar]
- 6.Lieberman MW, Barrios R, Carter BZ, et al. gamma-Glutamyl transpeptidase. What does the organization and expression of a multipromoter gene tell us about its functions? Am J Pathol 1995;147:1175–1185 [PMC free article] [PubMed] [Google Scholar]
- 7.Oberley LW. Free radicals and diabetes. Free Radic Biol Med 1988;5:113–124 [DOI] [PubMed] [Google Scholar]
- 8.Ceriello A, Motz E. Is oxidative stress the pathogenic mechanism underlying insulin resistance, diabetes, and cardiovascular disease? The common soil hypothesis revisited. Arterioscler Thromb Vasc Biol 2004;24:816–823 [DOI] [PubMed] [Google Scholar]
- 9.Zhang H, Forman HJ, Choi J. Gamma-glutamyl transpeptidase in glutathione biosynthesis. Methods Enzymol 2005;401:468–483 [DOI] [PubMed] [Google Scholar]
- 10.Bacq Y, Zarka O, Bréchot JF, et al. Liver function tests in normal pregnancy: a prospective study of 103 pregnant women and 103 matched controls. Hepatology 1996;23:1030–1034 [DOI] [PubMed] [Google Scholar]
- 11.Moniz CF, Nicolaides KH, Bamforth FJ, Rodeck CH. Normal reference ranges for biochemical substances relating to renal, hepatic, and bone function in fetal and maternal plasma throughout pregnancy. J Clin Pathol 1985;38:468–472 [DOI] [PMC free article] [PubMed] [Google Scholar]
- 12.Go AS, Hylek EM, Phillips KA, et al. Prevalence of diagnosed atrial fibrillation in adults: national implications for rhythm management and stroke prevention: the AnTicoagulation and Risk Factors in Atrial Fibrillation (ATRIA) Study. JAMA 2001;285:2370–2375 [DOI] [PubMed] [Google Scholar]
- 13.Collen MF. Multiphasic Health Testing Services. New York, John Wiley & Sons, 1978 [Google Scholar]
- 14.Selby JV, Ray GT, Zhang D, Colby CJ. Excess costs of medical care for patients with diabetes in a managed care population. Diabetes Care 1997;20:1396–1402 [DOI] [PubMed] [Google Scholar]
- 15.Committee opinion no. 504: screening and diagnosis of gestational diabetes mellitus. Obstet Gynecol 2011;118:751–753 [DOI] [PubMed] [Google Scholar]
- 16.Matthews DR, Hosker JP, Rudenski AS, Naylor BA, Treacher DF, Turner RC. Homeostasis model assessment: insulin resistance and beta-cell function from fasting plasma glucose and insulin concentrations in man. Diabetologia 1985;28:412–419 [DOI] [PubMed] [Google Scholar]
- 17.Doi Y, Kubo M, Yonemoto K, et al. Liver enzymes as a predictor for incident diabetes in a Japanese population: the Hisayama study. Obesity (Silver Spring) 2007;15:1841–1850 [DOI] [PubMed] [Google Scholar]
- 18.Perry IJ, Wannamethee SG, Shaper AG. Prospective study of serum gamma-glutamyltransferase and risk of NIDDM. Diabetes Care 1998;21:732–737 [DOI] [PubMed] [Google Scholar]
- 19.Lee DH, Ha MH, Kim JH, et al. Gamma-glutamyltransferase and diabetes—a 4 year follow-up study. Diabetologia 2003;46:359–364 [DOI] [PubMed] [Google Scholar]
- 20.Lee DH, Silventoinen K, Jacobs DR, Jr, Jousilahti P, Tuomileto J. gamma-Glutamyltransferase, obesity, and the risk of type 2 diabetes: observational cohort study among 20,158 middle-aged men and women. J Clin Endocrinol Metab 2004;89:5410–5414 [DOI] [PubMed] [Google Scholar]
- 21.Lee DH, Jacobs DR, Jr, Gross M, et al. Gamma-glutamyltransferase is a predictor of incident diabetes and hypertension: the Coronary Artery Risk Development in Young Adults (CARDIA) Study. Clin Chem 2003;49:1358–1366 [DOI] [PubMed] [Google Scholar]
- 22.Nakanishi N, Suzuki K, Tatara K. Serum gamma-glutamyltransferase and risk of metabolic syndrome and type 2 diabetes in middle-aged Japanese men. Diabetes Care 2004;27:1427–1432 [DOI] [PubMed] [Google Scholar]
- 23.Gao F, Pan JM, Hou XH, et al. Liver enzymes concentrations are closely related to prediabetes: findings of the Shanghai Diabetes Study II (SHDS II). Biomed Environ Sci 2012;25:30–37 [DOI] [PubMed] [Google Scholar]
- 24.Tan PC, Aziz AZ, Ismail IS, Omar SZ. Gamma-glutamyltransferase, alanine transaminase and aspartate transaminase levels and the diagnosis of gestational diabetes mellitus. Clin Biochem 2012;45:1192–1196 [DOI] [PubMed] [Google Scholar]
- 25.Tan PC, Mubarak S, Omar SZ. Gamma-glutamyltransferase level in pregnancy is an independent risk factor for gestational diabetes mellitus. J Obstet Gynaecol Res 2008;34:512–517 [DOI] [PubMed] [Google Scholar]
- 26.Inoue K, Matsumoto M, Miyoshi Y, Kobayashi Y. Elevated liver enzymes in women with a family history of diabetes. Diabetes Res Clin Pract 2008;79:e4–e7 [DOI] [PubMed] [Google Scholar]
- 27.Bonnet F, Ducluzeau PH, Gastaldelli A, et al. RISC Study Group Liver enzymes are associated with hepatic insulin resistance, insulin secretion, and glucagon concentration in healthy men and women. Diabetes 2011;60:1660–1667 [DOI] [PMC free article] [PubMed] [Google Scholar]
- 28.McLennan SV, Heffernan S, Wright L, et al. Changes in hepatic glutathione metabolism in diabetes. Diabetes 1991;40:344–348 [DOI] [PubMed] [Google Scholar]
- 29.Lee DH, Steffes MW, Jacobs DR., Jr Can persistent organic pollutants explain the association between serum gamma-glutamyltransferase and type 2 diabetes? Diabetologia 2008;51:402–407 [DOI] [PubMed] [Google Scholar]
- 30.Nathwani RA, Pais S, Reynolds TB, Kaplowitz N. Serum alanine aminotransferase in skeletal muscle diseases. Hepatology 2005;41:380–382 [DOI] [PubMed] [Google Scholar]
- 31.Tiikkainen M, Bergholm R, Vehkavaara S, et al. Effects of identical weight loss on body composition and features of insulin resistance in obese women with high and low liver fat content. Diabetes 2003;52:701–707 [DOI] [PubMed] [Google Scholar]
- 32.Nannipieri M, Gonzales C, Baldi S, et al. Mexico City Diabetes Study Liver enzymes, the metabolic syndrome, and incident diabetes: the Mexico City diabetes study. Diabetes Care 2005;28:1757–1762 [DOI] [PubMed] [Google Scholar]
- 33.Schindhelm RK, Dekker JM, Nijpels G, Heine RJ, Diamant M. No independent association of alanine aminotransferase with risk of future type 2 diabetes in the Hoorn study. Diabetes Care 2005;28:2812. [DOI] [PubMed] [Google Scholar]
- 34.Kunutsor SK, Apekey TA, Walley J. Liver aminotransferases and risk of incident type 2 diabetes: a systematic review and meta-analysis. Am J Epidemiol 2013;178:159–171 [DOI] [PubMed] [Google Scholar]
- 35.Bozkurt L, Göbl CS, Tura A, et al. Fatty liver index predicts further metabolic deteriorations in women with previous gestational diabetes. PLoS One 2012;7:e32710. [DOI] [PMC free article] [PubMed] [Google Scholar]