

Summary
Background
Manganese (Mn) is a well-known toxic agent causing symptoms of parkinsonism in employees of certain branches of industry. Home production of a psychostimulant ephedrone (methcathinone), involving the use of potassium permanganate, became a new cause of intoxications in Poland.
Case Report
This article presents clinical symptoms, initial brain MRI findings and characteristics of changes observed in follow-up examinations in 4 patients with manganese intoxication associated with intravenous administration of ephedrone. All patients in our case series presented symptoms of parkinsonism. T1-WI MRI revealed high intensity signal in globi pallidi in all patients; hyperintense lesions in midbrain were observed in three patients, while lesions located in cerebellar hemispheres and pituitary gland in just one patient. The reduction of signal intensity in the affected brain structures was observed in follow-up studies, with no significant improvement in clinical symptoms.
Conclusions
Brain MRI is helpful in the assessment of distribution as well as dynamics of changes in ephedrone encephalopathy. Regression of signal intensity changes visible in brain MRI is not associated with clinical condition improvement. Although brain MRI findings are not characteristic for ephedrone encephalopathy, they may contribute to diagnosing this condition.
Keywords: Brain Diseases, Metabolic - ultrasonography, Manganese Compounds
Background
Manganese (Mn) has been known as a toxic agent for many years. In the past, it caused intoxication in metallurgical industry workers chronically exposed to high levels of this metal at work [1]. Neurotoxic effects of Mn are manifested as emotional disorders, sleep disorders and later on as parkinsonism. Brain MRI obtained in patients reveals symmetrical signal intensity increase in globi pallidi on T1-weighted images [2]. In recent years the issue of Mn intoxications once again has gained in importance. Currently, the group at risk are drug addicts. Home production of a psychostimulant – ephedrone (methcathinone) – became a new source of Mn intoxications in Poland. The preparation of the drug involves the use of pseudoephedrine and excess potassium permanganate, with the resulting mixture being injected intravenously. The first report of Mn intoxications in substance-dependent individuals was published more than 20 years ago in Russia [3]. Within the last few years literature reported cases of ephedrone encephalopathy in Eastern Europe [4], Western Europe and Canada [5,6]. Clinical presentation of few patients intoxicated with Mn from this source was also reported in Poland [7,8]. In our study we analyze lesions observed in brain MRI in a series of patients with ephedrone encephalopathy. The goal of this article is to present a typical brain MRI pattern as a result of chronic intravenous Mn injections, the dynamics of lesions in the follow-up period and correlation with clinical symptoms. An additional goal is to raise the awareness among radiologists with regard to a new potential source of Mn intoxications in Poland.
Case Reports
Between December 2011 and September 2012 eight patients abusing ephedrone were admitted to Neurology Clinic in the Institute of Psychiatry and Neurology. The direct reason for their admission in all cases was the onset of parkinsonism symptoms. Only 4 patients in this group underwent initial and follow-up brain MRI and continued the treatment. Retrospective analysis of obtained brain MRI examinations and available clinical data from the group consisting of two women (aged 27 and 28) and two men (aged 34 and 36) was carried out. Each patient admitted taking intravenous ephedrone injections for at least 5 months. In addition, they all reported at least several years of abusing other psychoactive substances. Patients were experiencing neurological symptoms of approximate time of duration between 4 and 14 months. Clinical examination revealed balance disorders, dysarthria, apraxia, high-stepping gait as well as a number of extra pyramidal symptoms (bradykinesis, hypomimia, facial dystopia, micrography) and, to a minor extent, tremor. Laboratory analyses revealed elevated serum Mn levels exceeding 2.0 μg/L (normal range 0.3–0.9 μg/L) in all patients. In addition, elevated activity of hepatic enzymes, i.e. AST and ALT, was detected in one patient and anti-HCV antibodies in three of them. Detailed clinical data are collected in Table 1.
Table 1.
Patients’ clinical data. Intensity of neurological symptoms: (+) mild, (++) moderate, (+++) severe.
| Age/gender | Duration of symptoms | Main symptoms (intensity) | Reduction of symptoms | Anti-HCV | ALT/AST | Symptomatic treatment | |
|---|---|---|---|---|---|---|---|
| Patient WM | 27/F | 4 months | Balance disorders (+) Hypomimia (+) |
None | − | Not examined | Levodopa |
| Patient FP | 34/M | 14 months | Balance disorders (+++) Dysarthria (+++) High-stepping gait (++) |
None | + | 28 U/L 21 U/L |
No medications |
| Patient PJ | 28/F | 6 months | Balance disorders (++) Dysarthria (++) |
None | + | 197 U/L 88 U/L |
Levodopa |
| Patient PD | 36/M | 6 months | Balance disorders (++) High-stepping gait (++) |
Minor articulation improvement | + | 21 U/L 20 U/L |
Levodopa |
Brain MRI scans were performed in all patients using a Philips Achieva 1.5T system with NovaDual gradients. Acquired sequences included T1-weighted SE images in sagittal and axial planes (SE, TR=596 ms, TE=15 ms, NAS=2, slice thickness 5 mm, pitch 1 mm), T2-weighted TSE images in coronal planes (TSE, TR=5058 ms, TE=100 ms, slice thickness 5 mm, pitch 1mm) and axial FLAIR sequence (TR=11000 ms, TI=2800 ms, TE=140 ms, NAS=2, slice thickness 5 mm, pitch 1mm). Signal intensity measurements on T1-WI were acquired in order to ensure objective assessment of visible lesions or suspicious areas. Average signal intensity of bilateral regions of interest (ROI) located in globi pallidi, midbrain and cerebellar hemispheres were calculated. The obtained results were adjusted against average frontal lobes white matter signal intensity as a reference. Measurements were taken using 20 mm2 surface ROI and the results were presented as percentage values. Measurements were performed in initial and follow-up examinations in each patient, as well as in a control group of five healthy individuals. Signal intensity of the pituitary gland frontal lobe in comparison to gray matter was subjectively assessed by an experienced neuroradiologist. Lesions in globi pallidi on T2-WI and FLAIR were also assessed in a subjective manner.
Symmetrical increase in signal intensity on T1-WI in globi pallidi was observed in all our patients (Figure 1). Lesions of similar nature were reported in midbrain in three patients (Figure 2) and in cerebellar hemispheres in just one(Figure 3). High signal of pituitary gland frontal lobe on non-enchanced T1-WI was observed in a single patient (Figure 4). Additionally, slight signal intensity decrease on T2-WI and FLAIR was observed subjectively in globi pallidi (Figure 5). Detailed analysis of the findings is presented in Table 2.
Figure 1.
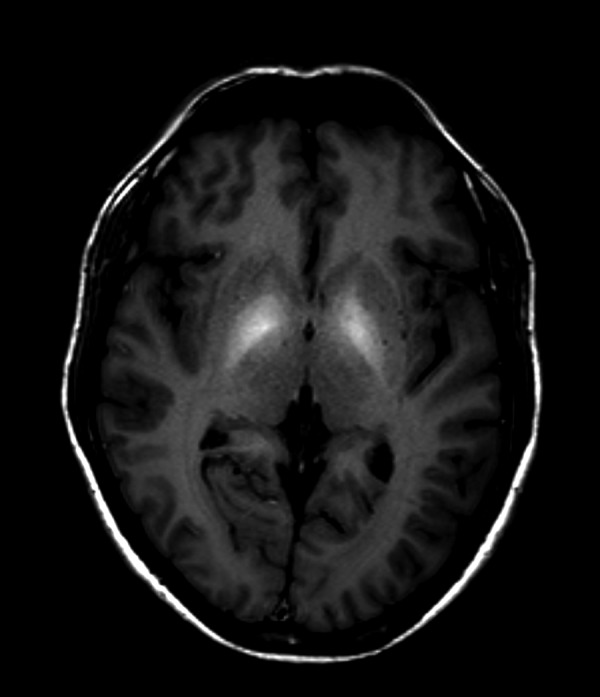
Brain MRI T1-WI axial plane of a patient with ephedrone encephalopathy: symmetrical signal increase in globi pallidi.
Figure 2.
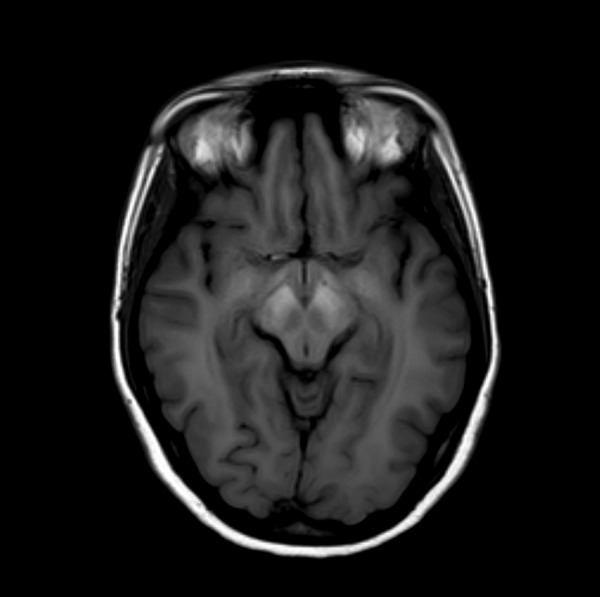
Brain MRI T1-WI axial plane of a patient with ephedrone encephalopathy at midbrain level: increased signal intensity in cerebral peduncles.
Figure 3.
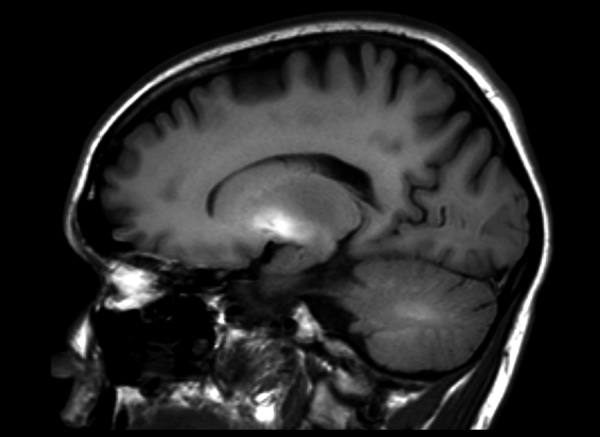
Brain MRI T1-WI sagittal plane of a patient with ephedrone encephalopathy: moderate signal intensity increase in cerebellar hemisphere white matter and significant signal intensity increase in globus pallidus.
Figure 4.
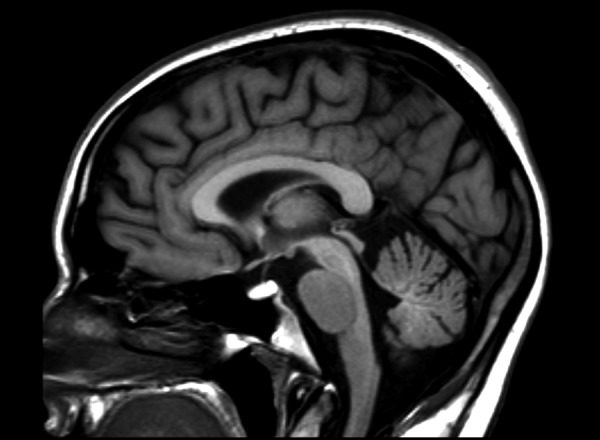
Non-enchanced brain MRI T1-WI medial sagittal plane of a patient with ephedrone encephalopathy: significant increase of signal intensity in pituitary gland frontal lobe. In healthy individuals the lobe is isointense with cerebral gray matter.
Figure 5.
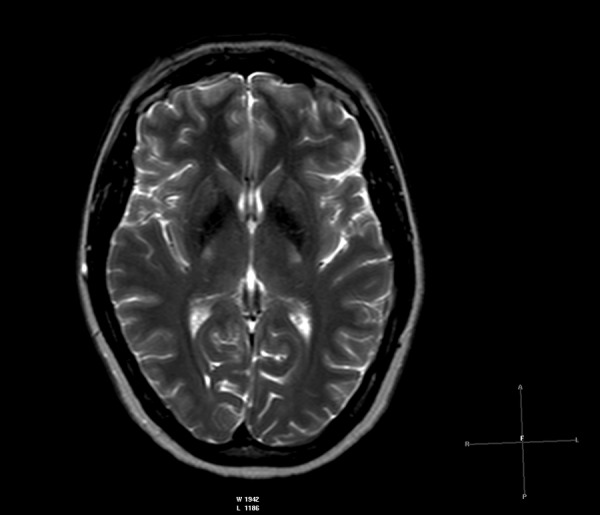
Brain MRI T2-WI axial plane of a patient with ephedrone encephalopathy: symmetrically low intensity signal in globi pallidi.
Table 2.
Brain MRI analysis of patients with ephedrone encephalopathy. (↓) – decreased signal intensity, (↑) – increased signal intensity.
| Initial MRI | Follow-up MRI | ||||||||||
|---|---|---|---|---|---|---|---|---|---|---|---|
| Globi pallidi [T1-WI] | Midbrain [T1-WI] | Cerebellum [T1-WI] | Pituitary gland frontal lobe [T1-WI] | Globi pallidi [T2-WI/FLAIR] | Time to follow-up [months] | Globi pallidi [T1-WI] | Midbrain [T1-WI] | Cerebellum [T1-WI] | Pituitary gland frontal lobe [T1-WI] | Globi pallidi [T2-WI/FLAIR] | |
| Patient WM | 136% | 110% | 01.2% | ↑ | ↓ | 15 | 109% | 92.6% | 94% | No change | ↓ |
| Patient FP | 157.5% | 112.2% | 92.5% | No change | No change | 9 | 117% | 104.6% | 92% | No change | No change |
| Patient PJ | 152% | 122% | 97% | No change | ↓ | 7 | 105% | 102.5% | 98% | No change | ↓ |
| Patient PD | 141% | 95% | 95.4% | No change | No change | 4 | 123% | 91.4% | 89.4% | No change | No change |
| Control group | 96% | 94.5% | 92% | No change | No change | ||||||
All patients declared discontinuation of ephedrone use. Symptomatic treatment with Levodopa in divided doses of 375–1000 mg was initiated in 3 patients.
Follow-up brain MRI was performed 4–15 months after discontinuation of ephedrone intake and initiation of symptomatic treatment. Reduction of signal intensity in globi pallidi on T1-WI was observed in all patients (Figures 6 and 7). In comparison to the initial examination, globi pallidi signal intensity was reduced by ca. 20–45%, but still remaining moderately higher (by 10–27%) when compared to healthy individuals (Table 2).
Figure 6.
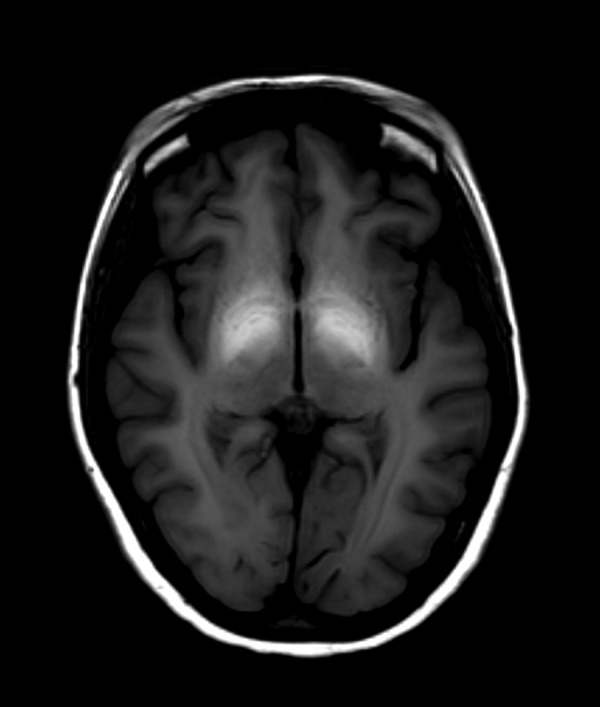
Initial brain MRI T1-WI axial plane of a patient with ephedrone encephalopathy: symmetrically high intensity signal in globi pallidi (globus pallidus to frontal lobe white matter signal intensity ratio is ca. 152%).
Figure 7.
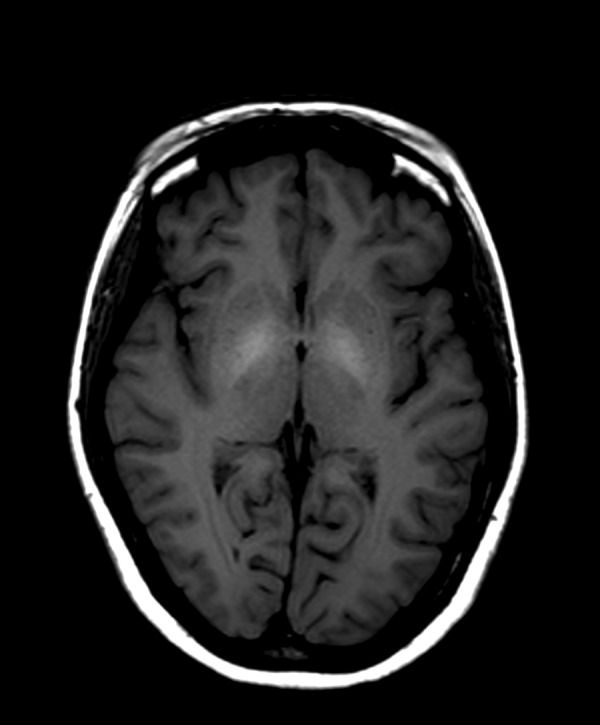
Follow-up brain MRI T1-WI axial plane of a patient with ephedrone encephalopathy obtained 7 months later: reduction of signal intensity in globi pallidi in comparison to the initial image in Figure 6 (globus pallidus to frontal lobe white matter signal intensity ratio is 105%; signal remains moderately increased compared to healthy individuals).
In patients with abnormal signal in cerebellar hemispheres, midbrain and pituitary gland in initial examination complete signal normalization was observed. On T2-WI and FLAIR subjective assessment showed persistent low signal intensity in globi pallid in two patient.
Follow-up neurological examinations revealed minor articulation improvement only in one patient; the remaining symptoms were not resolved. In this patient 20% signal intensity reduction in globi pallidi was observed in the follow-up MRI. However, lentiform nucleus was the only affected region in the initial examination.
No changes in symptoms intensity were observed in the remaining three patients declaring abstinence. Despite their stable clinical condition, 25–45% signal intensity reduction in globi pallidi was observed, along with complete signal normalization in the midbrain, cerebellum and pituitary gland.
Discussion
Mn intoxications were reported for many years, mostly among employees of manganese mines, steelworks and battery-making factories [1,2]. Currently population with increasing incidence of Mn intoxication consists of intravenous users of narcotics. These patients use excess potassium permanganate for ephedrone (methcathinone) production from OTC pharmaceuticals containing pseudoephedrine such as Sudafed®, Acatar®, Proastmin®. After enforced closure of designer drug shops, this is the cheapest and easiest method for central nervous system stimulant preparation [7].
In physiological conditions Mn is found in the human body in trace amounts as a component of certain enzymes. When administered in excess amounts it accumulates in lungs, liver, intestines, kidneys, bones, heart and brain [9]. The transport of Mn into cerebral tissues depends on its blood level. At normal blood level it is transported via capillary endothelium in pia mater. At high level most Mn permeates into CNS cells via ventricular choroid plexi [9,10]. In brain Mn is accumulated mainly in globi pallidi. Elimination of Mn from the body is via very slow process of diffusion [11].
The onset and severity of clinical symptoms depend on the intake period as well as on individual sensitivity. Initially patients may experience emotional or sleep disorders and irritability. Chronic intoxication consists of three phases:
– first phase characterized by non-specific symptoms, such as weakness, reduced appetite, apathy, headaches, joint pains and somnolence;
– second phase characterized by psychological and neurological symptoms such as dysarthria, disturbed gait, excessive salivation and inability to perform opposable movements;
– third phase resembling Parkinson’s disease with predominance of akinesis and stiffness.
Histopathological examination of brain tissue reveals atrophy of globus pallidus and putamen, occasionally thalamus, rarely black matter, and is similar to that in Parkinson’s disease. Usually the atrophy of neurons is focal in nature. Development of fibrous glia is observed along with the loss of neurons.
Brain MRI T1-WI features symmetrical high signal intensity in globi pallidi [5,12–14]. In some patients, similar signal intensity abnormalities are also observed in midbrain and cerebellar hemispheres white matter. Brain structures with increased signal intensity on T1-WI are consistent with those accumulating Mn reported by anatomopathologists. Signal changes of identical morphology and location were observed in our serie of cases. Measurements of signal intensity in globi pallidi in regard to frontal lobes white matter allowed for objective evaluation of signal intensity and monitoring dynamics of changes in follow-up examinations. Comparing to initial examination signal intensity in follow-up MRI was lower by average of 32% [range 18–47%] in globi pallidi and 15% [range 7–20%] in midbrain. The initial values in both structures were higher than those measured respectively in control group by average of 50% in globi pallidi and 20% in midbrain. According to subjective evaluation made by an experienced radiologist, the intensity of signal in globi pallidi, midbrain and cerebellum was also increased. In one patient high intensity signal on T1-WI was observed in pituitary gland frontal lobe and cerebellar hemispheres. In 14 months none of these changes were present anymore.
MRI signal intensity changes reported above are not specific to Mn intoxication, thus are not sufficient for making the final diagnosis. Differential diagnosis should include hepatic encephalopathies caused by alcohol, drugs and other toxic substances abuse, viral infections and Wilson’s disease. This is particularly important in multidrug dependence as it often coexists with liver damage. Moreover, intravenous route of administration may lead to infections with hepatic viruses, therefore ephedrone encephalopathy might superimpose hepatic encephalopathy. Laboratory tests, particularly Mn serum and urine levels, but also detailed medical history may contribute to establishing the final diagnosis.
Currently, the only known therapy is symptomatic treatment with antiparkinsonian drugs (e.g. Levodopa, Amantadine) and myorelaxants. No causal treatment of the disorder is available. Inhibition of symptoms development was occasionally observed due to complete Mn-containing preparations abstinence [13]. Although in some patients regression of hyperintense changes in lentiform nuclei was observed, it was not correlated with any improvement in clinical condition [15,16]. This observation was confirmed by our own experience. The reduction of signal intensity on T1-WI in globi pallidi as well as normalization of signal intensity in midbrain, cerebellum and pituitary gland was not associated with any significant symptoms reduction. Slight improvement in articulation was associated with a 20% reduction of signal intensity in globi pallidi in a patient with this single location of changes in the initial MRI.
In our opinion, Mn intoxications and ephedrone encephalopathy may become an increasing clinical problem in the future. This may be a result of reduced access to psychoactive drugs caused by legal restrictions on the use of designer drugs imposed in Poland in 2012. Our study is of preliminary nature and a larger number of patients is required for observation. However, at this point preliminary conclusions can already be drawn.
Conclusions
Brain MRI is helpful in the assessment of the extent and the dynamics of changes in patients with ephedrone encephalopathy.
There is no straightforward correlation between the regression of changes in brain MRI and clinical symptoms resolution.
Brain MRI does not permit definite identification of the origin of encephalopathy. Differential diagnostics should include hepatic encephalopathies caused by alcohol abuse, medication intake or viral infections, as well as Wilson’s disease.
References
- 1.Wang JD, Huang CC, Hwang YH, et al. Manganese induced parkinsonism: an outbreak due to an unrepaired ventilation control system in a ferromanganese smelter. Br J Ind Med. 1989;46(12):856–59. doi: 10.1136/oem.46.12.856. [DOI] [PMC free article] [PubMed] [Google Scholar]
- 2.Nelson K, Golnick J, Korn T, et al. Manganese encephalopathy: utility of early magnetic resonance imaging. Br J Ind Med. 1993;50(6):510–13. doi: 10.1136/oem.50.6.510. [DOI] [PMC free article] [PubMed] [Google Scholar]
- 3.Schmidt T, Dalubaeva D. Anniversary Collection: Diagnostic and Treatment of Neurological Diseases. W. Medicine Moscow; Russia: 1990. Neurological complications of ephedrone drug abuse (ephedrone encephalopathy) pp. 183–86. [Google Scholar]
- 4.Sanotsky Y, Lesyk R, Fedoryshyn L, et al. Manganic encephalopathy due to “ephedrone” abuse”. Mov Disord. 2007;22(9):1337–43. doi: 10.1002/mds.21378. [DOI] [PubMed] [Google Scholar]
- 5.de Bie RM, Gladstone RM, Strafella AP, et al. Manganese-induced Parkinsonism associated with methcathinone (Ephedrone) abuse. Arch Neurol. 2007;64(6):886–89. doi: 10.1001/archneur.64.6.886. [DOI] [PubMed] [Google Scholar]
- 6.Colosimo C, Guidi M. Parkinsonism due to ephedrone neurotoxicity: a case report. Eur J Neurol. 2009;16(6):114–15. doi: 10.1111/j.1468-1331.2009.02606.x. [DOI] [PubMed] [Google Scholar]
- 7.Myślicka D, Zuk M, Dziurkowski M. Ephedron dependence – case report. Psychiatr Pol. 2011;45(1):79–85. [PubMed] [Google Scholar]
- 8.Fudalej S, Kołodziejczyk I, Gajda T, et al. Manganese-induced parkinsonism among ephedrone users and drug policy in Poland. J Addict Med. 2013;7(4):302–3. doi: 10.1097/ADM.0b013e3182915dce. [DOI] [PubMed] [Google Scholar]
- 9.Bowman A, Kwakye G, Hernandez E, et al. Role of manganese in neuro-degenerative diseases. JTrace Elem Med Biol. 2011;25(4):191–203. doi: 10.1016/j.jtemb.2011.08.144. [DOI] [PMC free article] [PubMed] [Google Scholar]
- 10.Rybakowska I, Kaletka K, Sein Anand J. Manganizm – choroba neurodegeneracyjna mózgu spowodowana zatruciem manganem. Przegl Lek. 2012;69(8):555–56. [in Polish] [PubMed] [Google Scholar]
- 11.Yokel RA, Crossgrove JS, Bukaveckas BL. Manganese distribution across the blood-brain barrier. Manganese efflux from the brain does not appear to ce carrier mediated. Neurotoxicology. 2003;24:15–22. doi: 10.1016/s0161-813x(02)00090-6. [DOI] [PubMed] [Google Scholar]
- 12.Iqbal M, Monaghan T, Redmont J. Manganese toxicity with ephedrine abuse manifesting as parkinsonism, A case report. J Addict Med. 2013;7(4):302–3. doi: 10.1186/1752-1947-6-52. [DOI] [PMC free article] [PubMed] [Google Scholar]
- 13.Lewin OS. “Ephedrone” encephalopathy”. Zh Nevrol Psikhiatr Im S S Korsakova. 2005;105(7):12–20. [PubMed] [Google Scholar]
- 14.Lucchini R, Albini E, Placidi D, et al. Brain magnetic resonance imaging and manganese exposure. Neurotoxicology. 2000;21(5):769–75. [PubMed] [Google Scholar]
- 15.Khatiashvili I, Akhvlediani K, Megrelishvili M, et al. Movement disorder caused by injections of manganese containing compounds. Mov Dis. 2007;22(S16):1–325. [Google Scholar]
- 16.Meral H, Kutukcu Y, Atmaca B, et al. Parkinsonism caused by chronic usage of intravenous potassium permanganate. Neurologist. 2007;13(2):92–94. doi: 10.1097/01.nrl.0000253089.20746.a8. [DOI] [PubMed] [Google Scholar]