Abstract
Study Objective:
To examine the measurement differences in sleep and EEG arousal statistics between the American Academy of Sleep Medicine (AASM) recommended EEG montage (F4-M1, C4-M1, O2-M1) and acceptable EEG montage (Fz-Cz, C4-M1, Oz-Cz).
Design:
Prospective, blinded, randomized comparison.
Setting:
Australian clinical sleep laboratory in a tertiary hospital.
Patients or Participants:
50 consecutive patients undertaking polysomnography (PSG) for the clinical suspicion of sleep disordered breathing.
Interventions:
N/A
Measurements and Results:
Patient EEGs were recorded using both the AASM recommended and acceptable EEG montages during the PSG. Two scorers were used to examine the difference in PSG statistics using the two EEG montages. The scorers analyzed the 50 studies using the two EEG montages. Ten of the studies were scored twice for each montage by each scorer to calculate intra-scorer and inter-scorer agreement. No statistically significant differences were observed between the PSG statistics of the recommended and acceptable EEG montages. The recommended EEG montage had greater inter-scorer agreement but no difference in intra-scorer agreement.
Conclusions:
This study demonstrates that the two EEG montages endorsed by the AASM Manual produce similar sleep and EEG arousal statistics.
Citation:
Duce B, Rego C, Milosavljevic J, Hukins C. The AASM recommended and acceptable EEG montages are comparable for the staging of sleep and scoring of EEG arousals. J Clin Sleep Med 2014;10(7):803-809.
Keywords: EEG, recommended montage, acceptable montage, sleep staging, EEG arousal scoring, polysomnography, sleep apnea, inter-scorer agreement, intra-scorer agreement, kappa
A standard of clinical polysomnography (PSG) is the characterization of sleep and sleep fragmentation via the staging of sleep and scoring of EEG arousals.1 For a number of decades the staging of sleep was conducted according to the Rechtschaffen and Kales (R&K) criteria.2 This standard recommended a single central derivation, despite its apparent shortcomings.3 In 2007 the American Academy of Sleep Medicine (AASM) published The AASM Manual for the Scoring of Sleep and Associated Events.4 This was seen as a long-overdue update of the criteria, incorporating the evidence accumulated since the publication of R&K and recognizing the need to improve inter-scorer agreement.5
Among the changes in the AASM manual was the increase to three derivations in the EEG montage as well as the provision of two different EEG montages. The introduction of two extra derivations into the EEG montage was based on evidence that regional differences in EEG morphology exist and may be important in describing sleep.6–9 The two EEG montages allowed differ in the type of derivations that make up each montage. The recommended montage (Mrec) consists of all referential derivations, with negative input electrodes over the frontal, central, and occipital regions. The acceptable montage (Macc), on the other hand, consists of two bipolar derivations (Fz-Cz and Cz-Oz) and a referential derivation (C4-M1). Despite the “recommended” and “acceptable” nomenclature, the AASM has indicated that each montage is equally acceptable for use.10
BRIEF SUMMARY
Current Knowledge/Study Rationale: The American Academy of Sleep Medicine's Manual for the Scoring of Sleep and Associated Events allows for the use of either a recommended EEG montage or an acceptable EEG Montage in polysomnographic recordings. In this study we compared sleep and EEG arousals indices derived from the two montages to determine their equivalence.
Study Impact: There was very little difference between montages in sleep parameters such as total sleep time, EEG arousal index and sleep stage proportions. Greater inter-scorer agreement was observed with the recommended montage but likely reflects the scorers' greater familiarity with the montage.
While both montages are equally acceptable for use, little is known about the comparability of sleep statistics produced by each montage. The referential derivations which make up Mrec have the advantage of magnifying the waveform amplitudes close to the negative input electrodes, but they are also more prone to signal noise. The bipolar derivations which make up part of the Macc are less likely to be affected by artifact but may potentially mask global EEG activity.11 Furthermore, bipolar derivations tend to produce waveforms with smaller amplitudes due to their shorter inter-electrode distance.12 This is due to both the proximity of the electrode locations and the nature of differential amplifiers. Proximal electrodes will often receive similar potentials oriented in the same dipole,13 leading the differential amplifier to cancel these potentials out.
This EEG cancellation effect has the capacity to affect the scoring of slow wave sleep if the Fz-Cz in Macc is used for measuring the amplitude of frontal activity. Kemp and colleagues have recently shown slow wave amplitudes in the Fz-Cz derivation to be approximately 60% to 65% of the slow wave amplitudes measured in the F4-M1 derivation.13 This could lead to significant changes in the proportion of stage 3 sleep (N3) scored. The AASM acknowledged this issue in item V5 of their online FAQ,10 and suggested using C4-M1 if using the recommended electrooculogram (EOG) placement and E1-Fpz if using the alternative EOG placement for the measurement of frontal activity. The correspondence between Mrec and Macc for other sleep indices is, however, less certain. Other sleep indices, such as total sleep time and arousal index, are also important in the description of sleep and are often used to generate other important indices (e.g., apnea-hypopnea index [AHI]). Thus it is necessary to appreciate any differences between the two montages for a range of sleep indices.
The aim of this study was therefore to compare sleep and EEG arousal indices derived from the two AASM derivations (Mrec and Macc) in a patient cohort examined for sleep disordered breathing.
METHODS
Patient Selection
Consenting patients undergoing diagnostic PSG for suspected sleep disordered breathing were recruited for the study. Patients were excluded if they had undergone diagnostic PSG previously or if a split-night treatment protocol (diagnostic to positive airway pressure therapy) was implemented. The institutional human research ethics committee approved this study.
Determination of Sample Size
While the relative proportion of sleep stages can be significant in clinical PSG, the correct determination of total sleep time (TST) was deemed to be paramount. The TST is often used in the calculation of other PSG statistics such as the AHI. To determine the sample size, we used TST as the primary outcome measure. Based on data from the previous 3 months of diagnostic PSGs, we calculated that a sample of 50 patients was necessary to detect a difference in TST of 15 minutes with a two-sided 5% significance level and a power of 80%.
Polysomnography
PSGs were recorded with the E-series acquisition system (Compumedics, Abbotsford, Australia). The recording montage comprised both Mrec and Macc derivations (F4-M1, C4-M1, O2-M1, Fz-Cz, Cz-Oz), left and right EOG (recommended derivation: E1-M2, E2-M2), chin electromyogram (EMG, mental/ submental positioning), modified lead II ECG, nasal pressure (DC amplified), oronasal thermocouple, body position, thoracic and abdominal effort (inductive plethysmography), pulse oximetry (Nonin Xpod 3011), left and right leg movement (anterior tibialis EMG), and sound pressure (dBA meter: Tecpel 332).
Polysomnogram Scoring Protocol
Following acquisition, PSG's were de-identified and modified to display a staging montage with either Mrec or Macc available for viewing. PSGs were presented to 2 scorers in randomized order. Randomization of PSGs was performed using the freely accessible Randomizer website.14 In order to calculate intra-scorer and inter-scorer agreement, the first 10 of the 50 PSGs were scored 4 times (twice using Mrec and twice using Macc) by each scorer. The next 20 PSGs were scored twice by Scorer 1 (JM)—once each using Mrec and Macc. The last 20 PSGs were scored by Scorer 2 (CR) in similar fashion. Overall, each scorer was presented with a total of 80 PSGs to score.
The staging montage consisted of 2 viewing panes. The upper pane displayed ECG, Chin EMG, left EOG, right EOG, EEG1 (frontal - F4-M1 or Fz-Cz), EEG2 (central - C4-M1) and EEG3 (occipital - O2-M1 or Oz-Cz) and was viewed across a 30-s epoch. A lower pane displayed the nasal pressure and left and right leg anterior tibialis EMG channels across a 5-min epoch. Sleep staging and EEG arousal scoring were performed according to the AASM manual in conjunction with the clarifications provided on their website FAQ.10 In accordance with the staging clarifications, scorers were instructed to use the F4-M1 derivation in Mrec and the C4-M1 derivation in Macc as their primary channel for the identification of slow wave activity. PSGs were scored with Compumedics Profusion 3.4 (Build 353) software while viewed on Planar PX212M (1600 × 1200 resolution) LCD monitors via ATI Radeon HD2400 Pro 256 MB graphics cards. PSG scorers (CR, JM) had previously completed a laboratory training program for PSG scoring and participate regularly in intra- and inter-laboratory scoring concordance activities.
Statistical Analysis
Statistical analyses were performed using GraphPad Prism 6.02 (GraphPad Software, La Jolla, CA). The normality of paired data was determined by applying the Shapiro-Wilk test15 to the differences of the individual values to the group mean. Data are presented as mean and standard error or median and interquartile range where appropriate. Differences in sleep and arousal statistics between Mrec and Macc were compared using paired t-tests. The mean difference and standard error of the difference between sleep and arousal statistics were also calculated to aid interpretation. Agreement between Mrec and Macc for TST, EEG arousal index (ArI), and N3 proportions (% of TST) was determined according to the method of Bland and Altman.16 The first 10 PSGs were assessed for inter- and intra-scorer agreement. Epoch-by-epoch inter-scorer and intra-scorer agreement for sleep staging was determined by Cohen pairwise κ statistic.17 Inter-scorer and intra-scorer agreement for EEG arousals was assessed using proportion of specific agreement for positive ratings (PSA).18 The mean inter-scorer and intra-scorer agreement for each sleep stage and overall sleep was compared between Mrec vs. Macc using paired t-tests. A boxand-whisker plot was also created to illustrate the dispersion of inter-scorer and intra-scorer agreement for all sleep stages. A p < 0.05 was considered statistically significant.
RESULTS
Patients
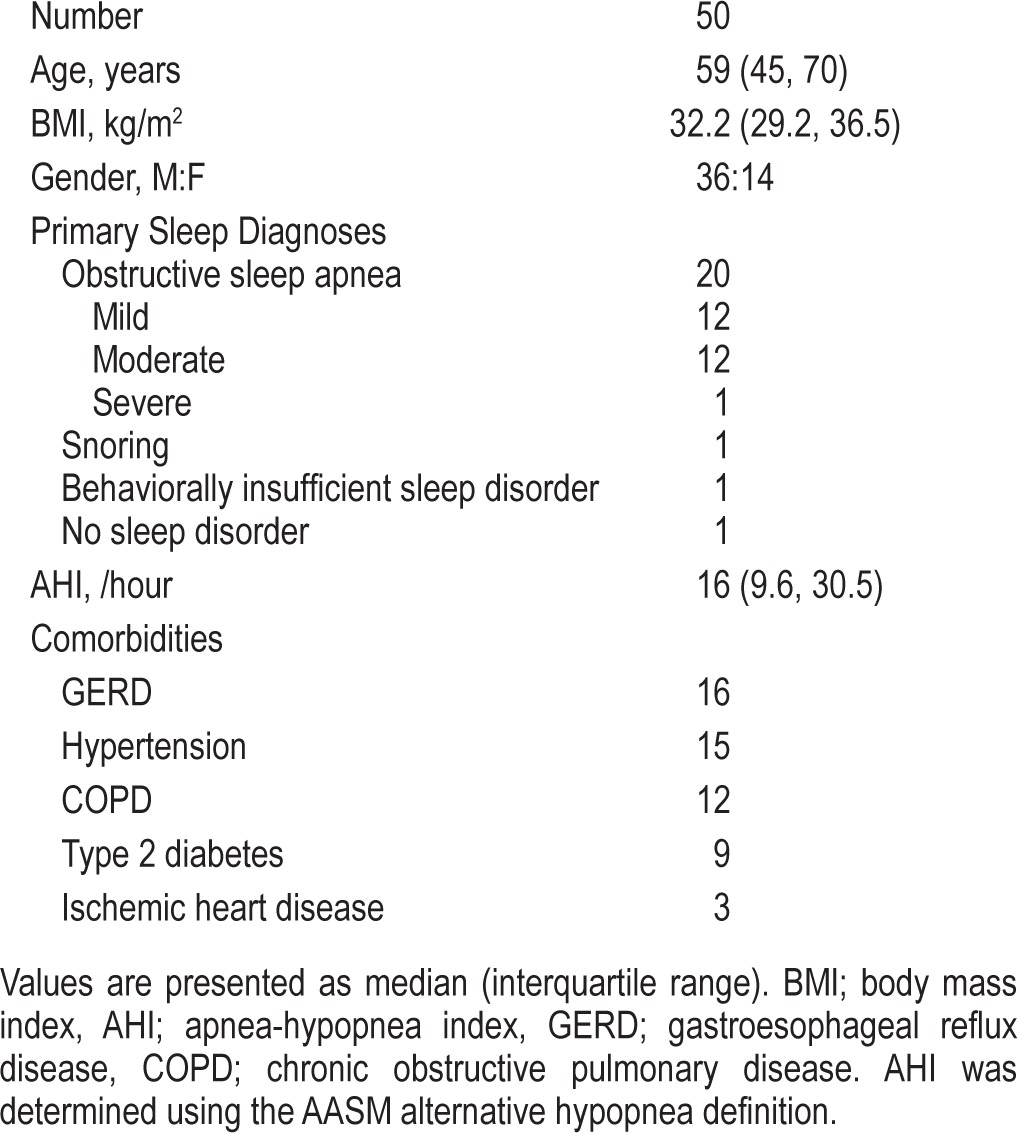
Patient demographic data are presented in Table 1. Patients were middle-aged and obese. There was a male gender bias in this cohort, reflecting the reported gender-based prevalence in sleep disordered breathing. Obstructive sleep apnea was present in almost the entire cohort. Other sleep related diagnoses included: snoring and behaviorally insufficient sleep syndrome. One patient was deemed to have no sleep related disorder.
Table 1.
Patient characteristics of the study cohort
Sleep Statistics
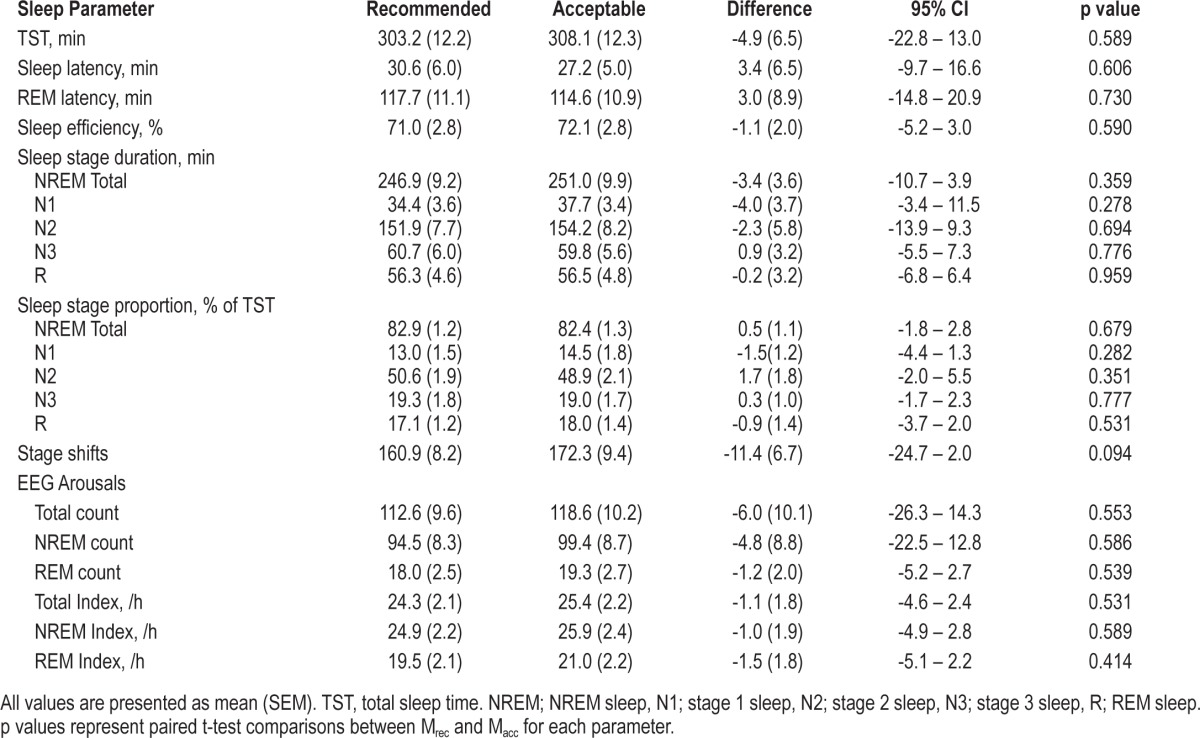
PSG sleep statistics are presented in Table 2. There were no statistically significant differences between Mrec and Macc for sleep and EEG arousal statistics. However, trends were evident toward an increased total sleep time, shorter sleep latency, and more sleep stage shifts when using Macc.
Table 2.
Calculated sleep indices using recommended and acceptable EEG montages
Agreement Statistics
Scatter plots (Figures 1, 3, 5) and Bland-Altman plots (Figures 2, 4, 6) were created to determine the level of agreement between Mrec and Macc for TST, ArI, and N3 proportions. Overall, these plots demonstrated relative parity between the 2 montages; however, there were substantial differences in a small number of patients. There was a bias for a higher mean (± SD) TST of 4.9 min (± 28) when utilizing the Macc compared to the Mrec montage. There was also a bias for higher mean (± SD) ArI of 1.1 (± 6.1) with the Macc montage. No bias (0.3% ± 6.2) was detectable between Mrec and Macc for N3 proportions.
Figure 1. Scatter plot comparing TST measured with Mrec and Macc.
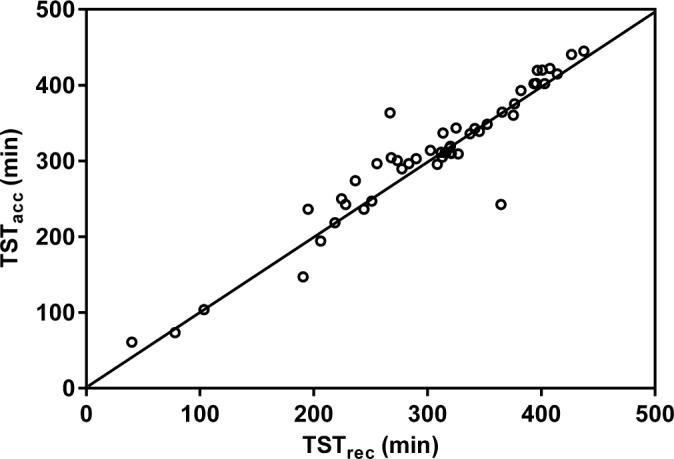
The diagonal line represents the line of identity. Correlation is significant at the 0.001 level.
Figure 3. Scatter plot comparing the ArI measured with Mrec and Macc.
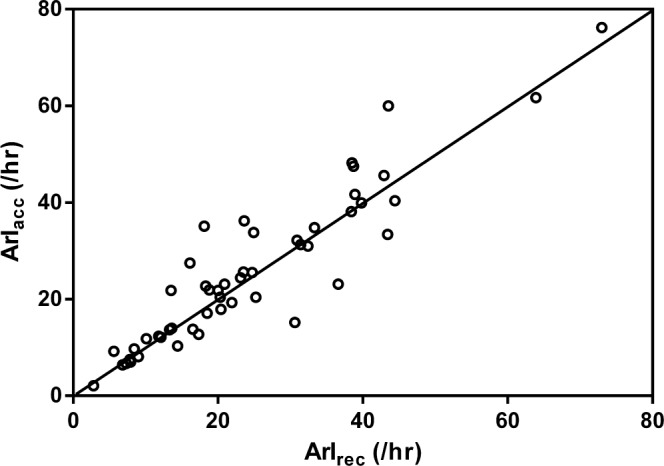
The diagonal line represents the line of identity. Correlation is significant at the 0.001 level.
Figure 5. Scatter plot comparing stage N3 (as a proportion of TST) measured with Mrec and Macc.
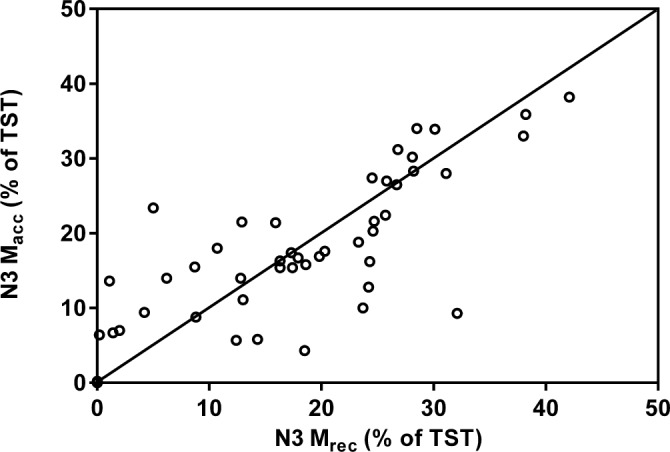
The diagonal line represents the line of identity. Correlation is significant at the 0.05 level.
Figure 2. Bland-Altman plot demonstrating the agreement between TSTrec and TSTacc.
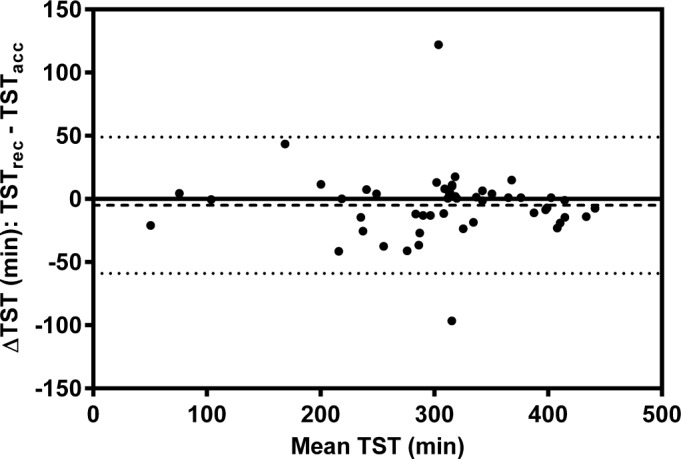
The dashed line represents the mean difference and the dotted lines represent the 5th and 95th percentile.
Figure 4. Bland-Altman plot demonstrating the agreement between ArIrec and ArIacc.
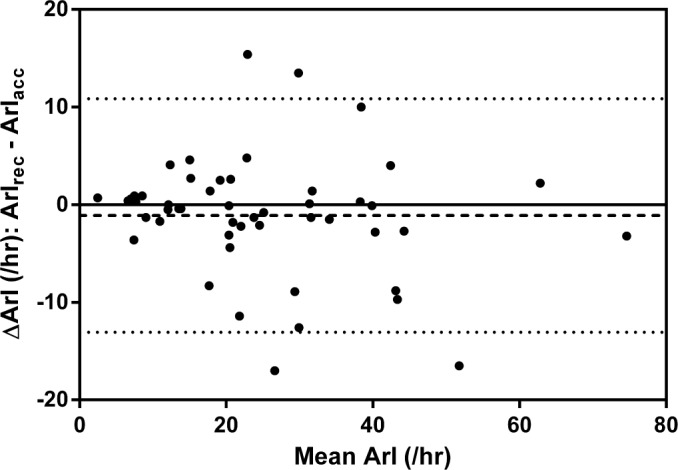
The dashed line represents the mean difference and the dotted lines represent the 5th and 95th percentile.
Figure 6. Bland-Altman plot demonstrating the agreement of stage N3 (as a proportion of TST) between Mrec and Macc.
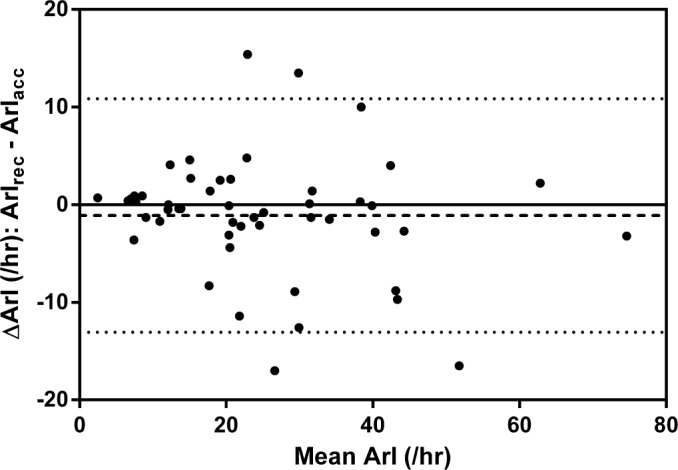
The dashed line represents the mean difference and the dotted lines represent the 5th and 95th percentile.
Inter- and Intra-Scorer Agreement
Inter-scorer and intra-scorer agreement data are presented in Table 3, Table 4, and Figure 7. Comparisons of epoch-by-epoch sleep staging between scorers demonstrated greater agreement in overall staging and REM sleep staging using Mrec. There was also a trend for greater agreement in staging N2 using Mrec. Comparisons of epoch-by-epoch sleep staging within scorers demonstrated no difference in overall staging agreement. There were no differences in the ability to discern EEG arousals using either montage.
Table 3.
Inter-scorer agreement for polysomnograms scored using recommended and acceptable EEG montages

Table 4.
Intra-scorer agreement for polysomnograms scored using recommended and acceptable EEG montages

Figure 7. Box plots demonstrating paired inter- and intra-scorer agreement differences between Mrec and Macc.
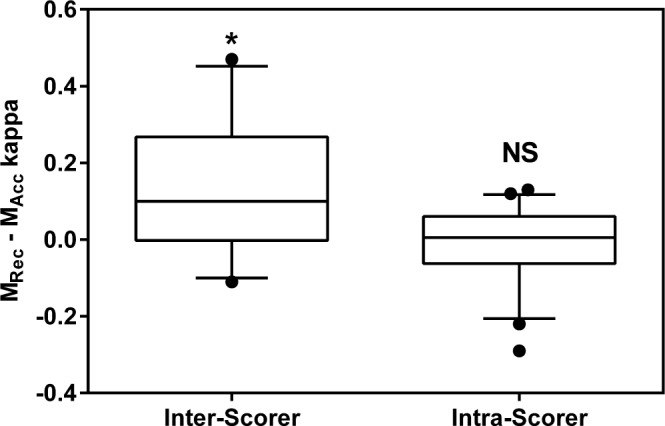
Agreement was calculated using Cohen's κ. Central line = median; Box boundary = 25th and 75th percentiles; Error bars = 10th and 90th percentiles; ● = outliers. Differences were compared using paired t-tests. NS, not significant. * p < 0.05.
DISCUSSION
To our knowledge, this is the first study to examine the differences between Mrec and Macc with respect to sleep and EEG arousal statistics. In this study we found that the use of either Mrec or Macc did not change the amount or proportions of sleep stages. Similarly, the ArI and the number of EEG arousals observed did not change appreciably between these montages. Despite the apparent equivalence between the two EEG derivations however Mrec was associated with greater inter-scorer agreement.
The primary aim of this study was to compare sleep and EEG arousal indices derived from the two derivations described in The AASM Manual for the Scoring of Sleep and Associated Events (Mrec and Macc).4 Of these indices, we view TST as the principal sleep index in clinical PSG, as it not only indicates the adequacy of sleep during the PSG but is also used as a denominator for other key PSG statistics, such as the AHI and ArI. Our data suggest that Mrec and Macc are similar with respect to TST. However, in two patients, we did find a large difference (> 1 h) in the TST estimate between the montages. These large differences we attribute to a very high ArI in one patient and the degradation of the Cz signal in the other patient.
In this study we implemented the AASM FAQ V5 rule clarification for the staging of N3 when using Macc. This made the C4-M1 derivation the primary channel for detection of slow wave activity in Macc, while the primary channel in Mrec was the F4-M1 derivation. Two studies have already examined the differences between these two channels and demonstrated a statistically significant increase in N3 amounts and proportions.19,20 The protocols of these studies differed from our study in that the study by Moser et al. examined AASM criteria compared to R&K,19 while the study by Ruehland et al. examined three EEG derivations versus one EEG derivation using AASM criteria for both derivations.20 Despite the differences in study protocols, these two studies and our study are comparable with respect to comparisons of slow wave activity. Our finding of no difference in the amounts and proportions of N3 between Mrec and Macc are therefore in contrast to these previously published studies.
There are a number of explanations for this difference in N3 amounts and proportions. The first explanation relates to the between-subject variations in slow wave amplitudes. While it has been well demonstrated that the F4-M1 derivation shows an average increase of 20% in slow wave amplitude compared to the C4-M1,13 this does not necessarily translate to a reduction in N3 sleep in all patients. The criteria for N3 requires only six seconds of slow wave activity with an amplitude of 75 μV or greater across a 30-second epoch. This means that any slow waves with amplitudes greater than 90 μV in the F4-M1 channel would still likely meet the amplitude criteria if observed in the C4-M1 channel.
Another explanation for the differences in N3 amounts and proportions could be related to laboratory approaches in discerning between K complexes and slow waves during sleep staging. Differentiating between K-complexes and slow waves can be difficult, especially when they are interspersed in the same epoch. This is not a new problem, as it was previously noted in the R&K as well as the Dement-Kleitman criteria.2,21 In this context, we are aware that some sleep laboratories will encourage their scorers to closely differentiate between K complexes and slow waves in the same epoch. Other sleep laboratories are more liberal in allowing the inclusion of K complexes (with > 75 μV amplitude) that are interspersed with slow waves towards meeting the 20% epoch criteria for N3. This has the laboratory benefit of speeding up the staging process. Our laboratory prefers to closely differentiate between K-complexes and slow waves despite its inherent difficulties. While not being aware of how these previous studies have addressed such specific scoring subtleties, this phenomenon could be a factor in explaining the differing study results. Since the conduct of this study we note that the updated AASM Manual has addressed this issue by allowing the inclusion of K complexes in the determination of N3 criteria.22 This rule clarification may lead to further sleep stage agreement between laboratories.
The study by van Sweden et al. is the only other to have examined the differences in sleep staging statistics between a referential and bipolar EEG montage.23 These authors compared the referential C4-M1 derivation with a bipolar montage of Fpz-Cz and Pz-Oz and described a tendency to stage greater amounts of slow wave sleep with the bipolar montage, while there were minimal differences in inter-scorer agreement. Although the increased slow wave sleep with the bipolar montage would seem to contradict the conventional wisdom of bipolar derivations and waveform amplitude, the inter-electrode distance of the Fpz-Cz derivation would closely approximate that of the F4-M1 referential derivation. This similarity of inter-electrode distance is likely the reason for the comparability of the bipolar derivation with the C4-M1 derivation. Judging by the reference to van Sweden in the AASM supporting rationale paper,24 this small study forms the basis for including the acceptable EEG montage into the AASM Manual,24 though its common use at the Mayo Clinic may also have been a factor for inclusion.26 While the AASM cited the van Sweden paper in its rationale, it recommended a frontal bipolar derivation with a smaller inter-electrode distance. Perhaps if the van Sweden bipolar derivations were used as part of Macc, the FAQ V5 clarification would not be necessary.
The examination of inter-scorer agreement using Cohen κ demonstrated greater agreement when staging with Mrec. Part of this greater agreement may be attributed to the scorers' greater familiarity with Mrec. Since our laboratory routinely uses Mrec for clinical PSGs, it is likely that the scorers were perhaps more adept at identifying the different frequencies and morphological features in the recommended montage. Another factor that could explain greater agreement with Mrec is the confirmatory nature associated with the referential channels. The similarity of waveforms observed in both the F4-M1 and C4-M1 channels may lead to greater confidence in assigning a particular stage to an epoch by the scorers. We believe that with more training and familiarity with Macc, it is likely that inter-scorer agreement would increase. When examining inter-scorer agreement for specific sleep stages, we observed statistically greater agreement in scoring the stage REM as well as a trend for better scoring of stage N2, although this was not statistically significant. This again may be associated with the scorers' familiarity with Mrec. The absolute agreement and hierarchy of staging agreement associated with each stage was consistent with the literature.20,26 Agreement was lowest in staging N1 sleep, better with stages N2 and N3, and highest with staging wakefulness and REM sleep.
The finding that the scoring of EEG arousals was similar for both EEG montages was not really surprising. Since the scoring of EEG arousals has quite poor agreement, it was unlikely that the number of PSGs used in this study would have enough power to find differences between the two EEG montages. Another contributing factor to this finding is the fact that rules for the scoring EEG arousals have not changed since the publication of the original EEG arousal standard in 1992.27,28 The comparison of EEG arousal scoring in this study is however limited by use of the PSA method. The PSA method may exaggerate agreement as it determines agreement for positive ratings but does not take into account negative ratings. Another problem associated with PSA method is that there is no specific duration of EEG arousal overlap criteria associated with this method. So even a 0.5-second overlap would signify EEG arousal agreement.
There are a few limitations associated with this study. The first limitation was that both scorers are from the same sleep laboratory. This aspect of our study has the potential to limit the generalizability of our study and could be addressed by the use of a number of scorers from different laboratories. The second limitation was the ability to properly blind the scorers. Even though all signals from the studies were labelled identically, it is likely that a number of factors affected the blinding. The first factor was the difference in appearance of the acceptable frontal channel (Fz-Cz) compared to the central channel (C4-M1) during N3 was often readily apparent and commented on by the scorers. The second factor was the instruction to score all slow wave from the central (C4-M1) for Macc likely alerted the scorers to these differences. In contrast we can point to the use of PSGs from a clinical cohort of subjects as strength of the study. Since all patients were studied for the suspicion of OSA, this increases the applicability of this study to other clinical sleep laboratories and their routine practice.
In conclusion, we found that sleep staging or EEG arousal statistics did not differ between the AASM recommended EEG montage or the acceptable EEG montage. An increase in inter-scorer agreement was associated with the use of Mrec, but this may be associated with the scorers' greater familiarity with this EEG montage. There appears to be no tangible advantage of using one EEG montage over the other in the clinical sleep laboratory setting.
DISCLOSURE STATEMENT
This was not an industry supported study. Mr. Duce has received honoraria from Philips-Respironics and Resmed. The other authors have indicated no financial conflicts of interest.
ABBREVIATIONS
- AASM
American Academy of Sleep Medicine
- AHI
apnea-hypopnea index
- ArI
EEG arousal index
- ECG
electrocardiogram
- EEG
electroencephalogram
- EOG
electrooculogram
- EMG
electromyogram
- FAQ
frequently asked questions
- LCD
liquid crystal display
- Mrec
montage using the AASM recommended EEG montage
- Macc
montage using the AASM acceptable EEG montage
- NREM
NREM sleep
- N1
stage 1 sleep
- N2
stage 2 sleep
- N3
stage 3 sleep
- OSA
obstructive sleep apnea
- PSA
proportion of specific agreement
- PSG
polysomnography
- R
REM sleep
- R&K
Rechtschaffen & Kales sleep staging criteria
- TST
total sleep time
- TSTrec
total sleep time determined with the AASM recommended EEG montage
- TSTacc
total sleep time determined with the AASM acceptable EEG montage
REFERENCES
- 1.Kushida CA, Littner MR, Morgenthaler T, et al. Practice parameters for the indications for polysomnography and related procedures: an update for 2005. Sleep. 2005;28:499–521. doi: 10.1093/sleep/28.4.499. [DOI] [PubMed] [Google Scholar]
- 2.Rechtschaffen A, Kales A. Los Angeles, CA: University of California, Brain Information Service/Brain Research Institute; 1968. A Manual of Standardized Terminology, Techniques and Scoring System for Sleep Stages of Human Subjects. [Google Scholar]
- 3.Himanen SL, Hasan J. Limitations of Rechtschaffen and Kales. Sleep Med Rev. 2000;4:149–67. doi: 10.1053/smrv.1999.0086. [DOI] [PubMed] [Google Scholar]
- 4.Iber C, Ancoli-Israel S, Chesson A, Quan S for the American Academy of Sleep Medicine. 1st ed. Westchester, IL: American Academy of Sleep Medicine; 2007. The AASM Manual for the Scoring of Sleep and Associated Events: Rules, Terminology and Technical Specifications. [Google Scholar]
- 5.Grigg-Damberger MM. The AASM scoring manual: a critical appraisal. Curr Opin Pulmonary Med. 2009;15:540–9. doi: 10.1097/MCP.0b013e328331a2bf. [DOI] [PubMed] [Google Scholar]
- 6.McCormick L, Nielsen T, Nicolas A, et al. Topographical distribution of spindles and K-complexes in normal subjects. Sleep. 1997;20:939–41. doi: 10.1093/sleep/20.11.939. [DOI] [PubMed] [Google Scholar]
- 7.Happe S, Anderer P, Gruber G, et al. Scalp topography of the spontaneous K-complex and of delta-waves in human sleep. Brain Topogr. 2002;15:43–9. doi: 10.1023/a:1019992523246. [DOI] [PubMed] [Google Scholar]
- 8.Werth E, Achermann P, Borbely AA. Fronto-occipital EEG power gradients in human sleep. J Sleep Res. 1997;6:102–12. doi: 10.1046/j.1365-2869.1997.d01-36.x. [DOI] [PubMed] [Google Scholar]
- 9.Adrian ED, Matthews BH. The Berger rhythm potential changes from the occipital lobes in man. Brain. 1934;57:355–85. doi: 10.1093/brain/awp324. [DOI] [PubMed] [Google Scholar]
- 10.American Academy of Sleep Medicine [Internet] Scoring Manual FAQ. [cited 2013 December 4] Available: http://www.aasmnet.org/scoringmanualfaq.aspx.
- 11.Epstein CM. The nuts and bolts of electroencephalography. Sleep Med Clin. 2012;7:1–12. [Google Scholar]
- 12.Epstein CM, Brickley GP. Interelectrode distance and amplitude of the scalp EEG. Electroencephalogr Clin Neurophysiol. 1985;60:287–92. doi: 10.1016/0013-4694(85)90001-x. [DOI] [PubMed] [Google Scholar]
- 13.Kemp B, van Someren P, Roessen M, et al. Assessment of human sleep depth is being de-standardized by recently advised EEG electrode locations. PLoS One. 2013;8:e71234. doi: 10.1371/journal.pone.0071234. [DOI] [PMC free article] [PubMed] [Google Scholar]
- 14.Urbaniak GC, Plous S. Research Randomizer (Version 3.0) [Computer software] Retrieved on January 22, 2012, from http://www.randomizer.org/
- 15.Shapiro SS, Wilk MB. An analysis of variance test for normality (complete sample) Biometrika. 1965;52:591–611. [Google Scholar]
- 16.Bland JM, Altman DG. Statistical methods for assessing agreement between two methods of clinical measurement. Lancet. 1986;1:307–10. [PubMed] [Google Scholar]
- 17.Cohen J. A coefficient of agreement for nominal scales. Educ Psychol Meas. 1960;20:37–46. [Google Scholar]
- 18.Fleiss JL. Measuring nominal scale agreement among many raters. Psychol Bull. 1971;76:378–82. [Google Scholar]
- 19.Moser D, Anderer P, Gruber G, et al. Sleep classification according to AASM and Rechtschaffen & Kales: effects on sleep scoring parameters. Sleep. 2009;32:139–49. doi: 10.1093/sleep/32.2.139. [DOI] [PMC free article] [PubMed] [Google Scholar]
- 20.Ruehland WR, O'Donoghue FJ, Pierce RJ, et al. The 2007 AASM recommendations for EEG electrode placement in polysomnography: impact on sleep and cortical arousal scoring. Sleep. 2011;34:73–81. doi: 10.1093/sleep/34.1.73. [DOI] [PMC free article] [PubMed] [Google Scholar]
- 21.Dement W, Kleitman N. Cyclical variations in EEG during sleep and their relation to eye movements, body motility and dreaming. Clin Neurophysiol. 1957;9:673–90. doi: 10.1016/0013-4694(57)90088-3. [DOI] [PubMed] [Google Scholar]
- 22.Berry RB, Brooks R, Gamaldo CE, et al. Darien, IL: American Academy of Sleep Medicine; 2014. for the American Academy of Sleep Medicine. The AASM Manual for the Scoring of Sleep and Associated Events: Rules, Terminology and Technical Specifications, Version 2.0.3. www.aasmnet.org. [Google Scholar]
- 23.van Sweden B, Kemp B, Kamphuisen HA, et al. Alternative electrode placement in (automatic) sleep scoring (Fpz-Cz/Pz-Oz versus C4-A1) Sleep. 1990;13:279–83. doi: 10.1093/sleep/13.3.279. [DOI] [PubMed] [Google Scholar]
- 24.Silber MH, Ancoli-Israel S, Bonnet MH, et al. The visual scoring of sleep in adults. J Clin Sleep Med. 2007;3:121–31. [PubMed] [Google Scholar]
- 25.Grigg-Damberger MM. The AASM Scoring Manual four years later. J Clin Sleep Med. 2012;8:323–32. doi: 10.5664/jcsm.1928. [DOI] [PMC free article] [PubMed] [Google Scholar]
- 26.Danker-Hopfe H, Anderer P, Zeitlhofer J, et al. Interrater reliability for sleep scoring according to the Rechtschaffen & Kales and the new AASM standard. J Sleep Res. 2009;18:74–84. doi: 10.1111/j.1365-2869.2008.00700.x. [DOI] [PubMed] [Google Scholar]
- 27.EEG arousals: scoring rules and examples: a preliminary report from the Sleep Disorders Atlas Task Force of the American Sleep Disorders Association. Sleep. 1992;15:173–84. [PubMed] [Google Scholar]
- 28.Bonnet MH, Doghramji K, Roehrs T, et al. The scoring of arousal in sleep: reliability, validity, and alternatives. J Clin Sleep Med. 2007;3:133–45. [PubMed] [Google Scholar]


