

Abstract
Objective
To assess the frequency of symptoms in a general population sample over the previous week and the associations between symptom reporting and demographic factors, medical visits and medication use.
Design
A representative general population sample (n=1000) was recruited using random digit dialling. Participants were asked whether they had experienced any of a list of 46 symptoms in the previous 7 days and if so, whether the symptom was mild, moderate or severe. Demographic data and information on medical visits and medication use were also collected.
Results
Symptom reporting was very common. The median number of symptoms reported by participants in the previous week was 5 with only 10.6% of participants reporting no symptoms. The five most common symptoms in the previous 7 days were: back pain (38%), fatigue (36%), headache (35%), runny or stuffy nose (34%) and joint pain (34%). The five symptoms rated highest in terms of severity were sexual difficulties, vomiting, tremor, suicidal thoughts and sleep problems. Symptom reporting was significantly positively associated with medical visits in the previous year and current medication taking. Women reported a significantly greater number of symptoms. We found no significant association between age or household size and symptom reporting.
Conclusions
This population-based study found that symptoms are more commonly experienced in the general population than previously estimated and are strongly associated with healthcare visits. Appreciation of the high prevalence of symptoms may help normalise the experience of symptom reports among the general population.
Keywords: Public Health, General Medicine (see Internal Medicine), Epidemiology
Strengths and limitations of this study.
Our participants were a large representative sample that allowed us to estimate the prevalence of a wide range of symptoms in the general population.
We used a longer symptom questionnaire than in previous research. This allowed us to assess a greater range of symptoms experienced in the previous 7 days.
The survey was conducted during the New Zealand winter period and this may mean that flu and cold symptoms are more prominent during this period.
The survey was reliant on self-reported symptoms and it was not possible to check the veracity of participant's symptoms.
Introduction
Physical symptoms are often believed to be a sign of poor health but previous research shows that symptoms are a common daily experience and, in most cases, unassociated with serious illness.1 2 While there is considerable research activity on the psychological effects of serious illness, such as cancer and cardiovascular disease, there is less work on the burden and factors associated with more frequently occurring daily symptoms. This is despite the fact that such symptoms are the major cause of medical visits and healthcare costs, and are strongly related to disability.3 4 While the vast majority of symptoms are transient and benign, doctors working in primary care frequently deal with a large number of patients who present with bodily symptoms but no medical diagnosis.5 At the other end of the continuum, some patients with serious symptoms often delay for a lengthy time before seeking medical care, which can compromise their health.6 7
Previous research on daily symptoms has been limited by the lack of a standard measure that adequately captures the breadth and severity of daily symptom reports. A recent review of measures used in symptom studies identified 40 different self-report symptom scales ranging in length from 5 to 78 symptoms, with 48% of scales consisting of 15 or fewer items.8 The instruments also varied in the time frame used for symptom recall from a 7-day period up to a lifetime. Many scales were designed specifically to assess medically unexplained symptoms. Perhaps most surprising was the lack of consistency in assessing common symptoms. While 70% of the questionnaires assessed headaches, other relatively common symptoms were inconsistently assessed, with only 43% of scales assessing fatigue, 38% heart palpitations, 30% vomiting and 23% joint pain.8 Unfortunately, two of the scales recommended by this review, the Symptom Checklist-90 Somatisation Scale and Patient Health Questionnaire-15, only have a limited number of physical symptoms and are focused on identifying somatisation.
As many of the previous studies looking at the frequency of physical symptoms have focused on medically unexplained symptoms, a large proportion of the sample of previous studies of symptoms has been drawn from medically defined samples such as individuals registered with general practices,9–11 primary care samples,12–14 hospital outpatients2 15 or high users of hospital care.16 Where general population samples have been used, the number and range of symptoms assessed tend to be much smaller, which makes it difficult to get an accurate picture of the breadth and frequency of symptoms experienced in the general population.17–19
In the current study we were interested in assessing the following questions: (1) How frequently do individuals in the general population report experiencing symptoms in the previous 7 days? (2) What symptoms are most common and which are rated as being the most severe? (3) What are the associations between symptom reporting and medication use, medical visits and demographic factors? To examine these questions we administered a comprehensive 46-item symptom checklist to a large nationally representative general population.
Method
Participants
A representative sample of 1000 members of the New Zealand population was recruited using random digit dialling. A nationally representative sample was achieved using set quotas based on the age, gender and regional distribution within New Zealand. Telephone interviews were conducted over June and July 2013. In total, 24 068 numbers were called to achieve the final survey sample of 1000 participants. From a total of 11 453 calls to residential landlines that were answered, 6354 declined to participate and 233 were excluded because of language difficulty. After eligibility was assessed, 4899 people were deemed eligible to participate. Of these, 3876 were excluded because the group to which they belonged—with regard to age, gender and region—was already sufficiently represented in the sample. A small number of participants (n=23) abandoned the interview part way.
Measures
Symptoms
Interviewers read a list of 46 symptoms and asked respondents whether they had experienced any of the symptoms in the previous 7 days and if so, whether the symptom was mild, moderate or severe. The symptom list included 36 items from the General Assessment of Side Effects Scale,20 a measure designed to assess commonly reported medication side effects. The scale is a comprehensive measure of common side effects and has demonstrated good psychometric properties in a large German general population.20 While the scale does cover drug side effects, it does not include some of the commonly reported symptoms frequently found in other symptom scales. Therefore, 10 additional common symptoms were added. These items were: cough, congested or runny nose, ear or hearing problems, eye or vision problems, upset stomach or indigestion, numbness or tingling sensations, drowsiness, memory problems, difficulty concentrating and muscle weakness. Each of the 46 symptoms was coded from 0 (not present) to 3 (severe). Cronbach's α showed the scale had high internal consistency (α=0.90). Corrected item-total correlations ranged from r=0.60 (fatigue) to r=0.19 (increased appetite). The total number of symptoms was created by summing dichotomised (present or not present) symptoms minus menstruation.
Demographic and clinical information
Information was collected on the participants’ gender, age group, marital status, employment, education, ethnicity, residence region and the number of adults currently residing in their household. Participants were also asked to recall how many times they had visited their family doctor (for themselves) during the previous year, and whether they were taking any prescription medications for the treatment of an illness (excluding a contraceptive pill). Female participants were also asked if they were currently pregnant.
Statistical analysis
Statistical analyses were conducted using IBM SPSS Statistics V.20. Frequency information was calculated for individual symptoms, as well as the total number of symptoms reported by each participant. An intensity score was calculated for each symptom by dividing the sum of the intensity ratings (ranging from 1 to 3) by the total number of times that symptom was reported. χ2 tests were used to assess gender differences in the percentage of participants reporting individual symptoms. Independent samples t tests were used to assess differences in the number of symptoms reported by participants across medication use, sex and education level. Pearson's correlations were used to investigate the relationship between symptom reporting and age group, number of adults in the household and the reported number of general practitioner (GP) visits during the previous year. Analysis of variance (ANOVA) was used to further investigate differences in the number of symptoms reported by people who visited their GP zero (n=214), one (n=239), two (n=198), three to four (n=189) or five or more times during the previous year (n=159). An α level of 0.05 was used for all statistical tests.
Results
We first examined the total number of symptoms reported by participants in the previous 7 days. Reports of symptoms were very common with only 10.6% of participants reporting no symptoms. The number of symptoms reported ranged from 0 to 36 with 49.6% reporting fewer than five symptoms and 23% reporting 10 or more (see figure 1).
Figure 1.
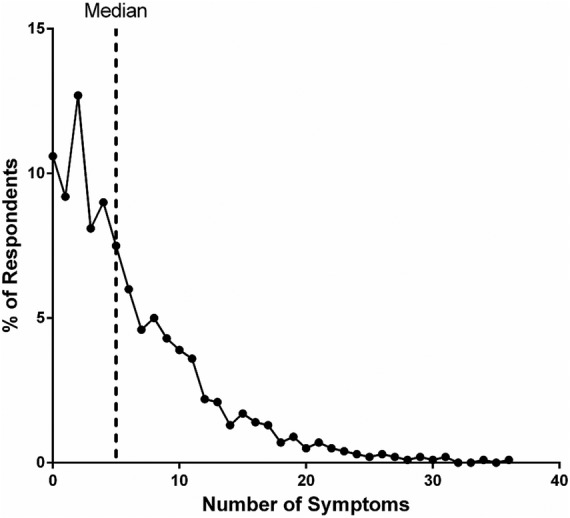
Number of symptoms reported in last 7 days.
The five most common symptoms in the previous 7 days were: back pain, fatigue, headache, runny or stuffy nose and joint pain. The reference data for the frequency of symptoms reported in the general population and by sex are presented in table 1.
Table 1.
Symptoms in previous 7 days in total sample and by sex
| Sex |
Total sample n (%) |
|||||
|---|---|---|---|---|---|---|
| Male n (%) |
Female n (%) |
|||||
| Back or neck pain* | 171 | (34.8) | 211 | (41.5) | 382 | (38.2) |
| Fatigue or loss of energy*** | 139 | (28.3) | 216 | (42.4) | 355 | (35.5) |
| Headache*** | 137 | (27.9) | 217 | (42.6) | 354 | (35.4) |
| Congested or runny nose | 163 | (33.2) | 181 | (35.6) | 344 | (34.4) |
| Joint pain or stiffness | 164 | (33.4) | 172 | (33.8) | 336 | (33.6) |
| Insomnia or sleeping problems* | 120 | (24.4) | 166 | (32.6) | 286 | (28.6) |
| Cough* | 125 | (25.5) | 158 | (31.0) | 283 | (28.3) |
| Muscle pain | 115 | (23.4) | 116 | (22.8) | 231 | (23.1) |
| Low blood pressure or circulation problems*** | 77 | (15.7) | 136 | (26.7) | 213 | (21.3) |
| Upset stomach or indigestion | 99 | (20.2) | 94 | (18.5) | 193 | (19.3) |
| Irritability or nervousness* | 72 | (14.7) | 102 | (20.0) | 174 | (17.4) |
| Skin rash or itching | 68 | (13.8) | 92 | (18.1) | 160 | (16.0) |
| Difficulty concentrating* | 63 | (12.8) | 89 | (17.5) | 152 | (15.2) |
| Dry mouth | 62 | (12.6) | 83 | (16.3) | 145 | (14.5) |
| Anxiety or fearfulness | 62 | (12.6) | 79 | (15.5) | 141 | (14.1) |
| Drowsiness | 67 | (13.6) | 73 | (14.3) | 140 | (14.0) |
| Depressed mood | 78 | (15.9) | 60 | (11.8) | 138 | (13.8) |
| Breathing problems | 65 | (13.2) | 67 | (13.2) | 132 | (13.2) |
| Agitation | 64 | (13.0) | 63 | (12.4) | 127 | (12.7) |
| Numbness or tingling sensations | 59 | (12.0) | 65 | (12.8) | 124 | (12.4) |
| Memory problems*** | 43 | (8.8) | 78 | (15.3) | 121 | (12.1) |
| Abdominal pain* | 46 | (9.4) | 71 | (13.9) | 117 | (11.7) |
| Ear or hearing problems | 62 | (12.6) | 55 | (10.8) | 117 | (11.7) |
| Eye or vision problems | 51 | (10.4) | 60 | (11.8) | 111 | (11.1) |
| Nightmares or abnormal dreams | 47 | (9.6) | 62 | (12.2) | 109 | (10.9) |
| Muscle weakness | 54 | (11.0) | 55 | (10.8) | 109 | (10.9) |
| Hot flushes*** | 16 | (3.3) | 76 | (14.9) | 92 | (9.2) |
| Reduced appetite* | 34 | (6.9) | 55 | (10.8) | 89 | (8.9) |
| Increased appetite | 46 | (9.4) | 42 | (8.3) | 88 | (8.8) |
| Dizziness | 36 | (7.3) | 50 | (9.8) | 86 | (8.6) |
| Nausea*** | 27 | (5.5) | 57 | (11.2) | 84 | (8.4) |
| Tendency to develop bruises*** | 14 | (2.9) | 66 | (13.0) | 80 | (8.0) |
| Tremor or muscle spasms | 45 | (9.2) | 35 | (6.9) | 80 | (8.0) |
| Palpitations or irregular heartbeat** | 22 | (4.5) | 49 | (9.6) | 71 | (7.1) |
| Chest pain | 38 | (7.7) | 33 | (6.5) | 71 | (7.1) |
| Fever or increased temperature** | 23 | (4.7) | 47 | (9.2) | 70 | (7.0) |
| Diarrhoea | 34 | (6.9) | 33 | (6.5) | 67 | (6.7) |
| Abnormal sweating* | 20 | (4.1) | 36 | (7.1) | 56 | (5.6) |
| Hair loss | 24 | (4.9) | 27 | (5.3) | 51 | (5.1) |
| Constipation | 19 | (3.9) | 29 | (5.7) | 48 | (4.8) |
| Sexual problems | 22 | (4.5) | 15 | (2.9) | 37 | (3.7) |
| Difficulty urinating** | 22 | (4.5) | 6 | (1.2) | 28 | (2.8) |
| Thoughts about suicide** | 18 | (3.7) | 6 | (1.2) | 24 | (2.4) |
| Vomiting | 7 | (1.4) | 15 | (2.9) | 22 | (2.2) |
| Convulsions or seizures | 3 | (0.6) | 5 | (1.0) | 8 | (0.8) |
| Painful or irregular menstruation | 45 | (8.8) | ||||
Sex differences *p≤0.05; **p≤0.01; ***p≤0.001.
Using data from only participants who experienced the symptoms, most symptoms were rated as mild, with an average intensity rating of M=1.39 (SD=0.10). The highest rated symptoms in terms of intensity were sexual difficulties, vomiting, tremor or muscle spasms and thoughts about suicide. However, typically the symptoms with the highest intensity raters were infrequently reported (table 2).
Table 2.
The 10 most highly rated symptoms by intensity
| Mean intensity/3 | Symptom frequency rank | |
|---|---|---|
| Sexual problems | 1.62 | 41 |
| Vomiting | 1.59 | 44 |
| Tremor or muscle spasms | 1.55 | 33 |
| Thoughts about suicide | 1.54 | 43 |
| Insomnia or sleeping problems | 1.53 | 6 |
| Nightmares or abnormal dreams | 1.52 | 26 |
| Abdominal pain | 1.52 | 22 |
| Muscle weakness | 1.50 | 25 |
| Convulsions or seizures | 1.50 | 45 |
| Back or neck pain | 1.48 | 1 |
We next examined associations between symptom reporting and medication use, medical visits and demographic factors. Current medication taking was reported by 39% of respondents. We found that symptom reporting was significantly higher in those participants who also reported taking medication (M=8.32, SE=0.35) compared with those not taking medication (M=4.91, SE=0.19), t(614.66)=−8.55, p<0.001.
The number of reported symptoms in the previous 7 days was also associated with the number of GP visits in the previous year, r=0.25, p<0.001. This effect was further investigated using ANOVA, comparing the number of symptoms reported across five GP visit groups (0 visits, 1 visit, 2 visits, 3 or 4 visits and 5 or more visits to the GP over the previous year). There was a significant main effect of the frequency of GP visits on the total number of symptoms reported, F(4, 994)=34.28, p<0.001 (see figure 2). Post hoc tests using a Bonferroni correction revealed that participants who reported never seeing their GP in the previous year reported significantly fewer symptoms (M=3.97, SE=0.38) than those who reported one visit (M=4.80, SE=0.36), two visits (M=6.22, SE=0.39), three or four visits (M=7.39, SE=0.40) and five or more visits (M=10.08, SE=0.44); p values for all comparisons <0.001. Participants who went to the GP only once reported fewer symptoms than those who went three or more times, p<0.001, and participants who reported attendance at their GP clinic five or more times during the previous year reported significantly higher numbers of symptoms than all other groups; p<0.001.
Figure 2.
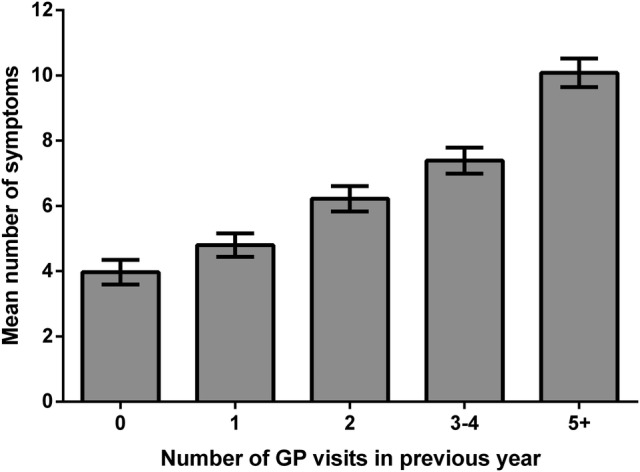
The mean (SE) number of symptoms reported in the previous 7 days and the number of general practitioner (GP) visits in the previous year.
In terms of demographic differences, the overall number of symptoms reported by women (M=6.88, SE=0.27) was significantly higher than men (M=5.59, SE=0.25), t(998)=−3.49, p<0.001. We found that 17 of 45 symptoms were significantly more reported by female respondents. Two symptoms, difficulty urinating and thoughts about suicide, were more commonly reported by men; all p values <0.05 (see table 1). Symptom reporting was lower in participants who reported a tertiary (M=5.78, SE=0.22) versus a secondary school-level education (M=6.69, SE=0.32), t(771.56)=2.35, p=0.02. However, we found no association between the number of symptoms reported and age, r=−0.03, p=0.34, or household size, r=−0.02, p=0.56.
We also looked at sex differences in medication use and GP visits. There was no significant difference between men (38.5%) and women (39.7%) in medication use, χ² (1, N=1000)=0.149, p=0.70. However, there was a significant difference between men and women in reported GP visits, χ² (4, N=999)=23.707, p<0.001. Men (27.3%) were more likely to report no GP visits in the previous year, compared with women (15.7%). Consistent with this, more women (18.9%) reported five or more GP visits during the previous year than men (12.9%).
Discussion
In a large nationally representative sample responding to a large comprehensive symptom questionnaire we found symptom reports to be very common. The median number of symptoms reported by participants was five in the previous week. The most common symptoms reported by participants were fatigue, back pain and headache. Higher symptom reporting was strongly associated with previous GP visits, medication taking and female gender.
The most common symptoms in the current survey are consistent with previous UK studies using samples drawn from GP practice lists. However, the current study, which uses a larger range of symptoms than previous population surveys, suggests that the symptom burden is likely to be higher among the general population than previous studies have suggested. The study also identified that there is a significant proportion of the general population that experiences a large number of symptoms each week with a fifth of the sample experiencing over 10 symptoms a week and 10% reporting 14 or more symptoms.
The five most common symptoms in this survey, back pain, symptoms of fatigue, headache, congested or runny nose and joint pain or stiffness, are also commonly reported in other studies. Four of the five are in the topmost common symptoms reported in McAteer et al's9 survey and three also appear in the top five symptoms reported by Hannay.10 In terms of the study limitations, it should be noted that the survey was reliant on self-reported symptoms and it was not possible to check the veracity of participants’ symptoms. Also, the survey was mostly focused on physical symptoms rather than mental health problems. It should also be noted that the survey was conducted during the New Zealand winter period and this may mean that flu and cold symptoms are more prominent during this period.
Bearing in mind these limitations, our findings suggest that symptoms in the general population are more common than previously believed and may be strong drivers for the use of healthcare. Previous studies have also found that high symptom reporting was associated with an increased number of reported bodily pain sites,21 as well as greater use of healthcare and increased mortality, even after controlling for relevant confounders.22 Interestingly, a recent study in general practice patients also found that as symptom reports increased, so did the patients’ belief that they were suffering from an unexplained condition such as amalgam poisoning, electromagnetic sensitivity or chronic fatigue syndrome.23
Understanding the breadth and depth of symptom reporting in the general population is important to appreciate the scope for common symptoms to be misconstrued as indicative of serious health conditions. The symptoms most commonly reported in the study, such as back pain, fatigue and headache are not reliable indicators of underlying pathology, but are often reported in medically unexplained syndromes, associated with functional disability and high healthcare utilisation.24 Further, given the ease with which symptom reports are ascribed to perceived environmental threats which pose no genuine health risk,25 26 an insight into the extent that reported symptoms are part of the normal human experience may provide reassurance to those with health concerns and reduce symptom misattribution.27 Ensuring that the general public and medical professionals have access to reliable information about the prevalence of symptoms may normalise the experience of symptoms, allay distress and reduce healthcare seeking, as well as help to prevent unnecessary medical testing and overdiagnosis.
Supplementary Material
Footnotes
Contributors: KJP generated the initial study idea. KJP, KF and AG designed the study and drafted the manuscript. KF and FC performed the data analysis. All authors assisted with the interpretation of the results and critical revision of the manuscript. KJP is the guarantor of this study.
Funding: This research was funded by Pharmac, the New Zealand Government's Pharmaceutical Management Agency.
Competing interests: None.
Ethics approval: Auckland University Ethics Committee.
Provenance and peer review: Not commissioned; externally peer reviewed.
Data sharing statement: No additional data are available.
References
- 1.Pennebaker JW. The psychology of physical symptoms. New York: Springer-Verlag, 1982 [Google Scholar]
- 2.Kroenke K, Mangelsdorff AD. Common symptoms in ambulatory care: incidence, evaluation, therapy, and outcome. Am J Med 1989;86:62–6 [DOI] [PubMed] [Google Scholar]
- 3.Bruusgaard D, Tschudi-Madsen H, Ihlebaek C, et al. Symptom load and functional status: results from the Ullensaker population study. BMC Public Health 2012;12:1085. [DOI] [PMC free article] [PubMed] [Google Scholar]
- 4.Barsky AJ, Orav EJ, Bates DW. Somatization increases medical utilization and costs independent of psychiatric and medical comorbidity. Arch Gen Psychiatry 2005;62:903–10 [DOI] [PubMed] [Google Scholar]
- 5.Kroenke K. Patients presenting with somatic complaints: epidemiology, psychiatric comorbidity and management. Int J Methods Psychiatr Res 2003;1113:774–9 [DOI] [PMC free article] [PubMed] [Google Scholar]
- 6.Perry K, Petrie KJ, Ellis CJ, et al. Symptom expectations and delay in acute myocardial infarction patients. Heart 2001;86:91–2 [DOI] [PMC free article] [PubMed] [Google Scholar]
- 7.Meechan G, Collins J, Petrie KJ. The relationship of symptoms and psychological factors to delay in seeking medical care for breast symptoms. Prev Med 2003;36:374–8 [DOI] [PubMed] [Google Scholar]
- 8.Zijlema WL, Stolk RP, Lowe B, et al. How to assess common somatic symptoms in large-scale studies: a systematic review of questionnaires. J Psychosom Res 2013;74:459–68 [DOI] [PubMed] [Google Scholar]
- 9.McAteer A, Elliott AM, Hannaford PC. Ascertaining the size of the symptom ice-berg in a UK-wide community-based survey. Br J Gen Pract 2011;61:e1–11 [DOI] [PMC free article] [PubMed] [Google Scholar]
- 10.Hannay DR. Symptom prevalence in the community. J R Coll Gen Pract 1978;28:492–9 [PMC free article] [PubMed] [Google Scholar]
- 11.Elliott AM, McAteer A, Hannaford PC. Revisiting the symptom iceberg in today's primary care: results from a UK population survey. BMC Fam Pract 2011;12:16. [DOI] [PMC free article] [PubMed] [Google Scholar]
- 12.Kroenke K, Spitzer RL, deGruy FV, et al. A symptom checklist to screen for somatoform disorders in primary care. Psychosomatics 1998;39:263–72 [DOI] [PubMed] [Google Scholar]
- 13.Interian A, Allen LA, Gara MA, et al. Somatic complaints in primary care: further examining the validity of the Patient Health Questionnaire (PHQ-15). Psychosomatics 2006;47:392–8 [DOI] [PubMed] [Google Scholar]
- 14.Steinbrecher N, Koerber S, Frieser D, et al. The prevalence of medically (unexplained symptoms in primary care. Psychosomatics 2011;52:263–71 [DOI] [PubMed] [Google Scholar]
- 15.Kroenke K, Arrington ME, Mangelsdorff AD. The prevalence of symptoms in medical outpatients and the adequacy of therapy. Arch Intern Med 1990;150:1685–9 [DOI] [PubMed] [Google Scholar]
- 16.Reid S, Wessely S, Crayford T, et al. Medically unexplained symptoms in frequent attenders of secondary health care: retrospective cohort study. BMJ 2001;322:1–4 [DOI] [PMC free article] [PubMed] [Google Scholar]
- 17.Eriksen HR, Svendsrod R, Ursin G, et al. Prevalence of subjective health complaints in the Nordic European countries in 1993. Eur J Public Health 1998;8:294–8 [Google Scholar]
- 18.Kroenke K, Price RK. Symptoms in the community: prevalence, classification, and psychiatric comorbidity. Arch Intern Med 1993;153:2474–80 [PubMed] [Google Scholar]
- 19.Ihlebaek C, Eriksen HR, Ursin H. Prevalence of subjective health complaints (SHC) in Norway. Scand J Public Health 2002;30:20–9 [PubMed] [Google Scholar]
- 20.Rief W, Barsky AJ, Glombiewski JA, et al. Assessing general side effects in clinical trials: reference data from the general population. Pharmacoepidemiol Drug Saf 2011;20:405–15 [DOI] [PubMed] [Google Scholar]
- 21.Tschudi-Madsen H, Kjeldsberg M, Natvig B, et al. A strong association between non-musculoskeletal pain symptoms: results from a population study. BMC Musculoskelet Disord 2011;12:258. [DOI] [PMC free article] [PubMed] [Google Scholar]
- 22.Ladwig KH, Marten-Mittag B, Lacruz ME, et al. Screening for multiple somatic complaints in a population-based survey: does excessive symptom reporting capture the concept of somatic symptom disorders? Findings from the MONICA-KORA Cohort Study. J Psychosom Res 2010;68:427–37 [DOI] [PubMed] [Google Scholar]
- 23.Tschudi-Madsen H, Kjeldsberg M, Natvig B, et al. Medically unexplained conditions considered by patients in general practice. Fam Pract 2014;31:156–63 [DOI] [PubMed] [Google Scholar]
- 24.Kroenke K. Patients presenting with somatic complaints: epidemiology, psychiatric comorbidity and management. Int J Methods Psychiatr Res 2003;12:34–43 [DOI] [PMC free article] [PubMed] [Google Scholar]
- 25.Page L, Petrie KJ, Wessely S. Psychosocial responses to environmental incidents: a review and proposed typology. J Psychosom Res 2006;60:413–22 [DOI] [PubMed] [Google Scholar]
- 26.Rubin GJ, Nieto-Hernandez R, Wessely S. Idiopathic environmental intolerance attributed to electromagnetic fields (formerly “electromagnetic hypersensitivity”)” An updated systematic review of provocation studies. Bioelectromagnetics 2010;31:1–11 [DOI] [PubMed] [Google Scholar]
- 27.Filipkowski K, Smyth J, Rutchick A, et al. Do healthy people worry? Modern health worries, subjective health complaints, perceived health, and health care utilization. Int J Behav Med 2010;17:182–8 [DOI] [PubMed] [Google Scholar]
Associated Data
This section collects any data citations, data availability statements, or supplementary materials included in this article.