Abstract
In honey bees (Apis mellifera), the epigenetic mark of DNA methylation is central to the developmental regulation of caste differentiation, but may also be involved in additional biological functions. In this study, we examine the whole genome methylation profiles of three stages of the haploid honey bee genome: unfertilised eggs, the adult drones that develop from these eggs and the sperm produced by these drones. These methylomes reveal distinct patterns of methylation. Eggs and sperm show 381 genes with significantly different CpG methylation patterns, with the vast majority being more methylated in eggs. Adult drones show greatly reduced levels of methylation across the genome when compared with both gamete samples. This suggests a dynamic cycle of methylation loss and gain through the development of the drone and during spermatogenesis. Although fluxes in methylation during embryogenesis may account for some of the differentially methylated sites, the distinct methylation patterns at some genes suggest parent-specific epigenetic marking in the gametes. Extensive germ line methylation of some genes possibly explains the lower-than-expected frequency of CpG sites in these genes. We discuss the potential developmental and evolutionary implications of methylation in eggs and sperm in this eusocial insect species.
Keywords: Apis mellifera, DNA methylation, Gametes, Epigenetic, Imprinting
INTRODUCTION
One of the most intriguing discoveries of the honey bee (Apis mellifera) genome project (Weinstock et al., 2006) was the identification of a fully functional DNA methylation system (Wang et al., 2006). DNA methylation is a widespread biological phenomenon in which a methyl group is covalently bonded to a cytosine residue in a DNA molecule (Bird, 1980; Glastad et al., 2011). DNA methylation occurs via the action of DNA methyltransferase enzymes (DNMTs) (Law and Jacobsen, 2010). Once a site has been methylated by the de novo methyltransferase DNMT3, the epigenetic mark is retained through mitotic cell divisions by the maintenance methyltransferase DNMT1 (Law and Jacobsen, 2010). DNA methylation occurs most frequently at 5′-CG-3′ dinucleotides, referred to as CpG sites (Gonzalgo and Jones, 1997).
The functional consequences of DNA methylation are variable, depending on the genomic context. If methylation occurs within a promoter region, transcription can be repressed, leading to gene silencing (Bird and Wolffe, 1999). By contrast, if methylation occurs within the body of a gene, methylation can be associated with active transcription and differential gene splicing (Elango et al., 2009; Foret et al., 2012). In most species studied to date, DNA methylation is crucial for development and cellular differentiation, modulating the regulation of gene expression in different tissues (Paulsen and Ferguson-Smith, 2001; Bonasio et al., 2010a).
A honey bee colony comprises two female castes: a single fertile queen and several tens of thousands of sterile female workers. There are often several hundred male drones present as well. Queens and workers are derived from fertilised (i.e. diploid) eggs, whereas drones arise from unfertilised (haploid) eggs. Embryogenesis of unfertilised eggs is initiated by the physical squeezing as the egg passes down the oviduct (Sasaki and Obaru, 2002). The embryo develops from a single maternal cell within the egg, and embryonic DNA is readily detectable by PCR about 24 h after the egg is laid (Roth, K. M., Honours thesis, University of Sydney, 2013). The egg develops for a further 48 h, whereupon the larva hatches from the egg. Male larvae pupate after five days. Spermatogenesis is completed during the pupal stage before the seventh day of pupation (Snodgrass, 1956).
Queens and workers arise from identical eggs, and their developmental trajectory is determined by the level of larval feeding (de Wilde and Beetsma, 1982; Kucharski et al., 2008; Shi et al., 2011). Queen larvae are fed a superabundance of ‘royal jelly’, whereas worker-destined larvae are progressively provisioned with a more Spartan diet (de Wilde and Beetsma, 1982). Nutritional differences between queen- and worker-destined larvae affect the degree of DNA methylation and consequently the differential development of the queen and worker castes. Knockdown of the A. mellifera Dnmt3 gene by RNA interference results in the development of a queen phenotype from worker-destined female larvae (Kucharski et al., 2008). There are extensive differences in the methylation patterns of the brains of adult queens and workers (Lyko et al., 2010) and between worker- and queen-destined larvae (Foret et al., 2012). In adult worker subcastes methylation shows reversible plasticity and is thought to be involved in the behavioural transition from nursing to foraging roles (Herb et al., 2012).
Compared with unmethylated cytosines, methylated cytosines are highly mutable, resulting in an increased frequency of deamination to thymine (Duncan and Miller, 1980; Gonzalgo and Jones, 1997; Yi and Goodisman, 2009). Thus, if a gene is frequently methylated in the germ line, an overall depletion of CpG sites is expected over evolutionary time (Yi and Goodisman, 2009; Park et al., 2011). By contrast, genes that are infrequently methylated in the germ line are expected to show a higher-than-expected frequency of CpG sites (Bird, 1980; Bock and Lengauer, 2008). Supporting this hypothesis, a number of invertebrate genomes show bimodal distributions of CpG frequency among gene bodies (Bonasio et al., 2010b; Bonasio et al. 2012; Nanty et al., 2011).
The honey bee genome has a strongly bimodal distribution of genes that either show an excess or a depletion of CpG sites (Elango et al., 2009; Foret et al., 2009; Yi and Goodisman, 2009; Nanty et al., 2011). CpG depletion in a subset of honey bee genes suggests that these genes are methylated in the germ line (Elango et al., 2009; Foret et al., 2009; Yi and Goodisman, 2009). Indeed, methylation has been identified in honey bee spermatozoa (Nanty et al., 2011). In the genes examined, the proportion showing methylation and low CpG content was 10-fold higher than the proportion of methylated genes with a high CpG content (Nanty et al., 2011).
In many species, DNA methylation is used to imprint genes in a parent-of-origin specific manner (Reik and Walter, 2001; Brandvain et al., 2011; Holman and Kokko, 2014). In mammals, differential methylation of imprinted genes is established during gametogenesis. During the very early stages of development, methylation marks are largely stripped from the genome of the embryo (Richards, 2006), but certain regions of the maternal and paternal genomes retain a parental ‘imprint’ (Hajkova et al., 2001; Li et al., 2010). In this way, parents can influence gene expression in their offspring in a parent-specific manner (Ferguson-Smith, 2011; Drewell et al., 2012). Thus far there is no direct evidence of parental imprinting in the honey bee, but there is growing evidence that parent-of-origin effects occur (Nielsen et al., 1999; Guzmán-Novoa et al., 2005; Oldroyd et al., 2014). In addition, the caste system may lead to evolutionary conflicts that could provide the conditions for strong selection for the evolution of male- and female-specific epigenetic imprints that would potentially enhance the reproductive success of the parent (Haig, 1992; Queller, 2003; Dobata and Tsuji, 2012; Drewell et al., 2012).
Here, we investigate genome-wide DNA methylation patterns in three stages of development of honey bee drones (the haploid sons of a single queen): the unfertilised eggs, the thorax of the adults and the spermatozoa. We thus investigated whether germline-specific methylation occurs in the honey bee as predicted (Elango et al., 2009; Drewell et al., 2012).
RESULTS
Genome-wide DNA methylation patterns in eggs, adult drones and sperm
We sequenced bisulfite-converted DNA from honey bee eggs, drone thoraxes and sperm (Fig. 1) in three individual sequencing lanes and obtained a dataset of 191 million reads after quality control. Of these reads, 74.5% mapped to unique regions of the genome, which translates into a combined 43× coverage across the genomes from all three samples. The coverage in the individual datasets was generally comparable (supplementary material Fig. S1) and allowed us to analyse methylation at the great majority of CpG sites in the genome. For eggs, median coverage of CpGs was eight reads, with 84.5% of sites covered by two or more reads. For drone thoraxes, median coverage was nine reads, with 85.5% of sites covered by two or more reads, and median coverage for sperm was ten reads, with 87.1% of sites covered by two or more reads (supplementary material Fig. S1).
Fig. 1.
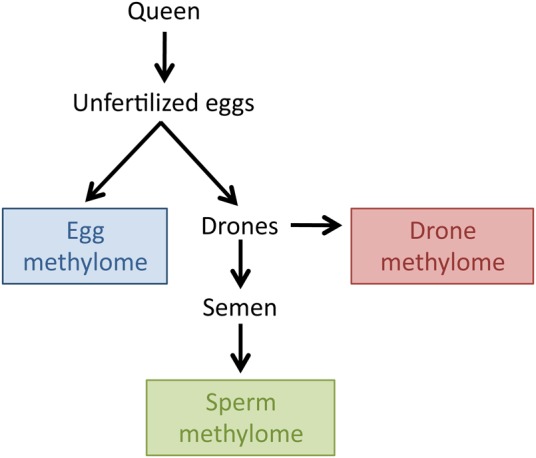
Experimental design. On average, the pooled unfertilized eggs of the queen should be genetically identical to the semen obtained from drones that developed from those eggs, unless epigenetic marks are removed during male drone development or spermatogenesis.
Only a small proportion of the cytosines in the genome are methylated, approximately 159,000 in eggs (0.22%), 147,000 in sperm (0.20%) and 108,000 (0.15%) in the drone thorax. Most of the methylation occurs at CpG dinucleotides (Table 1) located in the exons of genes (Table 2). This profile mirrors previous observations in adult honey bees (Lyko et al., 2010) and indicates that DNA methylation outside of gene bodies and at non-CpG residues is rare. A very low rate of non-conversion of cytosines in a non-CpG context was detected in all three methylomes. In eggs, 99.66% of the Cs were converted to Ts, in sperm 99.56% and in drones 99.50%. In addition, no single non-CpG site failed to be converted when examined across all three samples (see Table 1), suggesting that virtually all cytosines in a non-CpG context in the genome are unmethylated. This finding is in agreement with previously published honey bee studies (Lyko et al., 2010). The complete dataset of tracks, which can be viewed as an added hub in the honey bee genome browser, showing all significantly methylated sites and the sequence context in the genome, is available at: http://www.cs.hmc.edu/~bush/beeMeth/hub.txt
Table 1.
Methylated cytosines in eggs, sperm and drones in CG, CHG and CHH genomic contexts (H=A, T or C)
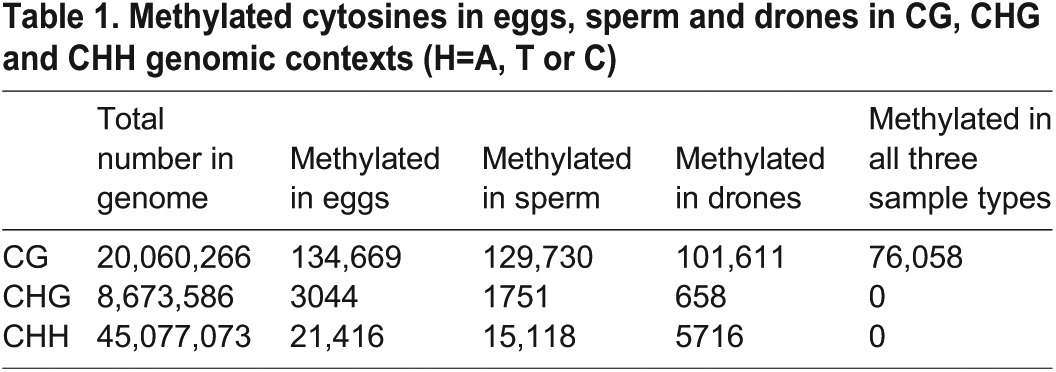
Table 2.
Mapping methylated CG dinucleotides (mCGs) to genomic regions

Of the approximately 20 million CpGs in the genome, there were significant differences in the level of methylation between the three sample types (Table 1;  =3242.98, P<0.001). CpG methylation is significantly higher in sperm than in adult drones (
 =2424.96, P<0.001) and in eggs compared with sperm (
 =1122.46, P<0.001), despite the fact that there are more sequencing reads in our dataset for sperm (6.5×10⁷) than for eggs (5.7×10⁷). A large number (104,115) of methylated CpGs are shared in both egg and sperm cell types and 76,058 are shared in all three samples (Fig. 2A). Overall, the two gamete cell types share more methylated CpG sites than either share with the drone thorax (Fig. 2A). However, 15% of egg and 13% of sperm methylated CpGs are unique to each gamete type, indicating differential methylation between eggs and sperm.
Fig. 2.
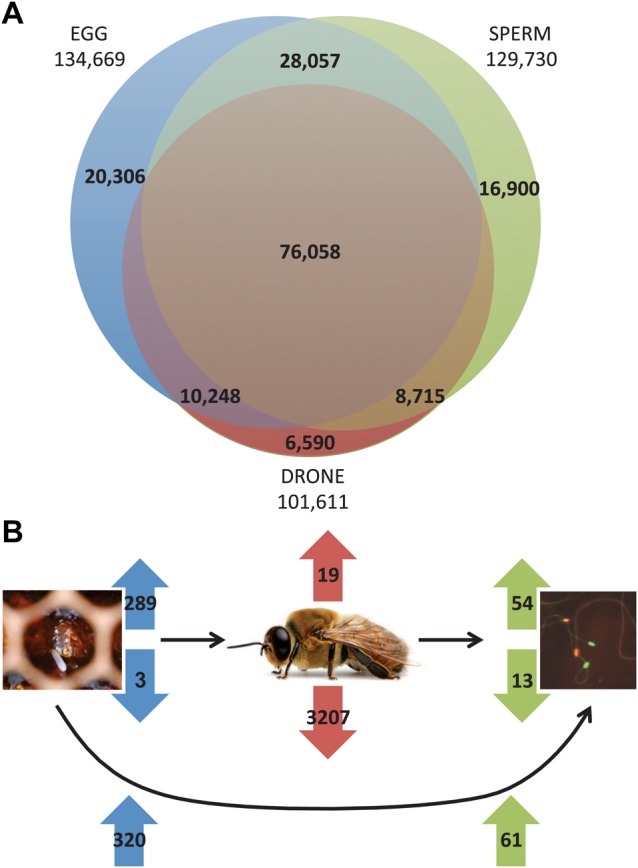
CpG methylation counts in eggs, drone and sperm. (A) The total number of methylated CpGs in each of the three sample types. The adult drone genome has fewer unique methylated CpGs than either eggs or sperm. At each intersection the percentage of methylated Cs in each genome found in a CpG sequence context is ≥99% (egg-drone 99.4%; drone-sperm 99.5%; sperm-egg 99.5%; all three sample types 99.7%). (B) Top: the number of over- and undermethylated DMGs in three-way comparisons between eggs, drones and sperm (blue, red and green arrows, respectively); bottom: the number of overmethylated DMGs in two-way comparison between eggs and sperm (blue and green arrows, respectively).
Identification of differentially methylated genes DMGs in the genome
We examined methylation patterns at all annotated transcription units in the genome. Many genes have coding regions that are completely free of CpG DNA methylation, but slightly more than half have methylated residues (supplementary material Fig. S2). Of the 10,738 annotated genes in the genome, 6694 (62%) in eggs, 6044 (56%) in drones and 6445 (60%) in sperm have at least one methylated residue. In total, there are 7105 genes with at least one CpG with significant methylation in any of the three sample types (eggs, drone thoraxes or sperm) and 5810 with at least one CpG with significant methylation in all three sample types. Many of the most highly methylated genes in each dataset exhibit some level of methylation in all three tissue types examined in this study, as well as in queen and worker brains (Lyko et al., 2010); this suggests a core set of genes in the genome that are targeted for methylation irrespective of caste or cell type. Indeed, of the top 20 most methylated genes in eggs, sperm and drones, 17 were shared. Of the 20 most methylated genes in workers, 17 are also among the 20 most methylated in queens (Lyko et al., 2010). Thirteen genes are common to the top 20 most methylated genes in all five methylomes.
Despite these similarities of the methylome profiles in eggs, adult drone thoraxes and sperm, comparison of the methylation patterns in these three genomes identified a number of differentially methylated genes (DMGs) (supplementary material Table S1). A DMG is defined as a gene that has significantly more or fewer methylated CpGs in a particular methylome when compared with one or more of the other methylomes. This was achieved through pairwise comparisons between each pair of samples (e.g. eggs versus drones) using logistic regression, with methylation as the dependent variable taking on one of two values: methylated or non-methylated, with two categorical variables as predictors: sample type and position in the gene (see Materials and Methods for full details). The significance threshold in all cases was a false discovery rate of 5%. In eggs there are three genes that are significantly less methylated (undermethylated) relative to sperm or the drone thorax and 289 genes are more methylated (overmethylated). In drones, there are 3207 undermethylated genes and 19 overmethylated genes relative to eggs and sperm. In sperm, there are 13 undermethylated genes and 54 overmethylated genes relative to eggs and drone thoraxes (Fig. 2B). These observations, along with the overall greater level of methylation seen in eggs and sperm compared with drones, indicate a loss of methylation during development of the adult drone and a gain of methylation during spermatogenesis (Fig. 2B). However, it is important to stress that the thorax is composed of a number of different cell types, which may harbour distinct methylation patterns. As a result, the thorax methylation profile is a composite of different methylation patterns from different tissues and might not be representative of the methylation profile in the entire adult.
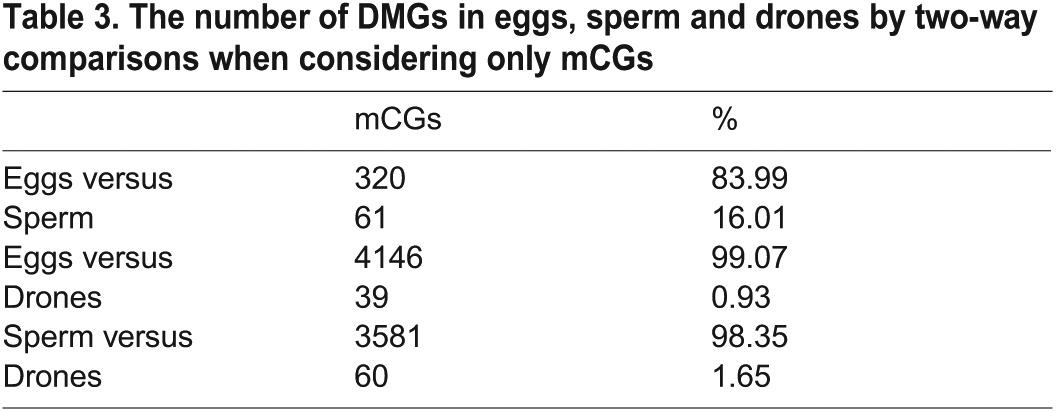
Even though the two gamete samples have more methylation sites in common than they do with the drone thorax, there are significant methylation differences between eggs and sperm, with 381 genes showing differential methylation (Table 3; supplementary material Table S2). Of these DMGs, 320 (84%) were significantly more methylated in eggs than in sperm, whereas 61 (16%) were significantly more methylated in sperm than in eggs (Fig. 2B). By contrast to the null hypothesis that DMG frequencies should be equal in the two tissues, significantly more genes are overmethylated in eggs than in sperm ( =176.1, P<0.0001). The average number of methylated CpGs in the exons of these DMGs is also higher than that seen in non-DMGs, despite the fact that the average combined length of the exons for each gene is not significantly different between the DMGs and non-DMGs (supplementary material Fig. S3). Compared with the 562 DMGs identified in the methylomes of brains from queens and workers (Lyko et al., 2010), 14% of our egg versus sperm DMGs are present in both comparisons (41 from eggs and 11 from sperm, respectively) (supplementary material Table S2).
Table 3.
The number of DMGs in eggs, sperm and drones by two-way comparisons when considering only mCGs
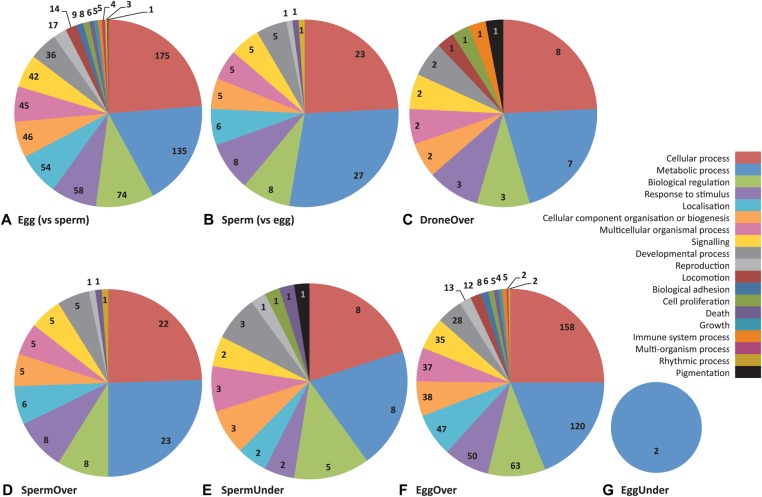
To address the putative biological roles of the DMGs, we extracted the predicted protein sequence of all DMGs from Beebase and assigned Gene Ontology (GO) terms in Blast2Go based on homology to the top BLAST hit and the corresponding GO annotations for each gene (supplementary material Table S2) (Götz et al., 2008). A GO level 2 analysis revealed that over 50% of DMGs in each comparison were classified in general metabolic, cellular and biological regulatory processes (Fig. 3). This observation is consistent with other genome-wide methylation studies in honey bees that showed a positive correlation of DNA methylation at genes with general housekeeping functions (Lyko et al., 2010).
Fig. 3.
GO level 2 categories associated with differentially methylated genes. (A,B) Two-way comparison between eggs and sperm, showing GO terms of DMGs that are overmethylated in (A) eggs compared with sperm, and (B) sperm compared with eggs. (C-G) Three-way comparisons of DMGs showing proportions of associated GO terms for (C) DroneOver: DMGs overmethylated in drones compared with either eggs or sperm; (D) SpermOver: DMGs overmethylated in sperm compared with eggs and drones; (E) SpermUnder: DMGs overmethylated in both eggs and drones compared with sperm; (F) EggOver: DMGs overmethylated in eggs compared with drones and sperm; and (G) EggUnder: DMGs overmethylated in both sperm and drones compared with eggs.
Validation of the methylation profile at individual DMGs
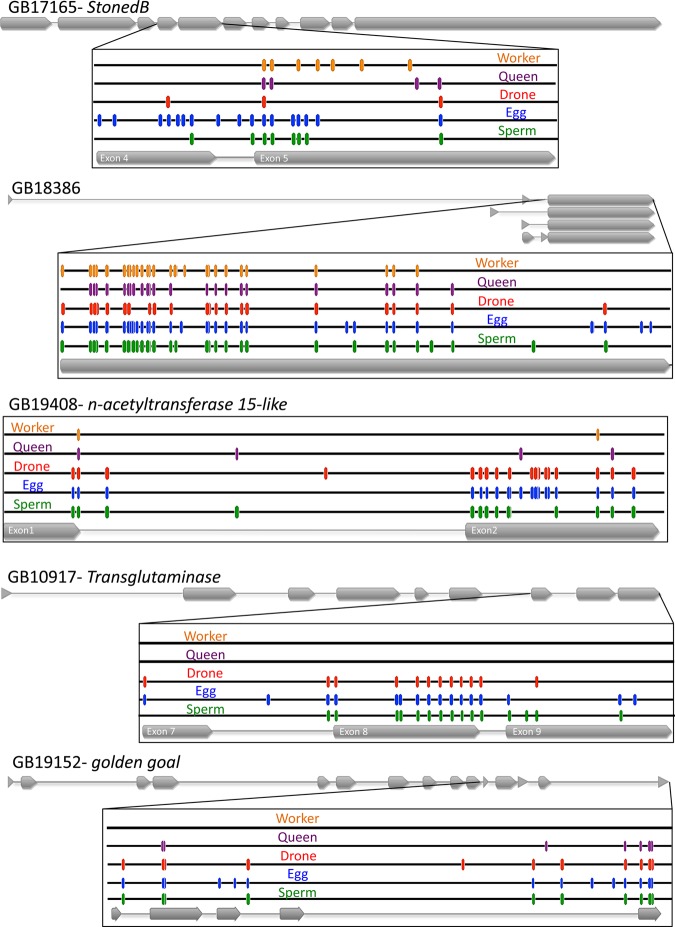
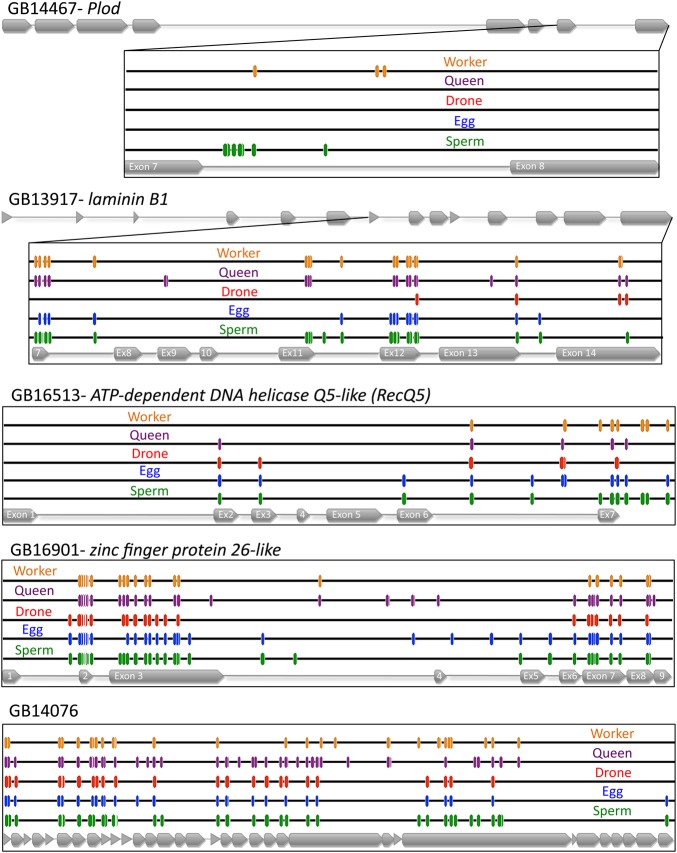
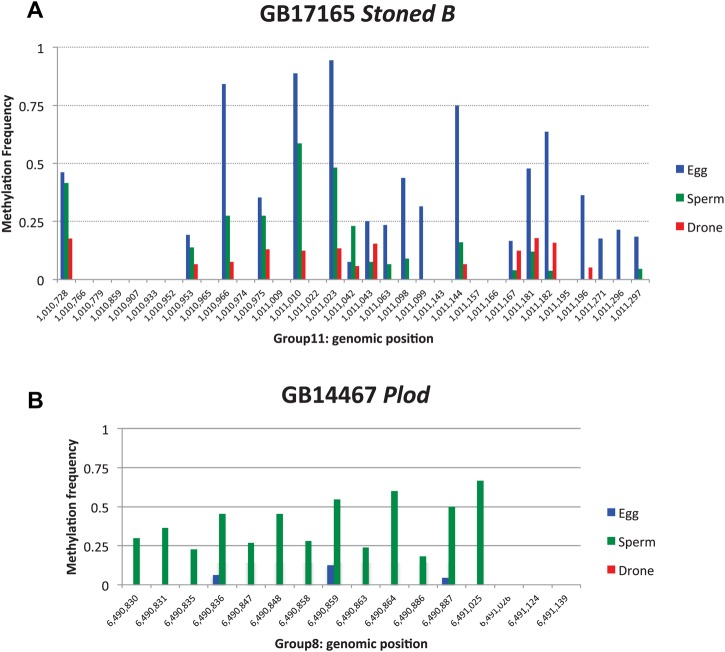
The methylation patterns of the top five DMGs in eggs (Fig. 4) and sperm (Fig. 5) in their genomic context, which shows the exon/intron structure and a comparison of the methylation sites identified in adult drone thoraxes and in worker and queen brains (Lyko et al., 2010), reveals that in some cases the differential methylation is extensive. For example, the top-ranked DMG in eggs (GB17165 Stoned B) has extensive methylation at many CpGs in exon 4, intron 4 and exon 5, whereas the number of methylated sites and the level of methylation are lower in sperm and drones (Fig. 6A). For the top-ranked DMG in sperm (GB14467 Plod), there is a high level of methylation at CpGs in intron 7, which is greatly diminished in eggs and completely absent in drones (Fig. 6B). It should be noted that at many of the CpGs that show evidence of methylation the overall level is below 100%, indicating that the residue might not be uniformly methylated in all cells in a particular sample. In future studies, the functional consequences of this potential variability in methylation and the implications for the inheritability of this epigenetic mark should be investigated.
Fig. 4.
Annotation of the CpG methylation patterns in the top five DMGs in eggs compared with sperm. Comparison of egg, sperm and drone methylation levels (blue, green and red, respectively) with those found in queen and worker brains (purple and orange, respectively) (Lyko et al., 2010). Exons are indicated in grey.
Fig. 5.
Annotation of the CpG methylation patterns in the top five DMGs in sperm compared with eggs. Comparison of egg, sperm and drone methylation levels (blue, green and red, respectively) with those found in queen and worker brains (purple and orange, respectively) (Lyko et al., 2010). Exons are indicated in grey.
Fig. 6.
Methylation levels at individual CpGs. (A) Methylation levels at individual CpGs of the highest-ranked DMG (GB17165 Stoned B; Group11: 1008681-1013269) in eggs compared with sperm. (B) Methylation levels at individual CpGs of the highest-ranked DMG (GB14467 Plod; Group8: 6482957-6491670) in sperm compared with eggs. The frequency of methylated CpGs at each site in eggs, sperm and drones (blue, green and red, respectively) is shown.
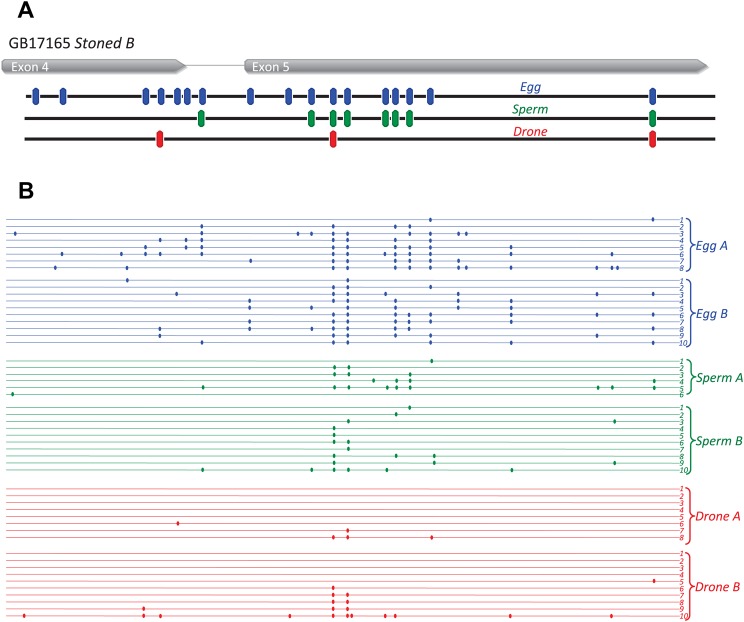
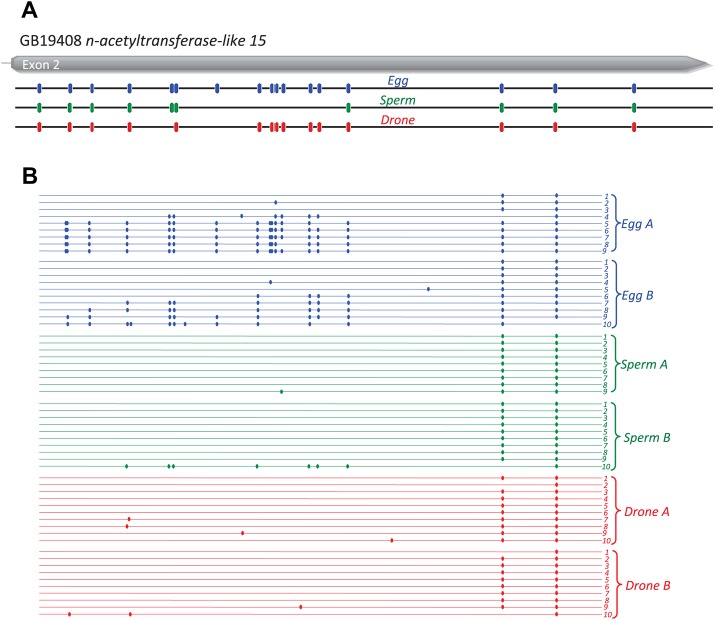
Bisulfite sequencing validation of two of the top five egg DMGs (Stoned B and GB19408 Nac15) was conducted on two replicates of independently collected samples of eggs, drones and sperm. The frequency of methylation in Stoned B (Fig. 7; supplementary material Fig. S4) and Nac15 (Fig. 8; supplementary material Fig. S5) showed similar patterns to the whole genome analysis, with eggs showing extensive methylation relative to sperm and adult drones at a number of CpGs. Curiously, methylation at specific CpGs in Nac15 appeared to be more restricted in drones when compared with the whole genome analysis, suggesting inter-individual variation at certain sites (Fig. 8; supplementary material Fig. S5). Although we may expect small scale variation at the individual gene level between biological replicates, as shown by bisulfite PCR validation of these two DMGs, the overall degree of similarity between these independent replicates and the whole genome analysis suggests that the genome-level patterns are valid and that our overall conclusions about germ-line methylation are consistent.
Fig. 7.
Bisulfite sequencing of the CpG methylation profile of the top DMG (GB17185 Stoned B) in eggs compared with sperm. Comparison of the egg, sperm and drone methylation sites (blue, green and red, respectively) obtained from (A) whole genome bisulfite sequencing with (B) the methylation detected in bisulfite PCR, from two independently collected egg, drone and sperm samples. Methylated CpG residues are indicated by filled circles. Exons are indicated in grey.
Fig. 8.
Bisulfite sequencing of the CpG methylation profile of the top DMG (GB19408 n-acetyltransferase 15-like) in eggs and drones compared with sperm. Comparison of the egg, sperm and drone methylation sites (blue, green and red, respectively) obtained from (A) whole genome bisulfite sequencing with (B) the methylation detected in bisulfite PCR, from two independently collected egg, drone and sperm samples. Methylated CpG residues are indicated by filled circles. Exons are indicated in grey.
CpG bias and DNA methylation
Calculation of the observed/expected ratio of CpG sites (CpGO/E) in methylated genes in our egg, drone and sperm samples shows a strong skew towards low CpG frequency (Fig. 9). The CpGO/E frequencies in the overmethylated DMGs (see Fig. 2B) are consistently below 1.0 (egg  =0.55±0.16 s.d.; drone
  =0.63±0.15; sperm
  =0.58±0.16; Fig. 9A). If we consider the top 100 ranked genes by proportion of methylated sites in each of the three samples, a similar depletion of CpGs is found (egg
  =0.57±0.16; drone
  =0.52±0.15; sperm
  =0.57±0.15; Fig. 9B). Our results support the previous observation that hypermethylated genes in the honey bee experience CpG depletion over evolutionary time (Elango et al., 2009; Lyko et al., 2010). In the case of the egg and sperm DMGs, this result is particularly interesting, as these genes experience alternative methylated epigenetic states as they pass through the two different germ lines.
Fig. 9.
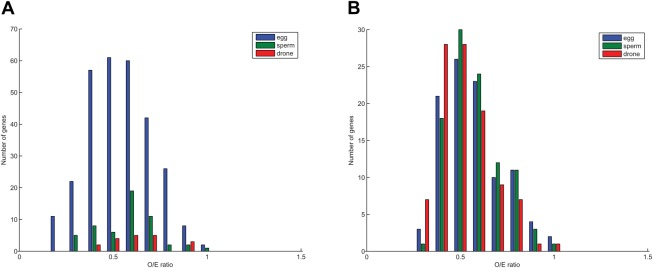
Methylated genes are depleted in CpGs, as measured by CpGO/E ratio. CpGO/E values for (A) overmethylated DMGs and (B) the 100 most methylated DMGs from eggs (blue), sperm (green) and drones (red). In all cases a skewed distribution centred around 0.5-0.6 is observed, indicating a low frequency of CpGs.
DISCUSSION
Distinct methylation profiles from eggs to adult drone thorax to sperm
Our genome-wide DNA methylation data in eggs, drones and sperm indicate a dynamic cycle of methylation through the development of the drone, with a number of methylation marks present in eggs being lost in the adult thoracic tissue, and a subsequent gain in methylation at the same CpG residues during spermatogenesis. Some similarities between eggs and sperm may be due to retention of these marks throughout development from the embryo, in cells destined to become the adult drone germ line and in sperm precursors. However, it should be noted that whereas the adult drones develop from unfertilised eggs, our study did not allow us to track the potentially dynamic changes in the methylome throughout development. It is therefore possible that the methylation pattern in the drone thorax genome is derived entirely independently of the methylation patterns observed in the germ line. The methylation patterns observed in the adult drone thorax are not necessarily representative of total adult drone methylation; however, the inclusion of these data served as a ‘non-germ line’ haploid tissue for the purposes of our comparisons. The 13% of sites methylated in sperm but unmethylated in drones and eggs indicate that a substantial proportion of CpGs are methylated in a paternal-specific manner during spermatogenesis.
As with diploid queen and worker brains (Lyko et al., 2010), the methylomes of haploid eggs, drone thoraxes and sperm show that the majority of DNA methylation occurs at CpG sequences and in the exons of protein-coding genes. Despite these overall similarities, there are genes that show differential patterns of methylation between the three haploid genomes. Specifically, there are 54 genes that appear to gain CpG methylation in sperm relative to the drone thorax and the eggs from which they developed [Fig. 2B and Fig. 3D; supplementary material Table S1 (SpermOver)]. We also found 13 genes for which mature sperm show a significant loss of methylation relative to drone thoraxes and eggs (Fig. 2B). This loss of methylation in sperm suggests that males can either erase or passively lose maternally- or developmentally-derived methylation marks from selected genes. The majority (307/320) of DMGs with higher methylation levels in eggs than in sperm show methylation patterns in drones that are more similar to sperm than to eggs (supplementary material Table S1). This suggests extensive loss of methylation from the egg and during development of the thoracic tissue in the adult drone. Correspondingly, there are 3207 DMGs that are undermethylated in drones relative to eggs and sperm. Only 13 of the 320 DMGs with higher methylation in eggs than in sperm show methylation patterns in drones that are more similar to eggs than to sperm (supplementary material Table S1). For these genes, this profile suggests retention of methylation marks acquired from the unfertilised egg during embryogenesis through to the adult drone thorax and loss during spermatogenesis. Intriguingly, this epigenetic reprogramming pattern is the same as that observed for a number of CpGs at imprinted genes in the paternal germ line of mammals (Ferguson-Smith et al., 2004).
Potential roles of gamete methylation and demethylation in the honey bee
In mammals, DNA methylation facilitates cellular differentiation (Lister et al., 2009), and reprogramming of methylation is thought to underlie embryonic stem cell totipotency (Smallwood and Kelsey, 2012). A functionally dynamic role for methylation in insect embryogenesis is becoming increasingly clear (Zwier et al., 2012). Waves of methylation and demethylation during the early stages of embryogenesis may manifest as detectably higher numbers of individual methylated sites in eggs relative to other tissues. However, gain or loss of methylation in spermatozoa relative to both eggs and adult drones might be preliminary evidence of paternal-specific marking of gametes, potentially explaining strong parent-of-origin effects in inter-subspecies crosses (Oldroyd et al., 2014). Our study provides a candidate set of 61 genes in which there is an increase in methylation in sperm relative to eggs. It would therefore be intriguing to fully investigate the parent-of-origin methylation patterns and the functional role of these genes in future studies.
MATERIALS AND METHODS
DNA sources
Honey bee queens have strict control over whether or not they fertilize their eggs (Ratnieks and Keller, 1998), and thus eggs harvested from the larger cells used for drone rearing are unfertilized haploid eggs that develop as males. We harvested (Evans et al., 2010) 600 eggs 24-36 h old from drone-sized cells from a single honey bee queen in two batches in September 2011. At this age the blastoderm is formed and the germ layers are beginning to form (Nelson, 1915). A cohort of the same eggs were allowed to develop to adulthood, and we harvested a total volume of 40 μl of semen from 40 of these males (approximately 1 μl from each) when they were 20 days old (Harbo, 1986) (Fig. 1). Males were confined to the colony, and other males were prevented from entering by a grid that allowed workers, but not the larger drones, to pass.
Fresh semen was suspended in 10 mM Tris/EDTA buffer containing 6.25 mM proteinase K (Qiagen) for two hours at 56°C with shaking prior to DNA extraction using a DNeasy Blood and Tissue Kit (Qiagen). The final yield was 8.9 μg DNA. Frozen eggs were suspended in 10 mM Tris/EDTA buffer, treated with 2 mg/ml RNase (Qiagen) for 2 min, followed by proteinase K (Qiagen) treatment and extraction as described above. The final yield was 6.3 μg DNA. A subset of three drone thoraxes was used to obtain DNA for the adult drone methylome. Each thorax was lysed in a tissue lyser, suspended in 1 ml of G2 buffer (Qiagen) and treated with RNase (1 mg/ml; Qiagen) for 15 min, followed by incubation with proteinase K (18 mg/ml; Roche) for 6 h, prior to purification with Genomic-tips 20/G (Qiagen). The final yield was 11.9 μg DNA.
Sequencing of bisulfite converted DNA libraries
Library construction, bisulfite conversion and sequencing were performed at the Beijing Genomics Institute, China. DNA was fragmented into 100-300 bp fragments by sonication (S-2; Covaris). The fragmentation parameters were: duty cycle 10%; intensity: 5; cycles/burst: 200; cycles: 16; total fragmentation time: 960 s. Fragmentation was confirmed using a 2100 Bioanalyzer (Agilent). Fragments were end repaired (Illumina) as recommended by the manufacturer. Repaired fragments were ligated with methylated sequencing adaptors using a paired end adaptor oligo kit and oligo mix (Illumina). Ligated fragments were selected by gel electrophoresis and fragments of 360 bp size extracted using a QIAquick gel extraction kit (Qiagen).
Size-selected fragments were bisulfite treated using an EZ-DNA methylation kit (Zymo Research) and enriched using a MethylMiner methylated DNA enrichment kit (Invitrogen). Libraries were amplified using T4 polymerase (Enzymatics) and sequenced on an Illumina HiSeq platform.
Sequence analysis and mapping of DNA methylation
Data were filtered to remove adaptor sequences, duplicate sequences, contamination and low quality reads using BGI software. For methylation analysis we followed Lyko et al. (2010). Briefly, we mapped our reads onto the A. mellifera genome assembly 2.0 using BSMAP version 2.4 with seed size 12 and a maximum of five allowed mismatches (Weinstock et al., 2006; Xi and Li, 2009). We considered only those reads that mapped uniquely, bases within reads that had a quality score of 20 or more and that were next to three matches with quality scores of at least 15 (Altshuler et al., 2000). From these data we determined the number of converted and unconverted reads at each C position in the honey bee assembly, accounting for the fact that each read comes from a bisulfite reaction on one or the other strand. To estimate the rate of bisulfite conversion in non-methylated bases in our experiments, we examined the rate of C-to-T conversion at cytosines that were not in a CpG context. Virtually all of these cytosine residues are unmethylated in honey bees (Lyko et al., 2010). In our egg data, 99.66% of these residues were converted to T, 99.56% in our sperm data and 99.50% in drones.
To identify individual cytosines that were methylated, we compared the number of converted and non-converted reads at each CpG site. We asked how likely these counts were under a binomial distribution, in which the probability of success is one minus the conversion rate, as calculated above for non-CpG sites. We then corrected this probability value for multiple testing, using the method of Benjamini and Hochberg, with a false discovery rate (FDR) threshold of 5% (Benjamini and Hochberg, 1995).
We also sought to identify genes with changed methylation levels between the three groups. Genes were identified from annotations in the A. mellifera official gene set, pre-release 2. We next performed pairwise comparisons between each pair of samples (e.g. eggs versus drones), using logistic regression with methylation as the dependent variable taking on one of two values: methylated or not-methylated. Two categorical variables were used as predictors: sample type and position in the gene. The position variable had a category for every nucleotide position in the gene with read information. After correcting for multiple testing, this allowed us to identify genes with significantly more methylation in one sample than in another. In cases of complete or quasi-complete separation, we used Firth logistic regression, as implemented in the logistf package in R (Heinze and Ploner, 2004). After performing such an analysis for all three pairs of sample types, we identified cases in which a gene was significantly more (or less) methylated in one sample than in the other two. In all cases the significance threshold was an FDR of 5%.
Bisulfite PCR validation
Bisulfite PCR was conducted on two independent samples of haploid eggs, drone thoraxes and semen collected from two genetically distinct colonies. A drone comb was placed into a hive, removed after 24 h and placed in an incubator for 24 h. Between 120 and 150 eggs were sampled, along with six to ten drones and their semen. DNA was extracted from eggs, drone thoraxes and sperm (Qiagen DNeasy Blood and tissue kit) and a bisulfite conversion was conducted (Zymo EZ DNA Methylation-Direct kit) according to the manufacturers’ instructions. Nested primers were designed based on bisulfite-converted DNA sequences and PCR products were amplified in a two-step process (see Table 4 for details). Products were TOPO cloned (Invitrogen), and ten individual amplicons were sequenced (Macrogen) to determine the methylation frequency in each sample.
Table 4.
Bisulfite PCR validation details*

CpG sequence bias analysis
The CpG observed/expected (CpGO/E) ratio for each gene was calculated as described by Elango et al. (2009).
Supplementary Material
Acknowledgements
We thank Rob Good for assistance with the protein sequence analysis, and Lelania Bourgeois and Tom Rinderer for their valiant but unsuccessful attempt to obtain samples out of season. We are grateful to Rizvan Mamet and Jacqueline Dresch for their advice on the statistical analysis. We thank Frances Goudie for help with methylation analysis and Lily Li for help with the GO analysis.
Footnotes
Competing interests
The authors declare no competing financial interests.
Author contributions
R.A.D. conceived of the study, participated in its design and coordination, performed experiments and prepared the manuscript. E.C.B. established the genomics pipeline and participated in the design and coordination of the study. E.J.R. performed experiments and data analysis and edited the manuscript prior to submission. G.T.W., S.M.B. and J.L.S. participated in data analysis, the design of the study, sequence analysis and drafted the manuscript. J.L. participated in the coordination of the study. B.P.O. conceived of the study, participated in its design and coordination, performed experiments and prepared the manuscript. All authors read and approved the final manuscript.
Funding
This work was funded by an Australian Research Council Discovery grant [DP120101915 to B.P.O.], the National Institutes of Health [GM090167 to R.A.D.], the National Science Foundation [IOS-0845103 to R.A.D.; MCB-0918335 to E.B.] and Howard Hughes Medical Institute Undergraduate Science Education Program grants [52006301 and 52007544 to the Biology department at Harvey Mudd College]. The funders had no role in study design, data collection and analysis, decision to publish or preparation of the manuscript. Deposited in PMC for release after 12 months.
Supplementary material
Supplementary material available online at http://dev.biologists.org/lookup/suppl/doi:10.1242/dev.110163/-/DC1
References
- Altshuler D., Pollara V. J., Cowles C. R., van Etten W. J., Baldwin J., Linton L., Lander E. S. (2000). An SNP map of the human genome generated by reduced representation shotgun sequencing. Nature 407, 513-516 10.1038/35035083 [DOI] [PubMed] [Google Scholar]
- Benjamini Y., Hochberg Y. (1995). Controlling the false discovery rate: a practical and powerful approach to multiple testing. J. R. Stat. Soc. B 57, 289-300 [Google Scholar]
- Bird A. P. (1980). DNA methylation and the frequency of CpG in animal DNA. Nucleic Acids Res. 8, 1499-1504 10.1093/nar/8.7.1499 [DOI] [PMC free article] [PubMed] [Google Scholar]
- Bird A. P., Wolffe A. P. (1999). Methylation-induced repression—belts, braces and chromatin. Cell 99, 451-454 10.1016/S0092-8674(00)81532-9 [DOI] [PubMed] [Google Scholar]
- Bock C., Lengauer T. (2008). Computational epigenetics. Bioinformatics 24, 1-10 10.1093/bioinformatics/btm546 [DOI] [PubMed] [Google Scholar]
- Bonasio R., Tu S., Reinberg D. (2010a). Molecular signals of epigenetic states. Science 330, 612-616 10.1126/science.1191078 [DOI] [PMC free article] [PubMed] [Google Scholar]
- Bonasio R., Zhang G., Ye C., Mutti N. S., Fang X., Qin N., Donahue G., Yang P., Li Q., Li C., et al. (2010b). Genomic comparison of the ants Camponotus floridanus and Harpegnathos saltator. Science 329, 1068-1071 10.1126/science.1192428 [DOI] [PMC free article] [PubMed] [Google Scholar]
- Bonasio R., Li Q., Lian J., Mutti N. S., Jin L., Zhao H., Zhang P., Wen P., Xiang H., Ding Y., et al. (2012). Genome-wide and caste-specific DNA methylomes of the ants Campanotus floridanus and Harpengnathus salator. Curr. Biol. 22, 1755-1764 10.1016/j.cub.2012.07.042 [DOI] [PMC free article] [PubMed] [Google Scholar]
- Brandvain Y., Van Cleve J., Úbeda F., Wilkins J. F. (2011). Demography, kinship, and the evolving theory of genomic imprinting. Trends Genet. 27, 251-257 10.1016/j.tig.2011.04.005 [DOI] [PubMed] [Google Scholar]
- Dobata S., Tsuji K. (2012). Intragenomic conflict over queen determination favours genomic imprinting is eusocial Hymenoptera. Proc. R. Soc. Lond. B 279, 2553-2560 10.1098/rspb.2011.2673 [DOI] [PMC free article] [PubMed] [Google Scholar]
- de Wilde J., Beetsma J. (1982). The physiology of caste development in social insects. Adv. Insect Physiol. 16, 167-246 10.1016/S0065-2806(08)60154-X [DOI] [Google Scholar]
- Drewell R. A., Lo N., Oxley P. R., Oldroyd B. P. (2012). Kin conflict in insect societies: a new epigenetic perspective. Trends in Ecol. Evol. 27, 367-373 10.1016/j.tree.2012.02.005 [DOI] [PubMed] [Google Scholar]
- Duncan B. K., Miller J. H. (1980). Mutagenic deamination of cytosine residues in DNA. Nature 287, 560-561 10.1038/287560a0 [DOI] [PubMed] [Google Scholar]
- Elango N., Hunt B. G., Goodisman M. A. D., Yi S. V. (2009). DNA methylation is widespread and associated with differential gene expression in castes of the honeybee, Apis mellifera. Proc. Natl. Acad. Sci. U.S.A. 106, 11206-11211 10.1073/pnas.0900301106 [DOI] [PMC free article] [PubMed] [Google Scholar]
- Evans J. D., Boncristiani H., Jr, Chen Y. (2010). Scientific note on mass collection and hatching of honey bee embryos. Apidologie 41, 654-656 10.1051/apido/2010009 [DOI] [Google Scholar]
- Ferguson-Smith A. C. (2011). Genomic imprinting: the emergence of an epigenetic paradigm. Nat. Rev. Genet. 12, 565-575 10.1038/nrg3032 [DOI] [PubMed] [Google Scholar]
- Ferguson-Smith A. C., Lin S.-P., Youngston N. (2004). Regulation of gene activity and repression: a consideration of unifying themes. Curr. Top. Dev. Biol. 60, 197-213 10.1016/S0070-2153(04)60006-8 [DOI] [PubMed] [Google Scholar]
- Foret S., Kucharski R., Pittelkow Y., Lockett G. A., Maleszka R. (2009). Epigenetic regulation of the honey bee transcriptome: unravelling the nature of methylated genes. BMC Genomics 10, 472 10.1186/1471-2164-10-472 [DOI] [PMC free article] [PubMed] [Google Scholar]
- Foret S., Kucharski R., Pellegrini M., Feng S., Jacobsen S. E., Robinson G. E., Maleszka R. (2012). DNA methylation dynamics, metabolic fluxes, gene splicing, and alternative phenotypes in honey bees. Proc. Natl. Acad. Sci. U.S.A. 109, 4968-4973 10.1073/pnas.1202392109 [DOI] [PMC free article] [PubMed] [Google Scholar]
- Glastad K. M., Hunt B. G., Yi S. V., Goodisman M. A. D. (2011). DNA methylation in insects: on the brink of the epigenomic era. Insect Mol. Biol. 20, 553-565 10.1111/j.1365-2583.2011.01092.x [DOI] [PubMed] [Google Scholar]
- Gonzalgo M. L., Jones P. A. (1997). Mutagenic and epigenetic effects of DNA methylation. Mutat. Res. 386, 107-118 10.1016/S1383-5742(96)00047-6 [DOI] [PubMed] [Google Scholar]
- Götz S., García-Gómez J. M., Terol J., Williams T. D., Nagaraj S. H., Nueda M. J., Robles M., Talón M., Dapazo J., Conesa A. (2008). High-throughput functional annotation and data mining with the Blast2Go suite. Nucleic Acids Res. 36, 3420-3435 10.1093/nar/gkn176 [DOI] [PMC free article] [PubMed] [Google Scholar]
- Guzmán-Novoa E., Hunt G. J., Page R. E., Jr, Uribe-Rubio J. L., Prieto-Merlos D., Becerra-Guzman F. (2005). Paternal effects on the defensive behavior of honeybees. J. Hered. 96, 376-380 10.1093/jhered/esi038 [DOI] [PubMed] [Google Scholar]
- Haig D. (1992). Intragenomic conflict and the evolution of eusociality. J. Theor. Biol. 156, 401-403 10.1016/S0022-5193(05)80683-6 [DOI] [PubMed] [Google Scholar]
- Hajkova P., Erhardt S., Lane N., Haaf T., El-Maarri O., Reik W., Walter J., Surani M. A. (2001). Epigenetic reprogramming in mouse primordial germ cells. Mech. Dev. 17, 15-23 [DOI] [PubMed] [Google Scholar]
- Harbo J. R. (1986). Propagation and instrumental insemination. In Bee Genetics and Breeding (ed Rinderer T. E.), pp. 361-389 Orlando: Academic Press [Google Scholar]
- Heinze G., Ploner M. (2004). A SAS macro, S-PLUS library and R package to perform logistic regression without convergence problems. Technical Report 2/2004, Section for Clinical Biometrics, CEMSIS Vienna: Medical University of Vienna [Google Scholar]
- Herb B. R., Wolschin F., Hansen K. D., Aryee M. J., Langmead B., Irizarry R., Amdam G. V., Feinberg A. P. (2012). Reversible switching between epigenetic states in honeybee behavioral subcastes. Nat. Neurosci. 15, 1371-1373 10.1038/nn.3218 [DOI] [PMC free article] [PubMed] [Google Scholar]
- Holman L., Kokko H. (2014). The evolution of genomic imprinting: costs, benefits and long term consequences. Biol. Rev. (in press). 10.1111/brv.12069 [DOI] [PubMed] [Google Scholar]
- Kucharski R., Maleszka J., Foret S., Maleszka R. (2008). Nutritional control of reproductive status in honeybees via DNA methylation. Science 319, 1827-1830 10.1126/science.1153069 [DOI] [PubMed] [Google Scholar]
- Law J. A., Jacobsen S. E. (2010). Establishing, maintaining and modifying DNA methylation patterns in plants and animals. Nat. Rev. Genet. 11, 204-220 10.1038/nrg2719 [DOI] [PMC free article] [PubMed] [Google Scholar]
- Li C. C. Y., Maloney C. A., Cropley J. E., Suter C. M. (2010). Epigenetic reprograming by maternal nutrition: shaping future generations. Epigenomics 4, 539-549 10.2217/epi.10.33 [DOI] [PubMed] [Google Scholar]
- Lister R., Pelizzola M., Dowen R. H., Hawkins R. D., Hon G., Tonti-Filippini J., Nery J. R., Lee L., Ye Z., Ngo Q.-M., et al. (2009). Human DNA methylomes at base resolution show widespread epigenomic differences. Nature 462, 315-322 10.1038/nature08514 [DOI] [PMC free article] [PubMed] [Google Scholar]
- Lyko F., Foret S., Kucharski R., Wolf S., Falckenhayn C., Maleszka R. (2010). The honey bee epigegenomes: differential methylation of brain DNA in queens and workers. PLoS Biol. 8, e1000506 10.1371/journal.pbio.1000506 [DOI] [PMC free article] [PubMed] [Google Scholar]
- Nanty L., Carbajosa G., Heap G. A., Ratnieks F. L. W., van Heel D. A., Down T. A., Rakyan V. K. (2011). Comparative methylomics reveals gene-body H3K36me3 in Drosophila predicts DNA methylation and CpG landscapes in other invertebrates. Genome Res. 21, 1841-1850 10.1101/gr.121640.111 [DOI] [PMC free article] [PubMed] [Google Scholar]
- Nelson J. N. (1915). The Embryology of the Honey Bee. Princeton: Princeton University Press [Google Scholar]
- Nielsen D. I., Ebert P. R., Hunt G. J., Guzman-Novoa E., Kinnee S. A., Page R. E. (1999). Identification of Africanized honey bees (Hymenoptera: Apidae) incorporating morphometrics and an improved polymerase chain reaction mitotyping procedure. Ann. Entomol. Soc. Am. 92, 167-174 [Google Scholar]
- Oldroyd B. P., Allsopp M. H., Roth K. M., Remnant E. J., Drewell R. A., Beekman M. (2014). A parent-of-origin effect on honeybee worker ovary size. Proc. R. Soc. B (in press). 10.1098/rspb.2013.2388 [DOI] [PMC free article] [PubMed] [Google Scholar]
- Park J., Peng Z., Zeng J., Elango N., Park T., Wheeler D., Werren J. H., Yi S. V. (2011). Comparative analysis of DNA methylation and sequence evolution using Nasonia genomes. Mol. Biol. Evol. 28, 3345-3354 10.1093/molbev/msr168 [DOI] [PMC free article] [PubMed] [Google Scholar]
- Paulsen M., Ferguson-Smith A. C. (2001). DNA methylation in genomic imprinting, development, and disease. J. Pathol. 195, 97-110 10.1002/path.890 [DOI] [PubMed] [Google Scholar]
- Queller D. C. (2003). Theory of genomic imprinting conflict in social insects. BMC Evol. Biol. 3, 15 10.1186/1471-2148-3-15 [DOI] [PMC free article] [PubMed] [Google Scholar]
- Ratnieks F. L. W., Keller L. (1998). Queen control of egg fertilization in the honey bee. Behav. Ecol. Sociobiol. 44, 57-61 10.1007/s002650050514 [DOI] [Google Scholar]
- Reik W., Walter J. (2001). Genomic imprinting: parental influence on the genome. Nat. Rev. Genet. 2, 21-32 10.1038/35047554 [DOI] [PubMed] [Google Scholar]
- Richards E. J. (2006). Inherited epigenetic variation - revisiting soft inheritance. Nat. Rev. Genet. 7, 395-401 10.1038/nrg1834 [DOI] [PubMed] [Google Scholar]
- Sasaki K., Obaru Y. (2002). Egg activation and timing of sperm acceptance by an egg in honeybees (Apis mellifera L.). Insectes Sociaux 49, 234-240 10.1007/s00040-002-8307-x [DOI] [Google Scholar]
- Shi Y. Y., Huang Z. Y., Zeng Z. J., Wang Z. L., Wu X. B., Yan W. Y. (2011). Diet and cell size both affect queen-worker differentiation through DNA methylation in honey bees (Apis mellifera, Apidae). PLoS ONE 6, e18808 10.1371/journal.pone.0018808 [DOI] [PMC free article] [PubMed] [Google Scholar]
- Smallwood S. A., Kelsey G. (2012). De novo DNA methylation: a germ cell perspective. Trends Genet. 28, 33-42 10.1016/j.tig.2011.09.004 [DOI] [PubMed] [Google Scholar]
- Snodgrass R. E. (1956). The Anatomy of the Honey Bee. Ithaca: Comstock [Google Scholar]
- Wang Y., Jorda M., Jones P. L., Maleszka R., Ling X., Robertson H. M., Mizzen C. A., Peinado M. A., Robinson G. E. (2006). Functional CpG methylation system in a social insect. Science 314, 645-647 10.1126/science.1135213 [DOI] [PubMed] [Google Scholar]
- Weinstock G. M., Robinson G. E., Gibbs R. A., Worley K. C., Evans J. D., Maleszka R., Robertson H. M., Weaver D. B., Beye , M., Bork P., et al. (2006). Insights into social insects from the genome of the honeybee Apis mellifera. Nature 443, 931-949 10.1038/nature05260 [DOI] [PMC free article] [PubMed] [Google Scholar]
- Xi Y., Li W. (2009). BSMAP: whole genome bisulfite sequence MAPping program. BMC Bioinformatics 10, 232 10.1186/1471-2105-10-232 [DOI] [PMC free article] [PubMed] [Google Scholar]
- Yi S. V., Goodisman M. A. D. (2009). Computational approaches for understanding the evolution of DNA methylation in animals. Epigenetics 4, 551-556 10.4161/epi.4.8.10345 [DOI] [PubMed] [Google Scholar]
- Zwier M. V., Verhulst E. C., Zwahlen R. D., Beukeboom L. W., van de Zande L. (2012). DNA methylation plays a crucial role during early Nasonia development. Insect Mol. Biol. 21, 129-138 10.1111/j.1365-2583.2011.01121.x [DOI] [PubMed] [Google Scholar]
Associated Data
This section collects any data citations, data availability statements, or supplementary materials included in this article.


