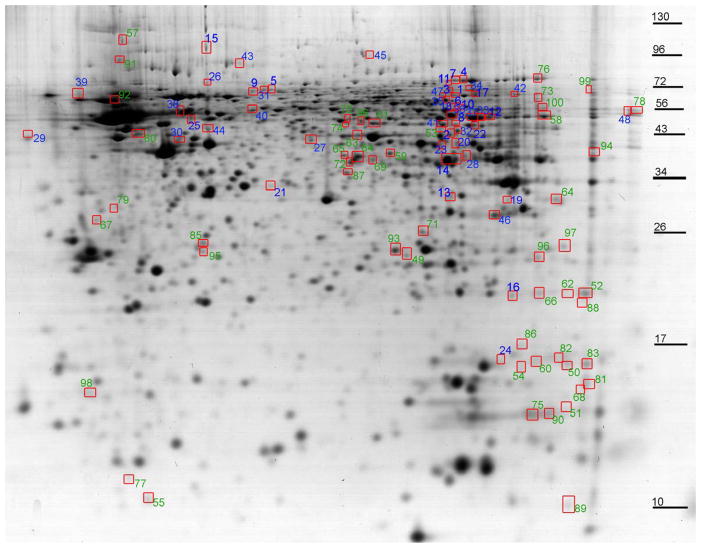
Figure 3. At PD21, the urea soluble hippocampus proteome profiles are altered by developmental CSE.
The protein spots with altered abundance following developmental CSE are circled and numbered. Numbers in blue represent decreased abundance proteins and the numbers in green represent increased abundance proteins. These protein spots were ranked according to the Variable Import in Projection score (VIP ≥1.7) based on the PLS-DA model and contributed to the separation of the proteome profiles of the SHAM and CSE groups. Protein spots that were identified are listed in Tables 1–3.

