

Abstract
Motivation: Systems approaches to studying phenotypic relationships among diseases are emerging as an active area of research for both novel disease gene discovery and drug repurposing. Currently, systematic study of disease phenotypic relationships on a phenome-wide scale is limited because large-scale machine-understandable disease–phenotype relationship knowledge bases are often unavailable. Here, we present an automatic approach to extract disease–manifestation (D-M) pairs (one specific type of disease–phenotype relationship) from the wide body of published biomedical literature.
Data and Methods: Our method leverages external knowledge and limits the amount of human effort required. For the text corpus, we used 119 085 682 MEDLINE sentences (21 354 075 citations). First, we used D-M pairs from existing biomedical ontologies as prior knowledge to automatically discover D-M–specific syntactic patterns. We then extracted additional pairs from MEDLINE using the learned patterns. Finally, we analysed correlations between disease manifestations and disease-associated genes and drugs to demonstrate the potential of this newly created knowledge base in disease gene discovery and drug repurposing.
Results: In total, we extracted 121 359 unique D-M pairs with a high precision of 0.924. Among the extracted pairs, 120 419 (99.2%) have not been captured in existing structured knowledge sources. We have shown that disease manifestations correlate positively with both disease-associated genes and drug treatments.
Conclusions: The main contribution of our study is the creation of a large-scale and accurate D-M phenotype relationship knowledge base. This unique knowledge base, when combined with existing phenotypic, genetic and proteomic datasets, can have profound implications in our deeper understanding of disease etiology and in rapid drug repurposing.
Availability: http://nlp.case.edu/public/data/DMPatternUMLS/
Contact: rxx@case.edu
1 INTRODUCTION
Discerning the genetic contributions to complex human diseases is challenging, demands new types of data and calls for new avenues for advancing the state-of-the-art in systems approaches to uncovering disease etiology. One recognized limitation of current computational candidate disease gene prediction (Barabsi et al., 2011; Baudot et al., 2009; Doncheva et al., 2012; Kann, 2010; Piro and Di Cunto, 2012; Tiffin et al., 2009; Tranchevent et al., 2011; Vidal et al., 2011; Wang et al., 2011) and drug repurposing (Chen et al., 2009; Hu and Agarwal, 2009; Keiser et al., 2009; Kinnings et al., 2009; Lamb et al., 2006; Noeske et al., 2006; Sirota et al., 2011) approaches is that the selection of gene or drug candidates is based on known molecular basis of diseases, genes or drugs, and is therefore limited in the capacity of identifying novel disease genes or new drug targets. It has been increasingly recognized that phenotypically related diseases often reflect overlapping molecular causations (Lee et al., 2008; Oti et al., 2008; Park et al., 2009; Roque et al., 2011; Rzhetsky et al., 2007). Therefore, the systematic study of phenotypic relationships among human diseases and integration of disease phenotypic data with existing genetic and ‘omics’ data will allow for the elucidation of disease genetic mechanisms and the development of effective drug therapies without requiring detailed knowledge of the exact relationships among genes, which often are not clearly understood. However, current systematic study of disease phenotypic relationships on both phenome- and genome-wide scale is limited owing to the fact that large-scale machine-understandable disease phenotype knowledge bases are often not available. The lack of disease phenotype data to complement genetic and proteomic datasets has limited scientific progress towards elucidating the origins of human disease for better disease prevention and treatment. Our ultimate research goal is to build a large-scale and accurate disease–phenotype relationship knowledge base from published literature, patient electronic health records (EHRs), biomedical ontologies and other knowledge sources. This disease–phenotype knowledge base will include relationships such as disease–risk (environmental risk factors and predisposing diseases), disease–disease co-morbidity, disease–organ, disease–manifestation (D-M) (symptom), among others. In this study, we focus on automatically extracting D-M pairs from the large amount of published biomedical literature (22 million citations in MEDLINE so far). As far as we know, this is the first large-scale effort focusing on automatically extracting disease–phenotype relationship knowledge from published biomedical literature. The unique disease–phenotype knowledge base we create can have profound implications in our deeper understanding of disease etiology and in rapid drug repurposing.
2 BACKGROUND
Recently, disease phenotypic similarity has become another major data source exploited by computational methods for prioritization of candidate disease genes (Chen et al., 2011; Guo et al., 2011; Hoehndorf et al., 2011; Hwang et al., 2011; Lage et al., 2007; Li and Patra, 2010; Vanunu et al., 2010; Wu et al., 2008; Yang et al., 2011; Yao et al., 2011). The advantage of this phenotype-driven approach over traditional computational gene candidate selection approaches is that we can hypothesize (not making any limiting assumptions about underlying disease and gene mechanisms) that the similar phenotypes in two diseases may result from genes/pathways that are involved in the same biological process, until proved otherwise. For phenotype-driven candidate gene selection, a two-layered heterogeneous data network is often constructed where the phenotypic network layer consists of connections between similar diseases, while the genetic network layer contains molecular data such as protein–protein interaction, pathways, gene co-expression or shared protein domain. These two network layers are linked through known disease–gene associations. For example, Li et al. demonstrated the importance of the additional phenotype network layer in identifying novel disease–gene associations by extending a random-walk algorithm to this heterogeneous network where both the candidate genes and the disease phenotypes are prioritized simultaneously (Li and Patra, 2010). Currently, the disease phenotype networks are mainly constructed based on disease co-morbidity (Lage et al., 2007) or text mining of the Online Mendelian Inheritance in Man (OMIM) database (Chen et al., 2011; Guo et al., 2011; Hoehndorf et al., 2011; Hwang et al., 2011; Lage et al., 2007; Li and Patra, 2010; Van Driel et al., 2006; Vanunu et al., 2010; Wu et al., 2008; Yao et al., 2011; Yang et al., 2011). To significantly enrich the currently available disease phenotype datasets, we are developing natural language processing and data mining techniques to extract broad types of disease–phenotype relationships, including D-M, disease–risk factor, disease–organ, disease–co-comorbidity and others, from published literature, patient EHRs, biomedical ontologies and large observational health datasets. Our goal is to augment current computational candidate disease gene selection and drug repurposing approaches by increasing both the amount and overall quality of available disease phenotype information. For this study, we focus on automatically extracting D-M relationships from biomedical literature.
Diseases with similar clinical manifestations may share common genetic mechanisms. For example, Stickler Syndrome is characterized by myopia, retinal detachment, hearing loss, cleft palate and arthropathy. Based on manifestation similarity, both Marshall syndrome and Oto-Spondylo-Megaepiphyseal Dysplasia (OSMED) syndrome have similar facial and skeletal features as Stickler syndrome. Mutations in COL2A1, COL11A2 and COL11A1 are responsible for the Stickler, OSMED and Marshall syndromes, respectively (Brunner and van Driel, 2004). The proteins encoded by these genes form a single trimeric collagen-11 protein molecule whose malfunctions are responsible for these three syndromes. A large amount of D-M semantic relationships has been captured in existing medical ontologies. For example, 50 551 D-M pairs are included in Unified Medical Language System (UMLS) (2011 version) file MRREL.RRF. However, most of the D-M pairs in UMLS are for rare syndromes such as Marfan syndrome, Williams syndrome and Mccune-Albright syndrome. On the other hand, many D-M associations are reported in biomedical literature, but not captured in exiting medical ontologies. For example, 166 clinical manifestations have been reported to be associated with Marfan syndrome in MEDLINE. Among them, 152 manifestations (91.5%) are not captured in UMLS. Among them, spontaneous pneumothorax, annuloaortic ectasia, migraine, epilepsy and sleep-disordered breathing are reported multiple times in biomedical literature, but not included in UMLS for Marfan syndrome. This demonstrates that these two knowledge sources (literature versus ontologies) largely complement each other. In addition, while D-M pairs in UMLS are mainly for rare syndromes, the pairs extracted from biomedical literature also include common complex diseases such as systemic lupus erythematosus, rheumatoid arthritis and diabetes mellitus. Hence, D-M pairs extracted from literature, in combination with pairs from existing medical ontologies, will serve as an important source of disease phenotype information.
3 APPROACH
The large body of published biomedical literature (more than 22 million citations on MEDLINE) is among the richest data sources for systematically identifying D-M and other disease phenotype relationships. While many biomedical relationship extraction tasks have focused on extracting specific types of relationships between drugs, proteins, diseases or genes (Ananiadou et al., 2010; Blaschke et al., 1999; Craven et al., 1999; Friedman et al., 2001; Rindflesch et al., 2000; Rosario and Hearst, 2004; Xu and Wang, 2013), less research has focused on extracting disease–phenotype relationships. Recently, we have developed semi-supervised pattern learning approaches for named entity recognition (Xu et al., 2008, 2009a), relationship extraction (Xu et al., 2009b) and medical image retrieval from the web (Chen et al., 2012). Semi-supervised pattern learning approaches have the advantages of requiring minimal human intervention and no external domain knowledge. We have also developed a knowledge-driven ranking approach to extract drug–gene relationships from MEDLINE by leveraging on existing biomedical knowledge (Xu and Wang, 2012). Like semi-supervised iterative learning approaches, the knowledge-driven approach requires minimal human annotation, while at the same time, leveraging prior knowledge to prevent the semantic drifting problem inherent in many semi-supervised iterative learning systems. Because our ultimate goal is to develop systems approaches in exploiting disease–phenotype relationships for network-based candidate gene prediction and drug repurposing, accuracy and scalability of the relationship extraction algorithms are critical. In this study, we develop a knowledge-driven pattern learning relationship extraction approach (a hybrid of above semi-supervised pattern learning approach and knowledge-driven ranking approach) to accurately extract D-M pairs from MEDLINE by leveraging on prior knowledge from biomedical ontologies. Our approach is highly accurate, efficient and requires minimal manual curation effort.
4 METHODS
The entire experimental process consists of the following steps (Fig. 1): (i) Obtain and parse MEDLINE corpus; (ii) Extract existing D-M pairs from UMLS (prior knowledge); (iii) Extract D-M pairs from MEDLINE in following steps: pattern ranking and selection, pair extraction and pair ranking; and (iv) Analyse the correlation between extracted D-M pairs and disease-associated genes and drugs (integrative correlation analysis).
Fig. 1.
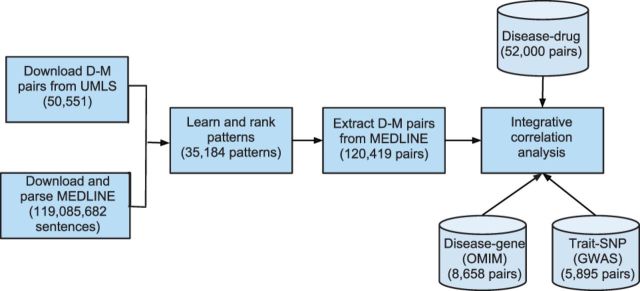
The overall experiment flowchart
4.1 Build a local MEDLINE search engine
We downloaded 21 354 075 MEDLINE citations (119 085 682 sentences) published between 1965 and 2012 from the US National Library of Medicine (http://mbr.nlm.nih.gov/Download/index.shtml). Each sentence was syntactically parsed with Stanford Parser (Klein and Manning, 2003) using the Amazon Cloud computing service (3500 instance-hours with High-CPU Extra Large Instance used). We used the publicly available information retrieval library Lucene (http://lucene.apache.org) to create a local MEDLINE search engine with indices created on both sentences and their corresponding parse trees.
4.2 Extract existing D-M pairs from UMLS as prior knowledge
We extracted 50 551 D-M pairs from the UMLS (2011 version) file MRREL.RRF (Bodenreider, 2004). We then expanded the terms in D-M pairs to include all the synonyms to capture term usage variations in biomedical literature. After expansion, we obtained 3 499 871 D-M pairs, which were used to discover D-M–specific patterns from MEDLINE.
4.3 Extract additional D-M pairs from MEDLINE
4.3.1 Create clean disease lexico
A highly accurate and comprehensive disease lexicon is critical for the task of building a high-quality disease–phenotype relationship knowledge base. We built a clean disease lexicon by combining and manually cleaning all disease terms in UMLS and in Human Disease Ontology (http://bioportal.bioontology.org/ontologies/1009). Incorrectly classified disease terms (e.g. brain, liver, worms), ambiguous terms (e.g. brash, giants, consumption, inversion, blind, cold) and general terms (e.g. disease, syndrome, disorder) were manually removed. The final disease lexicon consisted of 70 247 terms.
The knowledge-driven D-M relationship extraction system is depicted in Figure 2 and consists of the following: (i) Pattern extraction, wherein syntactical patterns associated with known D-M pairs are extracted; (ii) Pattern ranking and selection, wherein patterns are ranked and D-M–specific patterns are selected from top-ranked patterns; (iii) Pair extraction, wherein additional pairs associated with selected patterns are extracted from MEDLINE; and (iv) Pair ranking, wherein extracted D-M pairs are ranked based on the ranking scores of their associated patterns and co-occurrence frequency.
Fig. 2.
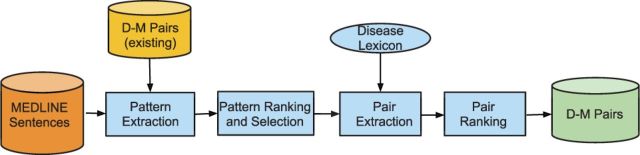
The knowledge-driven D-M relationship extraction approach
4.3.2 Pattern extraction
To find D-M–specific patterns, we used the expanded known D-M pairs as search queries to the local search engine. Sentences and their corresponding parse trees containing any known D-M pairs were retrieved. The patterns ‘NP1 pattern NP2’, where the noun phrase pair NP1–NP2 is a known D-M pair, were extracted from the retrieved parse trees. The pattern is ‘D pattern M’ if disease precedes manifestation or ‘M pattern D’ if the opposite is true. For example, using D-M pair ‘Coffin–Lowry Syndrome–mental retardation’ as search query, we retrieved the sentence ‘Coffin–Lowry Syndrome is characterized by mental retardation, …’ (PMID 17249444). From this sentence, a D-M–specific pattern ‘D is characterized by M’ was discovered. The extra requirement that both D and M must be noun phrases in the extracted patterns is to ensure the high precision of extracted pairs. For example, disease name ‘infection’ instead of ‘reovirus type 3 infection’ is included in our disease lexicon. Without the NP restriction, incorrect (or too general) pair ‘infection-primary biliary cirrhosis’ will be extracted from the sentence ‘Reovirus type 3 infection in patients with primary biliary cirrhosis and primary sclerosing cholangitis’. (PMID 2821105). By requiring that disease terms also have to be NP phrase, no pair will be extracted from this sentence. In this way, high precision is guaranteed because term ‘infection’ by itself is not NP in this particular sentence (it may be NP in other sentences though).
4.3.3 Pattern ranking and selection
Not all patterns associated with known D-M pairs are necessarily specific in describing D-M–specific semantic relationships. To find patterns that are associated with many known D-M pairs (high recall) and are also specific in describing D-M relationships (high precision), we first ranked extracted patterns by the number of their associated known D-M pairs. The ranking scheme ranks patterns highly that are associated with many known pairs. From the top-ranked patterns, we manually selected D-M–specific syntactic patterns. The pattern ranking and manual selection processes ensured the high recall (top ranked) and high precision (manually selected) of selected patterns. After pattern ranking, the manual selection process entailed minimal human time to scan top-ranked patterns (<15 min).
4.3.4 Pair extraction
The selected D-M–specific syntactic patterns were used as search queries to the local MEDLINE search engine. Both sentences and parse trees that contained these patterns were retrieved. We then extracted disease–disease pairs from the returned parse trees using the pattern ‘NP1 pattern NP2’, wherein NP1 and NP2 are both noun phrases and disease terms, and the pattern is one of the selected patterns. For example, using the D-M pair ‘Coffin–Lowry Syndrome–mental retardation’ from UMLS, we found a D-M–specific pattern ‘D is characterized by M’ from the sentence ‘Coffin–Lowry Syndrome is characterized by mental retardation, …’ (PMID 17249444). Then using the pattern ‘is characterized by’ as search query, we retrieved the sentence ‘Sheehan’s syndrome is characterized by hypopituitarism that occurs …’ (PMID 18797595) From this sentence, a new (not included in UMLS) pair ‘Sheehan’s syndrome–hypopituitarism’ was extracted because both Sheehan’s syndrome and hypopituitarism are disease terms in the disease lexicon, noun phrases in this sentences and associated with D-M–specific pattern ‘is characterized by’.
4.3.5 Pair ranking
We ranked extracted D-M pairs based on their associated pattern scores (as determined by the number of their associated known D-M pairs) and co-occurrence frequencies. A reliable D-M pair is one that is associated with reliable patterns many times. The ranking score (RS) of a pair or relationship (R) RS(R) is defined as following:
| (1) |
 is the score of its associated patterns (
 and is defined as the number of known D-M pairs from UMLS that are associated with the pattern.
  is the number of times that the pair is associated with the pattern in the entire MEDLINE corpus.
4.3.6 Evaluation
For precision evaluation, we randomly selected 1000 pairs from extracted D-M pairs. This random selection did not take into account pair frequencies, and therefore all pairs had the equal probability to be selected. We retrieved all associated sentences for each selected pair (along with its associated patterns) using the local search engine. Three annotators with graduate degrees in biomedical domains independently examined whether each pair was correctly extracted from these sentences by our algorithm. Only the pairs agreed upon by all three curators were counted as correct ones. However, the recall evaluation of the extracted pairs was not performed because the space of disease manifestation for a given disease is not known. We cannot use D-M pairs from UMLS (mainly for rare syndromes) as a gold standard to measure the performance of MEDLINE-based D-M relationship extraction tasks because the D-M knowledge represented in these two sources largely complement each other. Note that the recall of the extracted D-M pairs is not the same as the recall of the selected disease-specific patterns, which is high because they were among the top-ranked patterns. Because our ultimate goal is to develop systems approaches in exploiting disease–phenotype relationships for network-based candidate gene prediction and for drug repurposing, the accuracy (high precision) and large size (many unique pairs) of the extracted D-M phenotype knowledge base will be critical. Therefore, we only evaluated the accuracy of the relationship extraction algorithm and calculated how many additional D-M pairs were extracted from MEDLINE compared with those in UMLS. We believe that this important disease–phenotype relationship knowledge base do not need to be complete to be useful in the tasks of candidate disease gene selection and in drug repurposing.
4.4 Analyse the correlation between extracted D-M pairs and disease-associated drugs and genes
4.4.1 Correlation with disease-associated drugs
We extracted 52 000 disease–drug treatment pairs from ClinicalTrials.gov (http://www.clinicaltrials.gov/), a registry of federally and privately supported clinical trials conducted in the United States and around the world (www.clinicaltrials.gov). Because the disease name usage in ClinicalTrials.gov is often different from that found in MEDLINE, we mapped all the names, including disease names and drug names, to UMLS concept unique identifiers (CUIs). After mapping, we obtained 63 356 disease–drug CUI pairs, corresponding to 5080 unique disease CUIs and 2124 distinct drug CUIs. Note that some terms have more than one CUI. We also mapped D-M pairs extracted from MEDLINE to CUI pairs. For disease–disease (CUI–CUI) pairs that share different number of manifestations, we calculated the corresponding average number of shared drug treatments.
4.4.2 Correlation with disease-associated genes
Similar to the correlation analysis above, we analysed shared genetic components underlying disease–disease pairs with overlapping manifestations. We obtained 8658 disease–gene associations from OMIM (data accessed in April 2012) (Hamosh et al., 2005) and 5895 trait–single nucleotide polymorphism (SNP) pairs from National Human Genome Research Institute’s GWAS Catalog database (data accessed in January 2012) (Hindorff et al., 2012). OMIM is a database that catalogues all known diseases, with a genetic component that focuses on the relationship between phenotype and genotype. The GWAS Catalog database is an online database of SNP–trait associations derived from genome-wide association studies. We mapped all disease and gene names to their corresponding UMLS CUIs. After mapping, we obtained 13 405 disease–gene CUI pairs corresponding to 2600 distinct disease CUIs and 5752 distinct gene CUIs from OMIM. We obtained 7597 trait–gene CUI pairs corresponding to 315 distinct diseases/traits CUIs and 3013 distinct gene CUIs from the GWAS Catalog database. For disease–disease (CUI–CUI) pairs that share manifestations at different cut-offs, we calculated the average number of shared genes or SNPs.
5 RESULTS
5.1 Learning D-M–specific patterns
Using the expanded UMLS D-M pairs, we extracted 21 013 patterns in the form of ‘D pattern M’ and 14 171 patterns in the form of ‘M pattern D’ from MEDLINE sentences. Many UMLS D-M pairs did not appear in MEDLINE sentences. Among the 21 013 ‘D pattern M’ patterns, 20 588 (97.9%) are associated with only one UMLS D-M pair. Similarly, among the 14 171 ‘M pattern D’ patterns, 13 715 (96.8%) are associated with only one UMLS D-M pair. We ranked the extracted patterns based on the number of their associated known D-M pairs. The top-10–ranked patterns along with the numbers of associated D-M pairs are listed in Table 1. As shown in the table, among the top-ranked patterns, there do in fact exist many D-M–specific patterns such as ‘M associated with D’, ‘M in patients with D’ and ‘M due to D’.
Table 1.
Top 10 frequent patterns and the numbers of associated known D-M pairs from UMLS
| D pattern M | Pairs | M pattern D | Pairs |
|---|---|---|---|
| D and M | 431 | M in D | 610 |
| D with M | 250 | M and D | 370 |
| D, M | 242 | M, D | 217 |
| D (M) | 99 | M associated with D | 194 |
| D associated with M | 77 | M (D) | 178 |
| D M | 64 | M in patients with D | 146 |
| D or M | 54 | M in a patient with D | 119 |
| D, and M | 54 | M due to D | 111 |
| D-associated M | 48 | M or D | 83 |
| D in M | 41 | M of D | 76 |
Note: D-M–specific patterns are highlighted.
Comparing the top patterns in the form of ‘D pattern M’ to those in the form of ‘M pattern D’, we noticed that D-M associations are often specified using the form ‘M pattern D’, wherein the manifestation appears in front of the disease. Therefore, in our subsequent relationship extraction, we only used patterns in the form of ‘M pattern D’. From the top-10–ranked ‘M pattern D’ patterns, we manually selected six specific patterns, including ‘M in D’, ‘M associated with D’, ‘M in patients with D’, ‘M in a patient with D’, ‘M due to D’ and ‘M of D’. Because the number of pairs associated with each pattern rapidly decreases as the rank increases, we only selected patterns from the top-10–ranked patterns. These manually selected patterns have high recall because they were among the top-ranked patterns. In addition, these patterns have high precision because they are manually picked. These six selected patterns were used to extract additional D-M pairs from MEDLINE.
Pattern-based relationship extraction approaches often have high precisions. However, the recalls depend on the size of the underlying text corpus, pair frequencies in the corpus and the usage of patterns in the text. Because the main goal of our study is to accurately extract many additional D-M pairs from MEDLINE and our goal is not to extract all available D-M pairs, we only selected a few specific patterns with high recalls to guarantee both high precision and relatively high recall. Pairs that are not associated with these patterns will be missed. Pattern-based learning methods in general can find patterns with both high precision and high recall with minimal human effort; however, further improving the recall will require manual examination of many more patterns or non–pattern-based approaches.
5.2 Extract additional D-M pairs from MEDLINE using specific patterns
Using the six selected patterns, we extracted an additional 120 419 distinct D-M pairs from MEDLINE sentences. Among these pairs, 120 419 pairs (99.2%) are not archived in UMLS. While most of the D-M pairs in UMLS are for rare syndromes, the pairs extracted from MEDLINE include both rare syndromes and common complex diseases, such as systemic lupus erythematosus, rheumatoid arthritis and diabetes mellitus. For each of the six selected textual patterns, significantly more pairs than those captured in UMLS were extracted from MEDLINE sentences (Table 2). The extracted D-M pairs proved to be highly accurate (precision of 0.924), based on our manual evaluation of 1000 randomly selected pairs.
Table 2.
D-M pairs extracted from MEDLINE and from UMLS, using the selected six manifestation-specific patterns
| Pattern | Pairs (MEDLINE) | Pairs (UMLS) | Additional pairs (MEDLINE- UMLS) |
|---|---|---|---|
| M in D | 54 355 | 610 | 53 745 |
| M associated with D | 29 563 | 194 | 29 369 |
| M in patients with D | 20 191 | 146 | 20 045 |
| M due to D | 14 771 | 111 | 14 660 |
| M of D | 12 652 | 76 | 12 576 |
| M in a patient with D | 9953 | 119 | 9834 |
| All | 121 356 | 937 | 120 419 |
5.3 D-M pairs positively correlate with disease drug treatments
To show the potential of this disease phenotypic knowledge in drug repurposing, we analysed the correlations between D-M pairs and disease-associated drugs. In addition, we also compared these correlations with those for D-M pairs in the UMLS. A total of 2832 diseases (CUIs) were mapped from the extracted D-M pairs to disease–drug treatment pairs extracted from ClinicalTrials.gov. For diseases that appeared in both datasets, there are 4 008 696 possible disease–disease combinations (order ignored). As shown in Figure 3, the number of shared drugs increases as the number of shared manifestations increases. For example, the average number of shared drugs for all these disease combinations is 0.418. The number increased to 1.067 for disease–disease pairs sharing one or more manifestation and 21.162 for disease–disease pairs with at least 60 overlapping manifestations.
Fig. 3.

The correlation between D-M pairs and disease–drug treatment pairs
To show the comprehensiveness of the pairs extracted from MEDLINE compared with those from UMLS, we compared the correlations with drugs for these two datasets. For the D-M pairs from UMLS, the correlation is much weaker. Only 193 diseases were mapped from UMLS D-M pairs to disease–drug treatment pairs, which is significantly less when compared with the 2832 mapped diseases for D-M pairs extracted from MEDLINE. The number of average shared drugs for all possible 18 528 disease–disease combination pairs for these 193 mapped diseases is 0.457, which is similar to that (0.418) for pairs extracted from MEDLINE. Among the 18 528 disease–disease pairs, 2471 pairs shared at least one manifestation. The average number of shared drugs for these pairs is 0.564, a modest 23.4% increase compared with 0.418 for all pairs, but a significant decrease from the 1.067 for pairs extracted from MEDLINE. Data was not plotted because there are not many disease–disease pairs sharing two or more manifestations for pairs from UMLS; only 80 pairs shared two or more manifestations and 8 pairs shared three or more, which prevented further correlation analysis. In summary, disease–disease pairs with overlapping manifestations tend to share drug treatments. This correlation is much stronger for pairs extracted from MEDLINE than those from UMLS. Even though this positive correlation between D-M and disease–drug treatments is expected, this expected result demonstrates that we can use this dataset in subsequent phenotype-driven drug repurposing. Currently, we are developing systems approaches to analysing this information with the goal of repurposing existing drugs to treat new diseases.
5.4 D-M pairs positively correlate with disease-associated genes
To demonstrate the potential of the extracted phenotypic D-M associations in facilitating our understanding of disease genetic mechanisms, we analysed the correlation between the extracted D-M pairs with disease-associated genes. We used two disease–gene association knowledge sources: disease–gene associations from OMIM (Hamosh et al., 2005) and disease– or trait–SNP associates from the GWAS Catalog (Hindorff et al., 2012). A total of 1191 diseases were mapped from D-M pairs to disease–gene associations from OMIM. The average number of shared genes for all possible 708 645 disease–disease combinations is 0.014. Among the 1191 diseases, 1179 diseases shared at least one manifestation with other diseases. The average number of shared genes for disease–disease pairs sharing one or more manifestations was 0.048, a 242% increase from 0.014 for all disease–disease pairs (Fig. 4). The number of shared genes increased as the number of shared manifestations increased.
Fig. 4.

The correlation between D-M pairs (extracted from MEDLINE and from UMLS) and disease-associated genes from OMIM
We observed similar, but weaker, correlations between pairs from UMLS and disease–gene pairs from OMIM. The average number of shared genes for all possible 253 828 disease–disease combinations among 713 mapped diseases was 0.003. The number increased to 0.011 for disease–disease pairs sharing one or more manifestations and to 0.102 for pairs sharing 10 or more manifestations. Owing to the data limitation, few disease–disease pairs shared more than 10 manifestations. In summary, D-M associations are highly correlated with underlying disease genetic components. D-M pairs extracted from MEDLINE have broader coverage than pairs from UMLS. Systems approaches to studying D-M relationships may offer novel insights into disease genetic mechanisms.
The D-M pairs extracted from MEDLINE also showed strong correlations with trait–SNP associations from GWAS. A total of 183 diseases from extracted pairs were mapped to trait–SNP pairs from GWAS studies. The average number of shared genes for all disease–disease combinations was 0.254. The number modestly increased to 0.315 for pairs sharing one or more manifestations. As the number of shared manifestations increased, the number of shared GWAS genes increased significantly (Fig. 5). However, among D-M pairs from UMLS, only 19 diseases could be mapped to GWAS disease–gene associations because diseases in GWAS are often common complex diseases, while diseases in D-M pairs from UMLS are often rare syndromes. This difference limited our GWAS-based genetic correlation study. This further demonstrates the importance of the D-M knowledge base that we constructed from MEDLINE in our understanding of common complex diseases.
Fig. 5.

The correlation between D-M pairs (extracted from MEDLINE) and disease-associated genes from GWAS
5.5 Examples of disease–disease relationships based on manifestation similarity
We selected four diseases [Marfan syndrome, type 2 diabetes mellitus (T2DM), Parkinson’s disease (PD) and colon cancer] and found all the diseases that shared any manifestations with them based on the D-M pairs extracted from MEDLINE. We then ranked the diseases based on Jaccard similarity coefficient. The Jaccard coefficient measures manifestation similarity between two diseases, and is defined as the size of the intersection divided by the size of the union of two diseases’ manifestations:
| (2) |
Table 3 shows the top 10 most similar diseases for each given disease. As shown in the table, the top-ranked diseases based on manifestation similarity makes biological sense. For example, it is known that Marfan syndrome is a connective tissue disorder and has many manifestations related to cardiovascular systems. The top-ranked diseases for Marfan syndrome are either connective tissue disorder (Ehlers-Danlos syndrome, osteogenesis imperfecta) or related to cardiovascular systems such as infective endocarditis, coronary artery disease, atherosclerosis, hypertension and hypertrophic cardiomyopathy. The top-ranked diseases for T2DM are mainly metabolic syndromes or cardiovascular diseases, which are well known to be genetically related to T2D. The top-ranked diseases for PD are mainly neurological diseases such as schizophrenia and dementia. Diseases that shared most manifestations with colon cancer are also cancers such as breast cancer and ovarian cancer.
Table 3.
Top 10 diseases that share similar manifestation profiles to four given diseases
| Marfan syndrome | T2DM | PD | Colon cancer |
|---|---|---|---|
| Ehlers-Danlos syndrome | Type 1 diabetes | Schizophrenia | Breast cancer |
| Infective endocarditis | Essential hypertension | Multiple sclerosis | Ovarian cancer |
| Takayasu’s arteritis | Chronic kidney disease | Alzheimer’s disease | Gastric cancer |
| Osteogenesis imperfecta | Coronary artery disease | Stroke | Hepatocellular carcinoma |
| Coronary artery disease | Metabolic syndrome | Demenia | Hereditary nonpolyposis colorectal cancer |
| Atherosclerosis | Obesity | Depression | Melanoma |
| Hypertension | Hypertension | Huntington’s disease | Renal cell carcinoma |
| Ankylosing spondylitis | Coronary heart disease | Epilepsy | Prostate cancer |
| Hypertrophic cardiomyopathy | Diabetic nephropathy | Diabetes | Cervical cancer |
| Neurofibromatosis | End-stage renal disease | Alcoholism | Lung cancer |
These top-ranked disease–disease pairs also share drug indications. Among the top 10 most similar diseases to Marfan syndrome, many of them are cardiovascular diseases. By searching clinical trials related to Marfan syndrome, we found several ongoing clinical trials (http://clinicaltrials.gov/ct2/show/NCT01145612?term=marfan+syndrome&rank=2 and http://clinicaltrials.gov/ct2/show/NCT00485368?term=marfan+syndrome&rank=5) that are investigating the efficacy of losartan, atenolol and other angiotensin converting enzyme inhibitors, which are mainly used in the treatment of cardiovascular disease, in patients with Marfan syndrome.
5.6 Top-ranked manifestations from MEDLINE and from UMLS
To get a sense how manifestations in UMLS are different from those extracted from MEDLINE, we ranked manifestations from each data source by the number of diseases associated with them. From 50 551 D-M pairs from UMLS, we extracted 26 030 manifestations associated with 2430 diseases. From the 121 356 D-M pairs from MEDLINE, we extracted 16 258 manifestations associated with 16 288 diseases. We then ranked each manifestation by the number of its associated diseases. The top-10–ranked manifestations along with the number of associated diseases from each data source is shown in Table 4. As shown in the table, the manifestations (i.e. short stature, mental retardation, microcephaly and low-set ear) for D-M pairs from UMLS are mainly for congenital diseases like Down syndrome, Celiac disease, Menkes disease and Mohr syndrome. The top-ranked manifestations (i.e. infection, pain, hypertension and renal failure) from MEDLINE-based D-M pairs are mainly for chronic complex diseases such as diabetes mellitus, rheumatoid arthritis and osteoporosis. Therefore, to gain a more complete insight to disease–disease pairs that share manifestations, combined phenotypic data from both data sources, which are largely complementary to each other, are necessary.
Table 4.
Top 10 manifestations and the number of disease associated with them
| UMLS | Diseases (n) | MEDLINE | Diseases (n) |
|---|---|---|---|
| Seizures | 289 | Infection | 1725 |
| Short stature | 251 | Pain | 749 |
| Hypotonia | 245 | Hemorrhage | 644 |
| Mental retardation | 238 | Hypertension | 450 |
| Microcephaly | 194 | Depression | 436 |
| Hypertelorism | 189 | Anemia | 388 |
| Scoliosis | 183 | Malignant transformation | 382 |
| Low-set ears | 175 | ENT symptoms | 330 |
| Failure to thrive | 174 | Renal failure | 321 |
| Micrognathia | 174 | Thrombosis | 316 |
6 DISCUSSION
We presented a large-scale and accurate relationship extraction approach to accurately extract many D-M phenotype pairs from MEDLINE. Majority of these extracted pairs are not captured in existing knowledge bases.
Nevertheless, our study has several limitations: (i) We used known D-M pairs from UMLS to learn specific syntactic patterns. Among all D-M pairs (50 551 before synonym expansion and 3 499 871 pairs after synonym expansion) from UMLS, only 6899 pairs appeared in MEDLINE sentences. One possible reason for this low presence of UMLS pairs in MEDLINE is that most of the UMLS D-M pairs are for rare syndromes such as DiGeorge syndrome, Machado-Joseph Syndrome and Marfans syndrome. The D-M pairs from MEDLINE are mainly for common complex diseases such as cardiovascular diseases, neurologic diseases, rheumatoid arthritis and diabetes mellitus. Using the pairs from UMLS as prior knowledge, we discovered D-M–specific patterns. However, we do not know for sure whether these patterns associated with rare syndromes also represent typical patterns that researcher used to describe D-M relationships (including both rare syndromes and common complex diseases) in biomedical literature. Intuitively, D-M–specific patterns should be disease-independent and should also not depend on how common or rare the diseases are; (ii) We only used six manually selected patterns, though we extracted 121 359 unique D-M pairs from MEDLINE using these six patterns, largely owing to the large size of the text corpus. Pairs will be missed by this method if they are not associated with the selected patterns. To further improve the recall, we need to manually examine more top-ranked patterns and/or complement our approach with non–pattern-based approaches; (iii) Currently, we filtered extracted noun phrase pairs based on exact matching terms in the disease lexicon. We can increase the recall of the extracted pairs by keeping noun–phrase pairs as long as they contain any terms from the disease lexicons as substrings. For example, based on our current approach, D-M pair ‘Reovirus type 3 infection–primary biliary cirrhosis’ is missed because term ‘Reovirus type 3 infection’ is not included in the disease lexicon. We can modify our pattern by extracting noun–phrase pairs as long as they contain as substrings any terms from the input disease lexicon. However, the precision will also depend on the performance of the parser in noun–phrase boundary detection; (iv) Our approach is limited to extraction of D-M pairs that co-occur in the same sentences. Therefore pairs that co-occurred in abstracts but not in the same sentences are missed. Because of the large size of the text corpus (22 million articles so far), we expect that important D-M pairs will be reported in sentences; (v) We only performed a primitive correlation study between disease manifestations and disease-associated drugs and genes. Currently, we are applying network-based systems approaches in using the extracted D-M pairs for drug repurposing and candidate disease gene selection. We acknowledge that many D-M pairs may appear only in other sources, such as patient EHRs. Systematic extraction of disease–phenotype relationships from EHRs (phenotyping of EHRs) is discussed in (Hripcsak et al., 2013) and is one of our ongoing projects.
7 CONCLUSIONS
Computational approaches to the systematic study of disease clinical phenotypes have great potential in drug repurposing and in understanding disease etiology. However, the bottleneck in such systems-based approaches is the lack of an accurate, comprehensive and machine-understandable knowledge base of disease clinical phenotype associations. In this study, we presented a large-scale relationship extraction approach to automatically extract D-M pairs from MEDLINE. This approach is highly accurate and the methodology of our learning and extraction approach leverages on external knowledge and involves minimal human effort. In total, we extracted 121 359 distinct D-M pairs from MEDLINE, the majority of which are not captured in existing structured knowledge bases. We have shown that these pairs are highly correlated with both disease drug treatments and disease-associated genes. Currently, we are developing systems approaches to the study of disease–phenotype relationship knowledge, in combination with existing genetic and proteomic datasets. Our study will impact the progress of drug repurposing and facilitate a better understanding of disease candidate gene selection.
ACKNOWLEDGEMENT
Xu and Wang have jointly conceived the idea, designed and implemented the algorithms. All the authors have participated in study discussion and manuscript preparation. All authors read and approved the final manuscript
Funding: RX is funded by Case Western Reserve University/Cleveland Clinic CTSA Grant (UL1 RR024989). LL is funded by NCI R01CA136726. QW is funded by ThinTek LLC.
Conflict of Interest: none declared.
REFERENCES
- Ananiadou S, et al. Event extraction for systems biology by text mining the literature. Trends Biotechnol. 2010;28:381–390. doi: 10.1016/j.tibtech.2010.04.005. [DOI] [PubMed] [Google Scholar]
- Barabsi AL, et al. Network medicine: a network-based approach to human disease. Nat. Rev. Genet. 2011;12:56–68. doi: 10.1038/nrg2918. [DOI] [PMC free article] [PubMed] [Google Scholar]
- Baudot A, et al. Translational disease interpretation with molecular networks. Genome Biol. 2009;10:221. doi: 10.1186/gb-2009-10-6-221. [DOI] [PMC free article] [PubMed] [Google Scholar]
- Blaschke C, et al. Automatic extraction of biological information from scientific text: protein-protein interactions. Proc. Int. Conf. Intell. Syst. Mol. Biol. 1999;7:60–67. [PubMed] [Google Scholar]
- Bodenreider O. The unified medical language system (UMLS): integrating biomedical terminology. Nucleic Acids Res. 2004;32(Suppl 1):D267–D270. doi: 10.1093/nar/gkh061. [DOI] [PMC free article] [PubMed] [Google Scholar]
- Brunner HG, van Driel MA. From syndrome families to functional genomics. Nat. Rev. Genet. 2004;5:545–551. doi: 10.1038/nrg1383. [DOI] [PubMed] [Google Scholar]
- Chen B, et al. PubChem as a source of polypharmacology. J. Chem. Inf. Model. 2009;49:2044–255. doi: 10.1021/ci9001876. [DOI] [PubMed] [Google Scholar]
- Chen Y, et al. Uncover disease genes by maximizing information flow in the phenomeinteractome network. Bioinformatics. 2011;27:i167–i176. doi: 10.1093/bioinformatics/btr213. [DOI] [PMC free article] [PubMed] [Google Scholar]
- Chen Y, et al. Proceedings of the 2nd ACM SIGHIT Symposium on International Health Informatics. 2012. Semi-supervised image classification for automatic construction of a health image library; pp. 111–120. Association for Computing Machinery. [Google Scholar]
- Craven M. AAAI-99 Workshop on Machine Learning for Information Extraction. 1999. Learning to extract relations from MEDLINE; pp. 25–30. [Google Scholar]
- Doncheva NT, et al. Recent approaches to the prioritization of candidate disease genes. Wiley Interdiscip. Rev. Syst. Biol. Med. 2012;4:429–442. doi: 10.1002/wsbm.1177. [DOI] [PubMed] [Google Scholar]
- Friedman C, et al. GENIES: a natural-language processing system for the extraction of molecular pathways from journal articles. Bioinformatics. 2001;17(Suppl 1):S74–S82. doi: 10.1093/bioinformatics/17.suppl_1.s74. [DOI] [PubMed] [Google Scholar]
- Guo X, et al. A computational method based on the integration of heterogeneous networks for predicting disease-gene associations. PloS One. 2011;6:e24171. doi: 10.1371/journal.pone.0024171. [DOI] [PMC free article] [PubMed] [Google Scholar]
- Hamosh A, et al. Online Mendelian Inheritance in Man (OMIM), a knowledgebase of human genes and genetic disorders. Nucleic Acids Res. 2005;33(Suppl 1):D514–D517. doi: 10.1093/nar/gki033. [DOI] [PMC free article] [PubMed] [Google Scholar]
- Hindorff LA, et al. A catalog of published genome-wide association studies. www.genome.gov/gwastudies. (January 2012, date last accessed)
- Hoehndorf R, et al. PhenomeNET: a whole-phenome approach to disease gene discovery. Nucleic Acids Res. 2011;39:e119. doi: 10.1093/nar/gkr538. [DOI] [PMC free article] [PubMed] [Google Scholar]
- Hripcsak G, Albers DJ. Next-generation phenotyping of electronic health records. J. Am. Med. Inform. Assoc. 2013;20:117–121. doi: 10.1136/amiajnl-2012-001145. [DOI] [PMC free article] [PubMed] [Google Scholar]
- Hu G, Agarwal P. Human disease-drug network based on genomic expression profiles. PLoS One. 2009;4:e6536. doi: 10.1371/journal.pone.0006536. [DOI] [PMC free article] [PubMed] [Google Scholar]
- Hwang T, et al. Inferring disease and gene set associations with rank coherence in networks. Bioinformatics. 2011;27:2692–2699. doi: 10.1093/bioinformatics/btr463. [DOI] [PubMed] [Google Scholar]
- Kann MG. Advances in translational bioinformatics: computational approaches for the hunting of disease genes. Brief. Bioinform. 2010;11:96–110. doi: 10.1093/bib/bbp048. [DOI] [PMC free article] [PubMed] [Google Scholar]
- Keiser MJ, et al. Predicting new molecular targets for known drugs. Nature. 2009;462:175–181. doi: 10.1038/nature08506. [DOI] [PMC free article] [PubMed] [Google Scholar]
- Kinnings SL, et al. Drug discovery using chemical systems biology: repositioning the safe medicine Comtan to treat multi-drug and extensively drug resistant tuberculosis. PLoS Comput. Biol. 2009;5:e1000423. doi: 10.1371/journal.pcbi.1000423. [DOI] [PMC free article] [PubMed] [Google Scholar]
- Klein D, Manning CD. Accurate unlexicalized parsing. Proceedings of the 41st Annual Meeting on Association for Computational Linguistics. 2003;Vol. 1:423–430. Association for Computational Linguistics. [Google Scholar]
- Lage K, et al. A human phenome-interactome network of protein complexes implicated in genetic disorders. Nat. Biotechnol. 2007;25:309–316. doi: 10.1038/nbt1295. [DOI] [PubMed] [Google Scholar]
- Lamb J, et al. The Connectivity Map: using gene-expression signatures to connect small molecules, genes, and disease. Science. 2006;313:1929–1935. doi: 10.1126/science.1132939. [DOI] [PubMed] [Google Scholar]
- Lee DS, et al. The implications of human metabolic network topology for disease comorbidity. Proc. Natl Acad. Sci. USA. 2008;105:9880–9885. doi: 10.1073/pnas.0802208105. [DOI] [PMC free article] [PubMed] [Google Scholar]
- Li Y, Patra JC. Genome wide inferring gene phenotype relationship by walking on the heterogeneous network. Bioinformatics. 2010;26:1219–1224. doi: 10.1093/bioinformatics/btq108. [DOI] [PubMed] [Google Scholar]
- Noeske T, et al. Predicting compound selectivity by self organizing maps: cross-activities of metabotropic glutamate receptor antagonists. ChemMedChem. 2006;1:1066–1068. doi: 10.1002/cmdc.200600147. [DOI] [PubMed] [Google Scholar]
- Oti M, et al. Phenome connections. Trends Genet. 2008;24:103–106. doi: 10.1016/j.tig.2007.12.005. [DOI] [PubMed] [Google Scholar]
- Park J, et al. The impact of cellular networks on disease comorbidity. Mol. Syst. Biol. 2009;5:262. doi: 10.1038/msb.2009.16. [DOI] [PMC free article] [PubMed] [Google Scholar]
- Piro RM, Di Cunto F. Computational approaches to disease gene prediction: rationale, classification and successes. FEBS J. 2012;279:678–696. doi: 10.1111/j.1742-4658.2012.08471.x. [DOI] [PubMed] [Google Scholar]
- Rindflesch TC, et al. Pacific Symposium on Biocomputing. 2000. EDGAR: extraction of drugs, genes and relations from the biomedical literature. Pacific Symposium on Biocomputing, p. 517. NIH Public Access. [DOI] [PMC free article] [PubMed] [Google Scholar]
- Roque FS, et al. Using electronic patient records to discover disease correlations and stratify patient cohorts. PLoS Comput. Biol. 2011;7:e1002141. doi: 10.1371/journal.pcbi.1002141. [DOI] [PMC free article] [PubMed] [Google Scholar]
- Rosario B, Hearst MA. Proceedings of the 42nd Annual Meeting on Association for Computational Linguistics. 2004. Classifying semantic relations in bioscience texts; p. 430. Association for Computational Linguistics. [Google Scholar]
- Rzhetsky A, et al. Probing genetic overlap among complex human phenotypes. Proc. Natl Acad. Sci., USA. 2007;104:11694–11699. doi: 10.1073/pnas.0704820104. [DOI] [PMC free article] [PubMed] [Google Scholar]
- Sirota M, et al. Discovery and preclinical validation of drug indications using compendia of public gene expression data. Sci. Transl. Med. 2011;3:96ra77. doi: 10.1126/scitranslmed.3001318. [DOI] [PMC free article] [PubMed] [Google Scholar]
- Tiffin N, et al. Linking genes to diseases: it’s all in the data. Genome Med. 2009;1:77. doi: 10.1186/gm77. [DOI] [PMC free article] [PubMed] [Google Scholar]
- Tranchevent LC, et al. A guide to web tools to prioritize candidate genes. Brief. Bioinform. 2011;12:22–32. doi: 10.1093/bib/bbq007. [DOI] [PubMed] [Google Scholar]
- Van Driel MA, et al. A text-mining analysis of the human phenome. Eur. J. Hum. Genet. 2006;14:535–542. doi: 10.1038/sj.ejhg.5201585. [DOI] [PubMed] [Google Scholar]
- Vanunu O, et al. Associating genes and protein complexes with disease via network propagation. PLoS Comput. Biol. 2010;6:e1000641. doi: 10.1371/journal.pcbi.1000641. [DOI] [PMC free article] [PubMed] [Google Scholar]
- Vidal M, et al. Interactome networks and human disease. Cell. 2011;144:986–998. doi: 10.1016/j.cell.2011.02.016. [DOI] [PMC free article] [PubMed] [Google Scholar]
- Wang X, et al. Network-based methods for human disease gene prediction. Brie. Funct. Genomics. 2011;10:280–293. doi: 10.1093/bfgp/elr024. [DOI] [PubMed] [Google Scholar]
- Wu X, et al. Network-based global inference of human disease genes. Mol. Syst. Biol. 2008;4:189. doi: 10.1038/msb.2008.27. [DOI] [PMC free article] [PubMed] [Google Scholar]
- Xu R, et al. Unsupervised method for automatic construction of a disease dictionary from a large free text collection. AMIA Annual Symposium Proceedings. 2008;Vol. 2008:820. American Medical Informatics Association. [PMC free article] [PubMed] [Google Scholar]
- Xu R, et al. Proceedings of the Workshop on Current Trends in Biomedical Natural Language Processing. 2009a. Investigation of unsupervised pattern learning techniques for bootstrap construction of a medical treatment lexicon; pp. 63–70. Association for Computational Linguistics. [Google Scholar]
- Xu R, et al. Unsupervised method for extracting machine understandable medical knowledge from a large free text collection. AMIA Annual Symposium Proceedings. 2009b;Vol. 2009:709. American Medical Informatics Association. [PMC free article] [PubMed] [Google Scholar]
- Xu R, Wang Q. A knowledge-driven conditional approach to extract pharmacogenomics specific drug-gene relationships from free text. J. Biomed. Inform. 2012;45:827–837. doi: 10.1016/j.jbi.2012.04.011. [DOI] [PMC free article] [PubMed] [Google Scholar]
- Xu R, Wang Q. A semi-supervised approach to extract pharmacogenomics-specific drug-gene pairs from biomedical literature for personalized medicine. J. Biomed. Inform. 2013;46:585–593. doi: 10.1016/j.jbi.2013.04.001. [DOI] [PMC free article] [PubMed] [Google Scholar]
- Yang P, et al. Inferring gene-phenotype associations via global protein complex network propagation. PloS One. 2011;6:e21502. doi: 10.1371/journal.pone.0021502. [DOI] [PMC free article] [PubMed] [Google Scholar]
- Yao X, et al. Modularity-based credible prediction of disease genes and detection of disease subtypes on the phenotype-gene heterogeneous network. BMC Syst. Biol. 2011;5:79. doi: 10.1186/1752-0509-5-79. [DOI] [PMC free article] [PubMed] [Google Scholar]