Abstract
Purpose
Deformable image registration (DIR) algorithms have inherent uncertainties in their displacement vector fields (DVFs). The purpose of this study is to develop an optimal metric to estimate DIR uncertainties.
Methods
Six computational phantoms have been developed from the CT images of lung cancer patients using a finite element method (FEM). The FEM generated DVFs were used as a standard for registrations performed on each of these phantoms. A mechanics-based metric, unbalanced energy (UE), was developed to evaluate these registration DVFs. The potential correlation between UE and DIR errors was explored using multivariate analysis, and the results were validated by landmark approach and compared with two other error metrics: DVF inverse consistency (IC) and image intensity difference (ID). Landmark-based validation was performed using the POPI-model.
Results
The results show that the Pearson correlation coefficient between UE and DIR error is rUE-Error = 0.50. This is higher than rIC-Error = 0.29 for IC and DIR error and rID-Error = 0.37 for ID and DIR error. The Pearson correlation coefficient between UE and the product of the DIR displacements and errors is rUE-Error×DVF = 0.62 for the six patients and rUE-Error×DVF = 0.73 for the POPI-model data.
Conclusion
It has been demonstrated that unbalanced energy has a strong correlation with DIR errors, and the UE metric outperforms the IC and ID metrics in estimating DIR uncertainties. The quantified UE metric can be a useful tool for adaptive treatment strategies, including probability-based adaptive treatment planning.
Keywords: deformable image registration error, finite element method, computational phantom, inverse consistency
Image-guided radiation therapy (IGRT), where planar or volumetric imaging systems are employed for proper target localization before radiation delivery, has become common practice in radiotherapy (Dawson and Jaffray 2007). Daily imaging has increased the opportunity for clinicians to assess anatomical changes, including tumor shrinkage, weight loss, and organ filling differences over the treatment course. If deviations are larger than clinically acceptable, the original plan can be revised based on the updated, current patient anatomy and geometry. This is generally referred to as adaptive radiation therapy (ART) (Yan, Wong et al. 1997). For ART, deformable image registration (DIR) (Crum, Hartkens et al. 2004; Lu, Chen et al. 2004; Klein, Staring et al. 2007; Brock 2010) is often employed to establish a spatial correlation between images, which in turn is used to transfer daily treatment doses to the simulation image for cumulative dose computation. The original treatment plan can be re-optimized based on the cumulative dose delivered in the previous fractions.
However, DIR has errors in the displacement vector fields (DVFs), particularly in low gradient regions (Brock 2010; Murphy, Salguero et al. 2012). Consequently, the accumulated dose will have uncertainties that may compromise the quality of the re-optimized plan. Similar to the patient setup or dose coverage uncertainties which can be addressed by probabilistic planning approach (Gordon, Sayah et al. 2010), the DVF-induced dose uncertainties may be compensated in a probabilistic manner during dose accumulation and plan re-optimization. The probabilistic accumulation of the total dose may depend on the DIR errors estimated at each image voxel (Zhong, Weiss et al. 2008).
Many methods have been proposed to evaluate DIR errors. For example, visual assessment is the most commonly used method in the clinical setting to measure image registration performance due to its ease of use, although this method is qualitative. Relative overlap is defined as how well two objects (or structures) are registered, and can be calculated using methods such as dice similarity coefficient and nearest distance (Zhang, Chi et al. 2007). These evaluations may provide an assessment of the structure surface deformation, which is especially useful for contour propagation (Wang, Garden et al. 2008), but they do not provide any displacement errors in the interior part of the structure. Landmark points within regions of interest may convey valuable information for quality assurance (Castillo, Castillo et al. (2009), and anatomical landmarks can be manually chosen by experts or semi-automatically generated. Registration errors can be estimated by computing the distance between points in the fixed image and corresponding points in the moving image, although this requires significant manual work and review by experts. Physical phantoms (Chang, Suh et al. 2010) offer another option to directly derive the displacement errors at each voxel, and while useful for initial DIR validation, they may not be translatable into clinical practice. Given these limitations, conventional DIR evaluation approaches are unable to describe DIR uncertainties at each image voxel that are required for clinical implementation of probability-based, adaptive treatment planning (PATP).
Potential methods for voxel-by-voxel assessment of DVF uncertainties may include the following metrics: image intensity difference (ID), DVF inverse consistency (IC) (Bender and Tomé, 2009) and unbalanced energy (UE) (Zhong, Peters et al. 2007; Zhong, Kim et al. 2010). IC measures discrepancies in the map composed of both the forward and reverse DVF transformations between two images (Christensen and Johnson 2001). In contrast to the IC metric, UE is related only to the forward registration, and is computable at each image voxel for any clinical scenario. In this study, we will first compare UE with other similarity metrics based on benchmark platforms developed from patient images, and then focus on the relationship between UE and DIR error. Furthermore, landmark approach will be applied to validate this relation. Finally, we will compare the accuracies of the UE, IC and ID metrics in DIR error measurement. Based on statistical analysis, we will also quantify the relationship between UE and registration errors to support the clinical implementation of PATP.
2. Materials and Methods
2.1 Computational models and simulated CT images as benchmark platform
Computational models were developed from CT images of six lung cancer patients. For each image, tetrahedral meshes were generated and scaled to match the physical domain of the image. Diaphragm, spinal cord, and ribs were segmented with thresholds. Tetrahedral nodes located in diaphragm regions were selected as driving nodes, and those in spinal cord or lateral ribs were fixed as boundary constraints. With external forces assigned to the driving nodes, the displacement vectors of other anatomical structures were computed using the finite element modeling (FEM) system. The external forces were tuned so that diaphragm motion is in the range of 0.5∼3cm, a reasonable magnitude for lung deformation. To simulate slippage conditions at the lung boundary, boundary elements (identified using image gradients) were assigned a low Young's modulus (0.1 kPa) to reduce restriction of lung deformation at the chest wall. The image domain was partitioned into 780,000 tetrahedrons with 132,000 nodes to achieve high modeling accuracy. More details can be found in Zhong et al. 2010.
With each of these computational models, a simulation image (FEM image) can be warped from a source image based on the model-generated DVF (FEM-DVF). Specifically, suppose that each voxel (u,v,w) in the FEM image is equally subdivided into n3 subvoxels, and subvoxel (ui,vj,wk) is back-projected by the FEM-DVF to voxel (x,y,z) in the source image. The intensity of the FEM image at (u,v,w) is then defined by
| (1) |
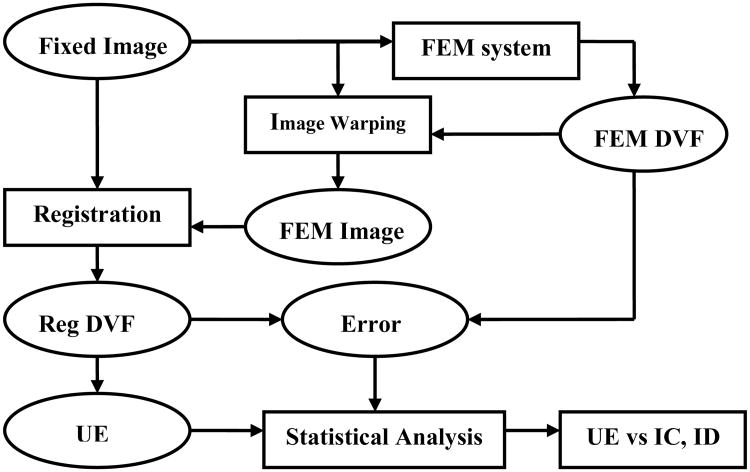
where M(u,v,w) is the set of all the voxels in the source image that are corresponding to voxel (u,v,w) in the FEM image. Here, the FEM-DVF was considered the standard by which to evaluate any image registration that was performed from the source image to the simulation image. The CT image datasets consist of 512×512×Z (slices) voxels with resolution 0.97mm×0.97mm×3mm. DIR was implemented in Elastix (Klein and Staring 2008) using a multi-resolution grayscale-based approach applied to minimize the cost function using the gradient descent method and B-spline transformation. DIR was performed from a fixed image to its FEM image to generate a registration DVF (Reg-DVF). The FEM-DVF was subtracted from Reg-DVF, and the magnitude of their difference vector was defined as the registration error. Next, UE of the registration DVF was computed with the method described below. For statistical analysis, CT images were separated into two regions of interest (ROIs): lung and non-lung, using a 3D lung mask derived from a home-made lung region detecting software. For each ROI, the quantities of registration DVF, registration error and UE were calculated, and their correlations were analyzed with a nonlinear regression model. Finally, an optimized UE metric was compared with the IC and ID metrics. An overview of procedure is shown in the flow chart below (Fig. 1).
Fig. 1.
Flowchart of deformable image registration error evaluation. All abbreviations are described in detail in the text.
2.2 Deformable image registration
DIR attempts to find a spatial relation between two images: a fixed image IF, and a moving image IM which is deformed to match the fixed image. The registration process seeks to find a displacement coordinate (ux,uy,uz) so that each voxel in the moving image IM(x + ux,y + uy,z + uz) is spatially aligned to the fixed image IF(x, y, z). The quality of alignment may be defined by a similarity metric, such as the sum of squared differences, correlation ratio, or mutual information (MI) between the two images. MI combined with the B-Spline Elastix model (Klein, Staring et al. 2010) was used in this DIR study because it has been shown to be a reliable method (Brock 2010). After registration, the global cross correlations (GCC) between the fixed and deformed images were calculated to demonstrate the overall performance of the registration for each patient.
2.3 Metrics for evaluation of DIR errors
UE, a measure used to quantify DIR errors, has been described in the literature (Zhong, Peters et al. 2007). According to elasticity theory, the work from external force and the elasticity energy stored in tissue are balanced at its deformed status, and ideally, their sum should be zero. For a given DVF, if the sum is not zero in some region, the DVF may have errors in that region, and the sum is then referred to as the UE. UE can be computed using a finite element method (Schnabel, Tanner et al. 2003; Zhong, Peters et al. 2007). Briefly, we divide each image domain into a set of discrete tetrahedral elements. For each element j, the displacement at node k (k=1, 2, 3, 4) is generated from an image registration. The UE for this element can be represented as:
| (2) |
Where Ej is the Young's modulus given for element j and Ejmjl is an entry in the stiffness matrix. Ej was set to 1 kPa for lung, 10.0 kPa for soft tissue and 1 MPa for bone in this study. The Poisson ratio contained in the term mjl was set to 0.38 for lung and 0.49 for other elements. Note that UE was calculated only from the DIR's DVF without any prior knowledge of the FEM phantom. As a result, UE may reveal part of the physical property that was implicitly contained in the DIR's DVF, while can not reproduce the phantom's deformation. For this reason, UE is assumed to be an implicit function of the DIR's DVF and its potential error, as suggested by equation (2).
IC is another voxel-based metric utilized to measure registration displacement errors. Suppose f and g are the DVF maps of the forward and reverse registrations between the moving and fixed images. For each voxel in the fixed image, its center c0(x0, y0, z0) is mapped to point p(u, v, w) on the moving image, i.e. p=f(c0). With the inverse map g, p is pulled back to point q(x1, y1, z1) on the fixed image, i.e. q=g(p). The IC is then defined (Christensen and Johnson 2001) as follows:
| (3) |
Based on the definition (3), the voxel-by-voxel cumulative IC errors can be computed to evaluate registration performance.
Since visual assessment is commonly used to qualitatively evaluate the DIR quality, the metric of intensity difference (ID) which functions as a quantified visual assessment is implemented as:
| (4) |
where IM(i, j, k) and IF(i, j, k) are the intensity of the moving and fixed images at voxel (i, j, k), respectively. ID is especially sensitive to registration errors in high contrast regions.
2.4 Statistical analysis of UE and DIR-related components
As a metric to measure DIR error, the UE value at each voxel can be computed from the DIR displacements in its neighboring voxels. The quality of DIR could be influenced by the intensity distributions, intensity gradients, and physical deformation of the underlying images. To identify potential relationships between UE and these quantities, the Pearson correlation coefficients (CC) among these quantities were calculated. The CC is defined as:
| (5) |
where , , , and . N is the total number of voxels in one image, and IR and IC represent the intensities of the reference image and the compared image, respectively.
2.5 Verification by landmark approach
4DCT POPI-model datasets (Vandemeulebroucke, J., et al. 2007) have been used to verify the relation between UE and registration error. The datasets consist of ten 3D volumes representing ten different phases (named as 10, 20 … 90) of one breathing cycle. The 3D image volume size is 512 × 512 × 141 with a resolution of 0.97mm × 0.97mm × 2mm. Deformable image registrations between two phases of the 4DCT series were performed, resulting in vector fields that map voxels from one phase to homologous voxels of the other phase. The differences of these deformation vector fields (DVFs) and the corresponding landmark points were registration errors. All the images and landmarks used for this evaluation can be downloaded through POPI-model web site (http://www.creatis.insa-lyon.fr/rio/popi-model_original page).
3. Results
3.1 Developed benchmark platform
Fig. 2a shows the reference image of patient 5 which is used to construct the simulated CT image in Fig. 2b. Fig. 2c is the magnitude of the corresponding FEM-DVF used to map the reference image to the simulated image. Note that the FEM-DVF is the standard DVF used for comparison in this study. A lung mask was generated for each of the six patient datasets, and used to divide data into lung region and non-lung region.
Fig. 2.

(a) Lung patient CT image used to construct the simulated CT image. (b) The simulated CT image generated by FEM model. (c) The magnitude of FEM model displacement vector field (cm) (FEM-DVF).
3.2 Image registration and UE calculation
GCC was calculated to measure the overall registration performance for each patient. The averages of image intensity, DVF, registration error, and UE values were computed in the lung region (Table 1) and the non-lung region (Table 2). As described in section 2.1, different deformation forces applied to patient datasets to create different phase images. The variation of these parameters in the six patients demonstrated that larger DVF magnitudes yielded larger UE and associated errors.
Table 1. Mean Registration DVF, UE and Error in the lung region.
| Patient | UE (mJ) | Error (mm) | DVF (mm) | Intensity (A.U.) | GCC |
|---|---|---|---|---|---|
| 1 | 20.2 + 21.2 | 0.5 + 0.3 | 3.8 + 2.2 | 273.4+ 127.5 | 0.90 |
| 2 | 62.4+60.4 | 0.7+0.5 | 6.9+3.8 | 273.3+ 127.6 | 0.84 |
| 3 | 24.7+36.6 | 0.6+0.4 | 4.7+3.5 | 171.4+ 118.4 | 0.91 |
| 4 | 67.3+82.1 | 0.9+0.8 | 8.4+5.7 | 174.8+126.7 | 0.84 |
| 5 | 119.0+151.8 | 0.7+1.1 | 12.6+8.0 | 239.9+120.1 | 0.87 |
| 6 | 324.9+358.3 | 1.3 + 2.3 | 22.0+13.2 | 242.4+129.8 | 0.81 |
Table 2. the mean of Registration DVF, UE and Error in the non-lung region.
| Patient | UE (mJ) | Error (mm) | DVF (mm) | Intensity (A.U.) | GCC |
|---|---|---|---|---|---|
| 1 | 22.2 ±43.3 | 0.6 ±0.5 | 3.1 ±3.3 | 1004.0± 156.9 | 0.97 |
| 2 | 65.1 ± 110.4 | 0.9 ± 1.5 | 5.8±5.9 | 1003.7± 157.0 | 0.95 |
| 3 | 18.1 ±48.9 | 0.5 ±0.5 | 3.0±4.1 | 989.8 ± 156.3 | 0.97 |
| 4 | 50.9 ± 118.2 | 0.8± 1.6 | 5.7±7.5 | 990.6 ± 156.2 | 0.95 |
| 5 | 135.3 + 231.8 | 1.4 ±3.4 | 11.7+ 11.9 | 1013.1 ±159.5 | 0.92 |
| 6 | 331.0 ±528.0 | 2.2 ±4.7 | 20.7 ±20.3 | 1011.1 + 160.7 | 0.86 |
Comparing Table 1 to Table 2, the intensity and GCC are considerably different. The GCC in the non-lung region tended to be larger than the GCC in lung region. A possible explanation for this is that the mean intensity of non-lung region is much higher than that of lung region. Therefore the overall intensity difference in the non-lung region is higher than that in the lung region, resulting in better registration performance in the non-lung region. It is also possible that GCC is not sensitive to DIR errors in the non-lung region.
3.3 Component analysis of DIR error and UE
Four vectors, including Error, UE, DVF, and intensity, each with more than 10 million data points, were used for the statistical analysis. Fig. 3 illustrates the impact of different image components on DIR errors, where CCError-UE, CCError-DVF, CCError-Intensity and CCError-Gradient represent correlation coefficients (CCs) between registration error and UE, registration DVF, image intensity and intensity gradient respectively. The DIR errors are more closely related to UE and DVF than to image intensity and image gradient for both lung and non-lung regions. The strong correlation between the UE and DIR error suggests that an implicit function may exist between the two terms.
Fig. 3.
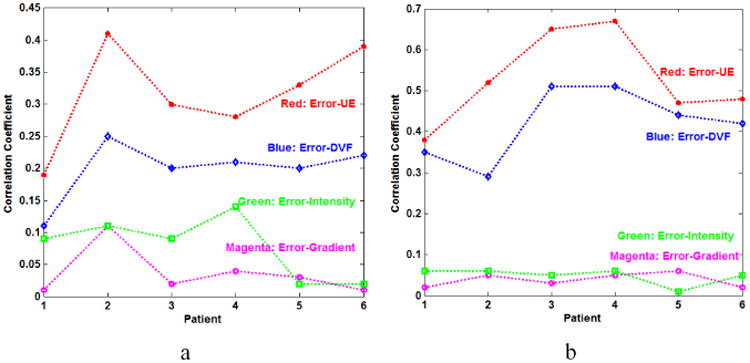
The CCs of Error-UE, Error-DVF, Error-Intensity and Error-Gradient (a) in the lung region and (b) in the non-lung region of 6 patients.
Fig. 4 shows the correlation coefficients between UE and error, DVF, and DVF×Error accordingly. DVF×Error denotes the product of the error and DVF. As shown in Fig. 4, the quantities DVF and Error×DVF are highly correlated with UE, the CCs of UE-Error×DVF is larger than the CCs of UE-Error, and UE has a stronger correlation with the DIR errors than the intensity. Here, the CCs between the UE and intensity over the six patients are less than 0.1, showing that the UE metric is independent of underlying image intensity. This observation is consistent with the UE definition in equation (2).
Fig. 4.
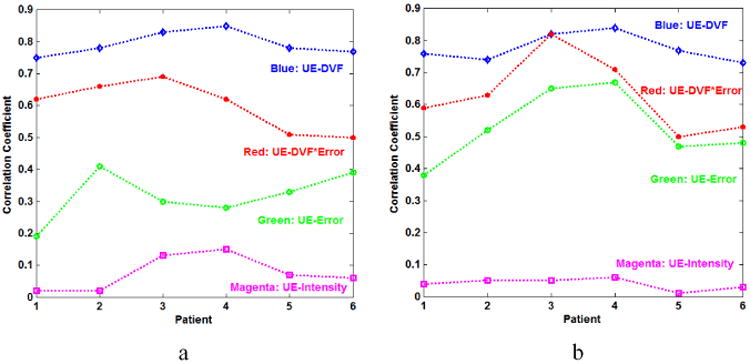
The correlation coefficients of UE-Error, UE-DVF, UE-Intensity and UE-Error×DVF (a) in the lung region and (b) in the non-lung region of 6 patients.
3.4 Explicit relationship between DIR error and UE
The high correlation coefficients in Fig. 4 suggest that UE can be represented directly in terms of DVF and Error. The unbalanced energy of Reg-DVF of patient 6 is shown in Fig. 5a. Subtracting Reg-DVF from FEM-DVF will result in the DIR standard errors as shown in Fig. 5b. The patterns of UE map in Fig. 5a are not similar to the patterns of error map in Fig. 5b because the DVF values in the circle region in Fig. 5d are greater than any other places. However, after the errors are multiplied by their displacements, the resultant image (Fig. 5c) shows an improved similarity to Fig 5a. This suggests that DVF×Error is a dominant term in the implicit UE-Error function.
Fig. 5.
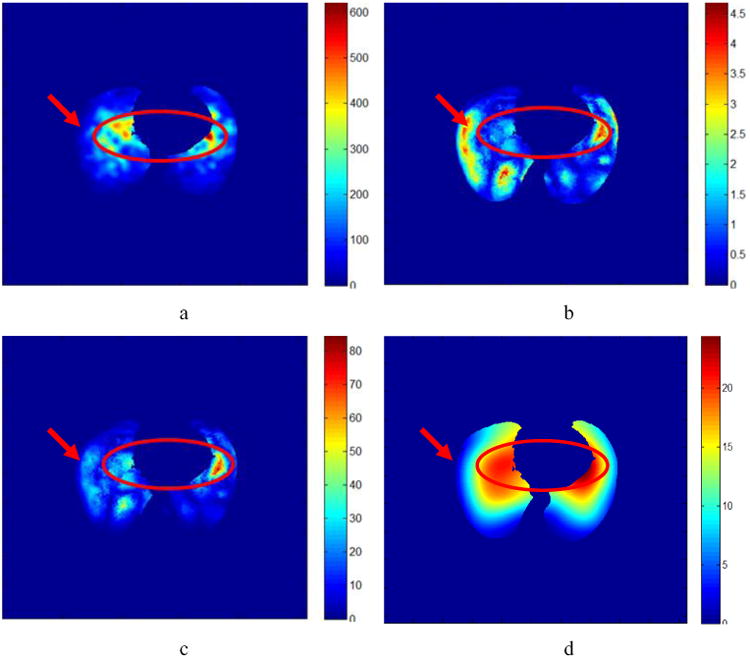
a) The UE (mJ) masked in the lung region. (b) The corresponding standard error (mm). (c) The DVF×Error (mm2). (d) The Reg-DVF in the lung region.
To quantify the relationship between UE and DVF×Error, the mean UE and mean DVF×Error have been calculated for each patient. Fig. 6a shows that the mean UE has a linear relationship with DVF×Error over the six patients. The correlation coefficient between UE and the product of the DIR displacements and errors in both lung and non-lung region for the six patients is 0.62.
Fig. 6.
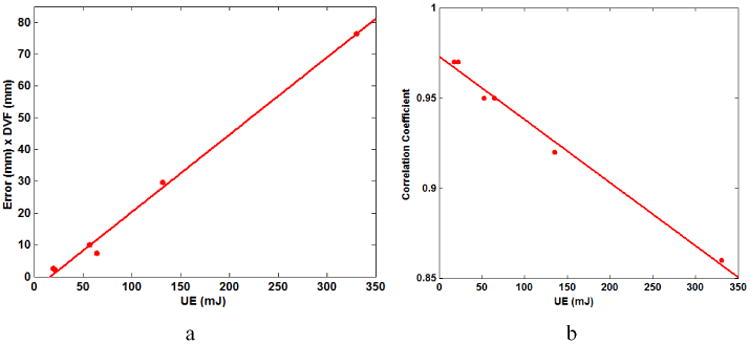
(a) The correlation between the means UE and Error×DVF for six patients. (b) The relationship between UE and GCC of Table 2 for six patients.
For each patient, each UE is corresponding to one GCC shown in Table 1 and Table 2. The relation between UE and GCC of Table 2 is shown as Fig. 6b. The result shows that UE is inversely proportional to GCC. This indicates that the higher the UE values, the poorer the overall quality of the registration.
3.5 Comparison of UE with IC and ID metrics
Based on equations (3) and (4), IC and ID vectors were generated for each patient. The CCs between the registration error vector and the IC, ID and UE vectors were calculated as shown in Fig. 7. The CCs for patient 5 are shown across the entire CT dataset in Fig. 7a. The CCs between registration error and IC, ID and UE metrics averaged for each of the six patients are shown in Fig. 7b.
Fig. 7.
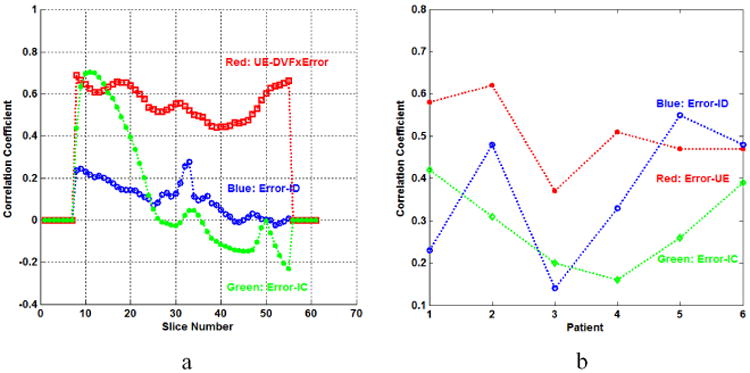
(a) The CCs of UE-DVF×Error, Error-IC and Error-ID for each slice of patient 2. (b) The CCs of Error-UE, Error-IC and Error-ID calculated for the six patients.
The CCs between UE and DVF×Error are larger than CCs for the other metrics for most of these slices. The results in Fig. 7b show that the CCs of Error-UE are larger than those of Error-IC for all patients, and are also larger than the CCs of Error-ID in all but one patient. The Pearson correlation coefficient between UE and DIR error is rUE-Error = 0.50, which is higher than rIC-Error = 0.29 for IC and DIR errors and rID-Error = 0.37 for ID and DIR errors.
3.6 Verification with POPI-Model datasets
The phase 50 from the POPI model datasets was selected as the fixed image and the eight other phases 10, 20, … 90 were selected as the moving image. Registration displacement vector fields (Reg DVF) were generated by the Elastix software (Klein, Staring et al. 2010). The registration errors at landmarks were computed by substracting the Reg DVF from the landmark's displacements. Meanwhile, UEs at each landmarks were calculated from Reg-DVF using the same approach as mentioned before. POPI-model results are shown in Fig. 8. It can be found that the relation of UE and Error×DVF is approximately linear and it is consistent with the result drawn by the simulation data (Fig. 6a). Furthermore, the CC between UE and error is 0.64, and the CC between UE and Error×DVF is 0.74. This indicates that the term of Error×DVF, instead of the error itself, is a better representation of UE.
Fig. 8.
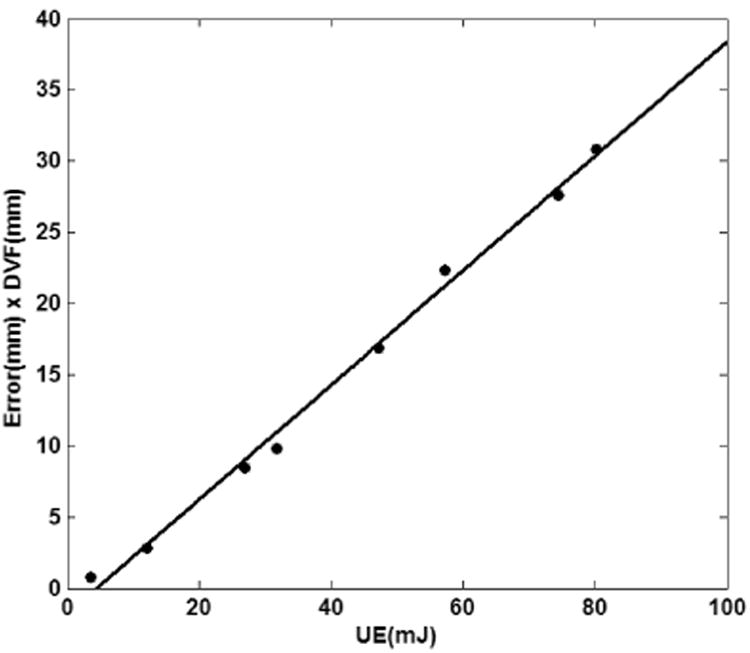
The relation between the UE and Error×DVF for the landmark datasets of the eight phases for the POPI-model. Each dot represents the averages of UE and Error × DVF over 41 landmarks in each phase.
3.7 Verification with patient images
Patient 4D datasets were used to further study the relationship between UE and registration error. Two 4D images from the same lung patient, one at inhale phase and the other at exhale phase, were registered by Elastix, and the generated DVF was used to calculate UE. Registration error and IC were evaluated and compared to UE. Fig. 9a shows the registered image overlaid on the fixed image with a mis-matched area marked by a circle. The image intensity profiles along the line in Fig. 9a are shown in Fig. 10a. The large differences between the two profiles appear in the range of x=130-140. This may indicate about 10 voxel displacement errors in the circle area. Fig. 9b shows the overlay of the UE image on the fixed image and Fig. 9d is the magnitude image of DVF. It can be found that the circled region in Fig. 9b has large UEs but relatively small DVFs (Fig. 9d). By reviewing the overlaid images in Fig. 9a, large registration errors have been observed in the regions highlighted in the circles. The IC (Fig. 9c) fails to detect these errors in the corresponding regions. This example shows that DIR errors can be detected from large UE and small DVF values and it confirms the qualitative relationship between UE and DVF×Error.
Fig. 9.
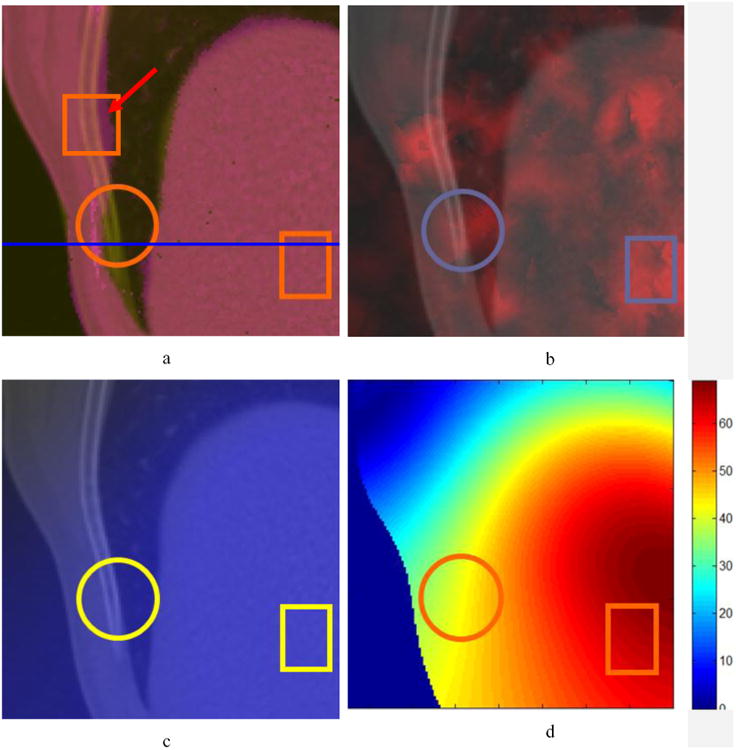
The fixed image map overlaid by (a) the registered image; (b) the UE image; (c) the IC image; (d) the magnitude image of DVF. Circle regions show areas of anatomical mismatch in (a) while rectangular regions demonstrate that UE is able to detect DIR errors in uniform intensity regions in (b). The profile of the line in (a) is plotted in Fig. 10.
Fig. 10.
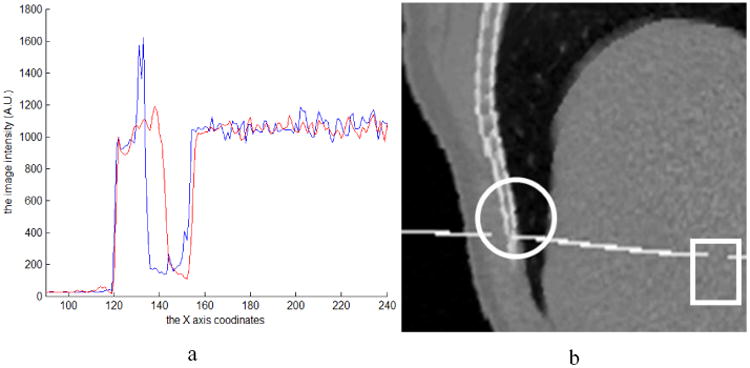
(a) The profile of the line in Fig. 9a, where the blue curve is from the fixed image and the red one is from the registered image. (b) The moving image embedded with a transversal plane was warped by the registration DVF.
The relationship of UE and DVF×Error can be applied in the scenarios where other metrics fail to work. In the rectangular regions shown in Fig. 9a, the registration errors could not be estimated by visual comparison because of the uniform intensity in these regions. However, this region has larger UE rectangle (Fig. 9b) with medium DVFs compared to their neighboring voxels (Fig. 9d). According to the relation between UE and DVF×Error, relatively large registration errors should be in the rectangular region. To demonstrate the errors in this region, a transversal plane with the intensity of 2000 was inserted into the moving image at the position of the profile line marked in Fig. 9a, and the moving image was then warped with the registration DVF. The continuous plane in solid organs should remain continuous. The discontinuities of the warped transversal plane in the circular and rectangle regions indicate unrealistic deformations and errors in these regions. But the IC metric (Fig. 9c) fails to illustrate these errors, and visual comparison method (Fig. 9a) can not identify the errors in the uniform region. In summary, this example shows that regions with large registration errors can be estimated by evaluating UE and its corresponding DVF values.
4. Discussion
This work sought to implement UE as a metric for evaluating the quality of DIR, with the overarching goal of integrating the UE evaluation results in a probability-based adaptive treatment planning system. Our study demonstrates that the UE is independent of image intensity, and performs well in either high or low image gradient regions. For example, with visual comparison, the observer may not detect whether registration errors exist in the rectangular regions of Fig. 9a. However, the larger UE intensities in the rectangular region of Fig. 9b with a medium DVF region of Fig. 9d, suggests that relatively large registration errors compared to their neighboring voxels exist in these rectangular regions. This shows that UE alone can be sensitive to poor DIR performance, particularly in areas of uniform intensity.
According to the definition (2), UE is a function of the displacements and their errors in a small neighborhood surrounding the voxel. The experimental results prove that compared to registration errors alone, the product of DVF×Error shows a stronger association with UE, as shown in Fig. 4. Most importantly, Fig. 7 shows that the mean UE is inversely proportional to GCC for the six patients evaluated. This indicates that when the similarities between fixed image and registration image decrease, i.e. their corresponding registration errors increase, the values of UE increase. This suggests that UE metric is a sensitive tool for image registration error evaluation.
For the purpose of comparison, two voxel-level error evaluation methods, IC and ID, were also implemented. Figure 7a shows a strong correlation between UE and DVF×Error for most CT images, but the IC metric is not stable from slice to slice with the CC values changing from +0.7 to -0.22. This result is consistent with the literature (Bender and Tome 2009). ID, on the other hand, demonstrated weak associations that were of much smaller magnitude (range: 0.29--0.02) than the CC from UE metric. A possible explanation for this is that while registration error can be detected by comparing intensity difference at specific location, the value of intensity difference itself does not directly reflect registration errors. The CCs between ID and registration error could be high for some patients if their image intensity differences are more or less proportional to their displacement errors. But on average, UE is better than the IC and ID metrics in evaluation of DIR errors.
In the implemented FEM model, each tetrahedron contains about 33 voxels in the image domain, and each tetrahedron has more than ten neighboring tetrahedrons. Even if image data was cropped into 128×128×50, resulting in one tetrahedron corresponds to one voxel in the image domain, the UE value at each tetrahedron still includes contributions from its neighboring tetrahedron. So the UE value of this tetrahedron is an average of the energy contributed from the ten neighboring voxels. Therefore, the UE result illustrates the average registration error from neighborhood voxels, instead of for each specific voxel. In addition, high UE values could also be introduced by inappropriate modeling of unpredictable mass changes, such as rectal or bladder filling, during the course of radiation treatment, which should be managed on a case-by-case basis? so special attentions should be paid to those mass-changed organs.
In general, UE is an image independent, quantitative evaluation method that may detect and localize potential registration errors. Because of its superiority to the two metrics, UE may serve as a candidate metric to be implemented into treatment strategies such as ART and probabilistic treatment planning. It also can be used as a feedback tool for clinicians by identifying large DIR errors in low contrast regions and may help implement DIR into the clinical setting, where tools for direct and robust quantitative comparison are not currently available. The statistical analysis results derived in this study have shown that the UE metric has potential to generate registration uncertainty distributions which can be incorporated into final dose calculation through a mechanism such as probabilistic planning.
5. Conclusions
Based on the statistical analysis of a large number of sampled data, this study has demonstrated that a close relationship exists between UE and DIR error. As an evaluation metric alternative to IC and ID, UE may help quantify the uncertainty of clinical image registrations at voxel level, and has the potential to be used for probabilistic, adaptive treatment planning.
Acknowledgments
This work was supported by NIH/NCI Grant Number R01 CA140341.
References
- Bender ET, Tome WA. The utilization of consistency metrics for error analysis in deformable image registration. Phys Med Biol. 2009;54(18):5561–5577. doi: 10.1088/0031-9155/54/18/014. [DOI] [PMC free article] [PubMed] [Google Scholar]
- Brock KK. Results of a multi-institution deformable registration accuracy study (MIDRAS) Int J Radiat Oncol Biol Phys. 2010;76(2):583–596. doi: 10.1016/j.ijrobp.2009.06.031. [DOI] [PubMed] [Google Scholar]
- Castillo R, Castillo E, et al. A framework for evaluation of deformable image registration spatial accuracy using large landmark point sets. Phys Med Biol. 2009;54(7):1849–1870. doi: 10.1088/0031-9155/54/7/001. [DOI] [PubMed] [Google Scholar]
- Chang J, Suh TS, et al. Development of a deformable lung phantom for the evaluation of deformable registration. J Appl Clin Med Phys. 2010;11(1):3081. doi: 10.1120/jacmp.v11i1.3081. [DOI] [PMC free article] [PubMed] [Google Scholar]
- Christensen GE, Johnson HJ. Consistent image registration. IEEE Trans Med Imaging. 2001;20(7):568–582. doi: 10.1109/42.932742. [DOI] [PubMed] [Google Scholar]
- Crum WR, Hartkens T, et al. Non-rigid image registration: theory and practice. Br J Radiol. 2004;77(Spec No 2):S140–153. doi: 10.1259/bjr/25329214. [DOI] [PubMed] [Google Scholar]
- Dawson LA, Jaffray DA. Advances in image-guided radiation therapy. J Clin Oncol. 2007;25(8):938–946. doi: 10.1200/JCO.2006.09.9515. [DOI] [PubMed] [Google Scholar]
- Gordon JJ, Sayah N, et al. Coverage optimized planning: probabilistic treatment planning based on dose coverage histogram criteria. Med Phys. 2010;37(2):550–563. doi: 10.1118/1.3273063. [DOI] [PMC free article] [PubMed] [Google Scholar]
- Klein S, Staring M, et al. elastix: a toolbox for intensity-based medical image registration. IEEE Trans Med Imaging. 2010;29(1):196–205. doi: 10.1109/TMI.2009.2035616. [DOI] [PubMed] [Google Scholar]
- Klein S, Staring M, et al. Evaluation of optimization methods for nonrigid medical image registration using mutual information and B-splines. IEEE Trans Image Process. 2007;16(12):2879–2890. doi: 10.1109/tip.2007.909412. [DOI] [PubMed] [Google Scholar]
- Lu W, Chen ML, et al. Fast free-form deformable registration via calculus of variations. Phys Med Biol. 2004;49(14):3067–3087. doi: 10.1088/0031-9155/49/14/003. [DOI] [PubMed] [Google Scholar]
- Murphy MJ, Salguero FJ, et al. A method to estimate the effect of deformable image registration uncertainties on daily dose mapping. Med Phys. 2012;39(2):573–580. doi: 10.1118/1.3673772. [DOI] [PMC free article] [PubMed] [Google Scholar]
- Schnabel JA, Tanner C, et al. Validation of nonrigid image registration using finite-element methods: application to breast MR images. IEEE Trans Med Imaging. 2003;22(2):238–247. doi: 10.1109/TMI.2002.808367. [DOI] [PubMed] [Google Scholar]
- Wang H, Garden AS, et al. Performance evaluation of automatic anatomy segmentation algorithm on repeat or four-dimensional computed tomography images using deformable image registration method. Int J Radiat Oncol Biol Phys. 2008;72(1):210–219. doi: 10.1016/j.ijrobp.2008.05.008. [DOI] [PMC free article] [PubMed] [Google Scholar]
- Yan D, Wong J, et al. Adaptive modification of treatment planning to minimize the deleterious effects of treatment setup errors. Int J Radiat Oncol Biol Phys. 1997;38(1):197–206. doi: 10.1016/s0360-3016(97)00229-0. [DOI] [PubMed] [Google Scholar]
- Zhang T, Chi Y, et al. Automatic delineation of on-line head-and-neck computed tomography images: toward on-line adaptive radiotherapy. Int J Radiat Oncol Biol Phys. 2007;68(2):522–530. doi: 10.1016/j.ijrobp.2007.01.038. [DOI] [PubMed] [Google Scholar]
- Zhong H, Kim J, et al. Analysis of deformable image registration accuracy using computational modeling. Med Phys. 2010;37(3):970–979. doi: 10.1118/1.3302141. [DOI] [PMC free article] [PubMed] [Google Scholar]
- Zhong H, Peters T, et al. FEM-based evaluation of deformable image registration for radiation therapy. Phys Med Biol. 2007;52(16):4721–4738. doi: 10.1088/0031-9155/52/16/001. [DOI] [PubMed] [Google Scholar]


