

Abstract
OBJECTIVES
A prospective, multicenter 18fluorine-fluorodeoxyglucose (18F-FDG) positron emission tomography (PET)/computed tomography (CT) imaging study was performed to estimate the correlations among arterial FDG uptake and atherosclerotic plaque biomarkers in patients with peripheral artery disease.
BACKGROUND
Inflammation within atherosclerotic plaques is associated with instability of the plaque and future cardiovascular events. Previous studies have shown that 18F-FDG-PET/CT is able to quantify inflammation within carotid artery atherosclerotic plaques, but no studies to date have investigated this correlation in peripheral arteries with immunohistochemical confirmation.
METHODS
Thirty patients across 5 study sites underwent 18F-FDG-PET/CT imaging before Silver-Hawk atherectomy (FoxHollow Technologies, Redwood City, California) for symptomatic common or superficial femoral arterial disease. Vascular FDG uptake (expressed as target-to-background ratio) was measured in the carotid arteries and aorta and femoral arteries, including the region of atherectomy. Immunohistochemistry was performed on the excised atherosclerotic plaque extracts, and cluster of differentiation 68 (CD68) level as a measure of macrophage content was determined. Correlations between target-to-background ratio of excised lesions, as well as entire arterial regions, and CD68 levels were determined. Imaging was performed during the 2 weeks before surgery in all cases.
RESULTS
Twenty-one patients had adequate-quality 18F-FDG-PET/CT peripheral artery images, and 34 plaque specimens were obtained. No significant correlation between lesion target-to-background ratio and CD68 level was observed.
CONCLUSIONS
There were no significant correlations between CD68 level (as a measure of macrophage content) and FDG uptake in the peripheral arteries in this multicenter study. Differences in lesion extraction technique, lesion size, the degree of inflammation, and imaging coregistration techniques may have been responsible for the failure to observe the strong correlations with vascular FDG uptake observed in previous studies of the carotid artery and in several animal models of atherosclerosis.
Keywords: atherosclerosis, FDG-PET/CT, inflammation, peripheral artery disease
The association of atherosclerotic plaque inflammation with clinical cardiovascular events (1) has sparked development of noninvasive imaging modalities that can measure such inflammation (2). Such techniques might improve identification of patients at risk of cardiovascular events and may be useful for monitoring therapeutic responses. The arterial uptake of 18fluorine-fluorodeoxyglucose (18F-FDG), measured by the positron emission tomography (PET) component of PET/computed tomography (CT), has shown promise as a surrogate marker of arterial inflammation in the carotid arteries, vertebral arteries, and aorta (3–8). It has been demonstrated that FDG uptake correlates with levels of circulating inflammatory biomarkers (9), expression of inflammatory genes (10), cardiovascular risk factors (9), and localization of symptomatic plaques (4). Autoradiographic examination of plaque after 18F-FDG-PET/CT imaging has revealed that macrophages account for the majority of FDG uptake (3,6,7). However, such studies have only been performed in the carotid arteries.
Symptomatic peripheral artery atherosclerosis affects an estimated 8 million Americans (11), with a 5-year death rate of 30% attributed to coexisting cardiovascular and cerebrovascular disease (12). FDG PET/CT imaging in peripheral arteries, including the femoral arteries, has high reproducibility (13). To date, there has been no investigation of the cell type responsible for FDG uptake in peripheral atherosclerosis. To investigate this topic, we recruited patients with symptomatic peripheral artery disease (PAD) scheduled for percutaneous atherectomy. 18F-FDG-PET/CT imaging was performed before atherectomy, and excised plaque samples were obtained for immunohistochemistry. The primary objective was to estimate the correlation between arterial FDG uptake and the macrophage content of excised plaque tissue. Secondary aims were to measure correlations between lesional FDG uptake, FDG uptake in other vascular beds, and cardiovascular risk factors.
METHODS
Patient recruitment
We used a multicenter recruitment and imaging strategy. Five hospital sites underwent study training by the core imaging laboratory, Mount Sinai Hospital (Table 1). A multicenter nature was chosen in the hope of increasing patient recruitment and to develop a method for secure online PET image transfer. After institutional review board approval, 30 patients with intermittent claudication were recruited for the trial. Eligible patients were aged between 40 and 85 years, had 1 or more de novo atherosclerotic lesions of at least 60% stenosis in the common or superficial femoral artery, and had been referred for therapeutic peripheral artery atherectomy for treatment of their PAD. Patients were excluded if they had any of the following: recent cardiovascular event (<3 months), critical limb ischemia, total occlusion of the target vessel, a glucose level >200 mg/dl on the day of imaging, a body mass index >40 kg/m2, or type 1 diabetes. These criteria were chosen to avoid the delay of treatment and/or avoid the unnecessary introduction of variables that are known to affect standard uptake values of FDG. Medical history was obtained from each patient on the day of enrollment in the study, including presence of cardiovascular risk factors. All patients underwent 18F-FDG-PET/CT imaging within the 2 weeks before atherectomy of their symptomatic lesion.
Table 1.
Sites Participating in This Multicenter Study
| Study Site | PET/CT Scanner | No. of Patients Enrolled (No. of Patients Included in Analysis) |
|---|---|---|
| Mount Sinai Medical Center, New York, New York | GE Discovery LS 16-slice | 2 (2) |
| Memorial Hospital, Jacksonville, Florida | GE Discovery LS 4-slice | 9 (6) |
| Sacred Heart Hospital, Pensacola, Florida | Siemens Biograph Duo 2-slice | 7 (7) |
| William Beaumont Hospital, Royal Oak, Michigan | GE Discovery LS 16-slice | 9 (6) |
| St. Vincent’s Medical Center, Jacksonville, Florida | Siemens Biograph Duo 2-slice | 1 (0) |
Image acquisition
Patients underwent an 18F-FDG-PET/CT scan on either a General Electric Lightspeed (GE Healthcare, Waukesha, Wisconsin) or Siemens Biograph PET/CT scanner (Siemens Healthcare, Malvern, Pennsylvania) (Table 1) for an estimated effective radiation dose of 10 mSv. All subjects fasted for at least 8 h before the intravenous injection of 370 MBq of 18F-FDG. After a 90-min circulation time, patients underwent PET/CT imaging beginning with a noncontrast CT for attenuation correction and anatomic coregistration. A 90-min circulation time was chosen because previous reproducibility studies of FDG uptake in the femoral arteries was performed using this time frame (13). This method allows for more patient comfort than earlier studies in which up to a 3-h circulation time was used. In addition, PET scanning of the peripheral arteries was then performed in 2-dimensional mode with the inferior border of the imaging field at the patella, and PET scanning of the carotid arteries was performed in 3-dimensional mode using a previously validated acquisition and reconstruction protocol (13,14). Anonymized images from all sites were sent to the core imaging laboratory for reading. In addition, a conventional peripheral angiogram, identifying the plaque for atherectomy, was supplied in all cases for coregistration with the PET/CT images.
Image analysis
PET/CT image analysis was performed at the core laboratory by a reader blinded to all patient demographic characteristics using a Xeleris 2.0 PET/CT workstation (GE Healthcare). Arterial FDG uptake was confirmed in 3 orthogonal planes. The degree of uptake was assessed on every axial image by drawing a region of interest around the artery to obtain the maximum standard uptake value. This value was then corrected for blood pool by dividing by the average standard uptake value in a nearby vein to obtain a tissue-to-background ratio (TBR). For whole artery analysis, the TBRs for all axial images across the entire arterial region were averaged to obtain a single TBR value for that region. To measure the “target” lesion TBR, the plaque of interest was first identified on the angiogram, and the corresponding axial slices on the PET image were identified using anatomic landmarks. Because the TBR for every axial image had previously been recorded, the TBRs for the slices corresponding to the lesion were averaged into 1 target lesion TBR value for comparison with pathology and biomarkers.
Tissue collection and processing
Plaque tissue was excised at atherectomy using the SilverHawk catheter (FoxHollow Technologies, Redwood City, California) by 1 designated cardiologist at each site. Immediately after excision, plaque tissue was rinsed with sterile saline and transferred to cryogenic vials for freezing in liquid nitrogen. For each plaque, its location angiogram was recorded and sent to the core laboratory along with images of the angiogram performed before the procedure. Tissue samples were shipped on dry ice and stored at −80°C until processing.
Frozen plaque tissue samples were homogenized and analyzed using immunohistochemical staining. Although histology was not performed on the excised plaques in this study, an example of histology from a plaque sample obtained using the SilverHawk extraction device is shown in Figure 1. In this study, however, the frozen plaque samples were ground with a mortar and pestle and homogenized with ultrasound-based acoustic disruption (Covaris E200; Covaris, Inc., Woburn, Massachusetts) in phosphate buffer solution with 1% CHAPS (a sulfobetaine-type zwitterionic detergent). After 2 rounds of homogenization followed by centrifugation (3000 rpm for 30 min), the supernatants were combined and mixed, and the resulting plaque extracts were frozen at −80°C until analysis by immunoassay as described in the following text. We have found a strong correlation between cluster of differentiation 68 (CD68) content measured by using immunoassay and the measurement of the area of CD68 staining by using immunohistochemistry (E. Hailman, unpublished data, January 2007), and in the current study macrophage content of the tissue extracts was measured by using a CD68 immunoassay. Quality control samples derived from plaque extracts were included in each run.
Figure 1. Plaque Histology of SilverHawk Atherectomy Specimens.

Representative histology sample of atherosclerotic plaque from a preliminary study extracted by using the SilverHawk technique (FoxHollow Technologies, Redwood City, California) stained with hematoxylin and eosin (H&E), cluster of differentiation 68 (CD68; for macrophages), Elastica-van Gieson ([EVG]; for connective tissue), and Gomori’s Trichrome (for smooth muscle cells [SMC]).
Statistical analysis
Correlations between lesion-specific maximum TBR and CD68 content were assessed using Pearson’s correlation coefficient testing. Correlations between maximum TBR values in different arterial territories were similarly assessed. For analysis of CD68 content, the data were first assessed for normality, and if needed, a log transformation was applied. Pearson correlations were then used to check for associations between TBR and CD68 level. The relationship of TBR in each arterial territory with known cardiovascular risk factors was performed using the unpaired Student t test for categorical variables and Pearson correlations for linear variables. For comparison between peripheral and carotid artery territory FDG uptake, TBRs in the peripheral arteries were pooled and compared with the pooled carotid artery TBRs (with equal weighting for each analyzed slice) using the paired Student t test. For all analyses, p < 0.05 was considered significant.
RESULTS
Thirty patients were enrolled in the study. Nine patients were subsequently excluded from final analysis because of poor PET/CT image quality (n = 4), atherectomy procedures rescheduled outside of the 2-week period after imaging (n = 2), and ineligibility based on inclusion/exclusion criteria (n = 3). Twenty-one patients with complete datasets for the peripheral arteries (femoral imaging, immunohistochemical staining, and biomarkers) were included in the study. The included population was 57% male with a mean ± SD age of 67 ± 10 years. More than 75% of patients had a history of hyperlipidemia, statin use, or coronary artery disease (CAD) (Table 2). Before imaging, subjects had a mean fasting glucose level of 113 ± 27 mg/dl. Imaging of the femoral arteries began a mean of 97 ± 11 min after 18F-FDG injection. Carotid imaging datasets from 6 subjects were excluded because of poor image quality.
Table 2.
Patient Characteristics
| Characteristic | Value |
|---|---|
| Age (yrs) | 67.9 ±9.7 |
| Body mass index (kg/m2) | 28.7 ±3.6 |
| Diabetes | 12 (57) |
| Statin use | 20 (95) |
| Smoking history | 15 (71) |
| Smoking within 90 days | 4 (19) |
| Hyperlipidemia | 19 (90) |
| CAD* | 16 (76) |
| Transient ischemic attack | 9 (43) |
Values are mean ± SD or n (%).
Patients were considered to have a history of coronary artery disease (CAD) if they had a history of myocardial infarction, percutaneous coronary intervention, or coronary artery bypass graft.
A total of 29 specimens were obtained from the 21 patients (range 1 to 3 specimens per patient) with adequate imaging. The lesion-specific TBR was not significantly different from the TBR in the entire artery ipsilateral to the excised lesion. TBR values ranged from 1.02 to 1.51 (mean 1.17 ± 0.16). CD68 values ranged from 0.004 to 13.468 (mean 3.92 ± 3.43). There was no correlation between lesion TBR and lesion CD68 values (r = 0.21) (Figs. 2 and 3).
Figure 2. CD68 Versus TBR.

Correlation of cluster of differentiation 68 (CD68) (after log transformation for normality) and mean of the maximum target-to-background ratios (max TBR) in the excised femoral lesions. CD68 values from the excised lesion as a measure of macrophage content showed no significant correlation to the max TBR values in the lesion (r = 0.21; p > 0.05).
Figure 3. PET/CT Images in Subjects With High Versus Low CD68 Values.
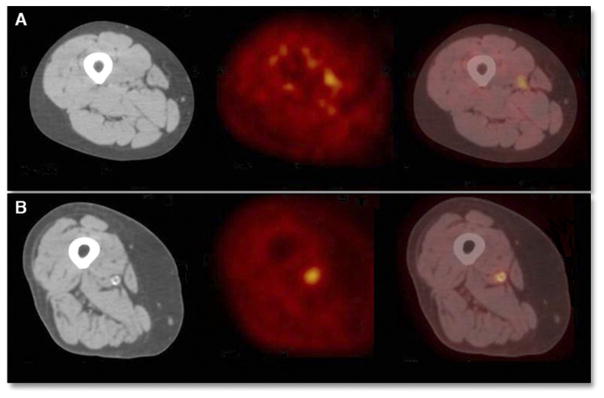
Axial computed tomography (CT), positron emission tomography (PET), and fused PET/CT images are shown from left to right, respectively, in the region of the excised lesion for subjects with (A) a lower cluster of differentiation 68 (CD68) value (CD68 value of 1.08 [about 1 SD below the mean]) and (B) a higher CD68 value (CD68 value of 1.4 [about 1 SD above the mean]). No correlation between CD68 content and mean of the maximum target-to-background ratios (max TBR) in the excised lesions was found (p > 0.05).
Assessing associations between patient sex and TBR values found that the mean TBR in the peripheral arteries was significantly higher in males compared with females (1.31 ± 0.24 vs. 1.14 × 0.09; p < 0.05). This difference in the sexes did not reach statistical significance in the carotid arteries (1.93 ± 0.24 vs. 1.82 ± 0.05; p = 0.35). Comparing TBR values between different arterial regions revealed that the mean carotid artery TBR was 45% higher than the mean peripheral artery TBR (p < 0.05) (Fig. 4). High correlations were observed between right and left arterial TBR values in the femoral (r = 0.95; p < 0.0001) and carotid (r = 0.64; p < 0.05) (Fig. 5) territories.
Figure 4. TBR in Different Arterial Regions.
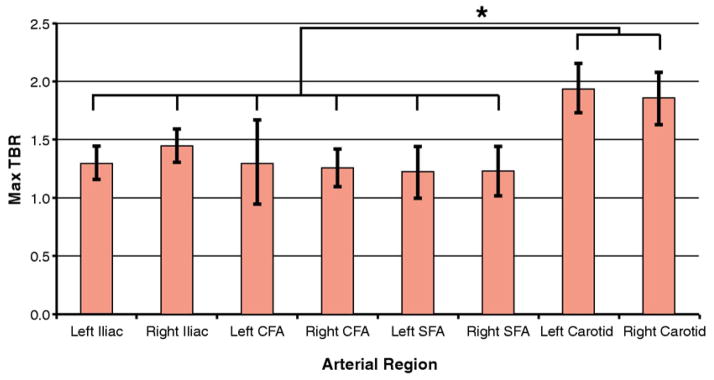
Mean of the max TBR in different arterial regions. Error bars indicate ± 1 SD. Max TBRs of the carotid arteries were significantly higher than the max TBRs in any peripheral region (*p < 0.05). CFA = carotid femoral arteries; SFA = superficial femoral arteries; other abbreviation as in Figure 2.
Figure 5. TBRs of Right Versus Left Arterial Regions.

Correlations of mean of the max TBR in the right versus left (A) SFA and (B) carotid arteries. Significant, high correlations between right and left arteries in these regions demonstrate the global nature of atherosclerotic inflammation. Abbreviations as in Figures 2 and 4.
DISCUSSION
Results from several pre-clinical and clinical studies indicate that FDG accumulates in macrophages of atherosclerotic plaques (3,6,15), with correlations between vascular FDG uptake measurements and quantitative immunohistological measurements of macrophage content of surgically excised carotid plaque (6,7). There are also reports linking carotid FDG uptake with expression of several pro-inflammatory genes expressed in carotid atherosclerosis, including CD68, cathepsin K, and glucose transporter 1 (8,10). However, in our study, significant correlation between FDG uptake and CD68 content of catheter-excised peripheral plaque was not observed. Several factors may explain the lack of concordance between this study and the other studies discussed here. These factors include: 1) the lack of a true link between femoral plaque FDG uptake and macrophage content; 2) unreliable coregistration between PET imaging data and exact location of excised plaque; and 3) variance in the methods of lesion extraction. Additional factors include the multicenter nature of this study, which may have led to variability in reporting of culprit lesion data (marking of the angiogram for the location of index plaque), along with the acquisition of PET/CT studies by different technicians on different types of PET/CT machines. Finally, only 21 of the 30 patients imaged had a complete dataset that could be analyzed (because of poor image quality or failure to meet eligibility criteria, as detailed earlier), all of which may have presented a potential bias.
There are several issues related to the choice of arterial bed that may have had an impact on the correlation analysis. The small size of peripheral arteries will increase the influence of partial volume error as the artery size approaches the innate resolution of PET. The larger size of the carotid arteries would tend to reduce this effect and allow for quantification (16). Additionally, the significant difference in TBR between the peripheral and carotid arteries seen in this study as well as in previous studies (6,7,13) suggests that the degree of inflammation in symptomatic peripheral atherosclerosis is lower than in carotid atherosclerosis. This finding may be due to differences in their pathogenesis: femoral lesions are more likely to be composed of fibrous and calcified material, which accumulates less FDG than lipid-rich, inflamed plaque (17,18). Calcification in the peripheral and carotid arteries was in fact a common finding on the CT images in this study, and previous studies do reveal that inflammation and calcification rarely coexist in the same plaque (5,9). Both the TBR and CD68 values in this study were low in general. Therefore, although several previous studies have shown correlations between FDG uptake and macrophage content in the carotid arteries, the smaller size and lower levels of inflammation in peripheral artery lesions may be 2 biological reasons why such correlations were not apparent in our study.
Difficulty in coregistration of imaging data and histology of the excised plaque could also have contributed to the lack of correlation between lesion-specific TBR and CD68. In the carotid study by Tawakol et al. (6) involving a correlation of FDG signal with macrophage staining, the authors were able to precisely align imaging and histological data. Methodologic aspects of our study precluded such accuracy. Specifically, manually identifying the exact location of the excised lesions on the PET/CT images was difficult, raising the possibility of ascribing the wrong section of artery on PET for analysis. In addition, catheter-based tissue extraction yielded multiple, thin strips of tissue rather than a single intact specimen, limiting our ability to maintain orientation of the tissue sample, which would have allowed more precise alignment with imaging data. In future studies, rigid coregistration of the angiogram and PET/CT datasets would help to resolve this issue, and modifications of the atherectomy procedure might be necessary to provide proper registration of tissue data with imaging data.
Our methods for plaque biomarker measurement were also different from previous FDG-PET studies. Because gross tissue structure cannot be preserved after the SilverHawk procedure, our tissue samples were homogenized, and CD68 was measured by using immunoassay.
Despite these potential sources of variability, several significant findings were seen in this study. The strong correlation between the FDG uptake in the right and left superficial femoral arteries and right and left carotid arteries reinforces the global nature of atherosclerosis. FDG uptake in the peripheral arteries was significantly higher in males than in females, suggesting more inflammation in their atherosclerotic plaques. This finding is consistent with previous work demonstrating that FDG uptake in the carotid arteries is also higher in males than in females (9). These findings may indicate that the degree of plaque inflammation may be a contributor to the known increased cardiovascular risk in males. Because this endpoint involved only the imaging portion of the study, the ability to replicate previous findings in a multicenter study setting is encouraging. The lack of correlation between other cardiovascular risk factors and peripheral artery FDG uptake may be due to the small sample size in many subgroups; in larger studies, significant correlations have been noted between several risk factors and FDG uptake in the carotid arteries (9). In particular, the small sample size (n ≤ 6) of subjects without hyperlipidemia, CAD, and not taking statins will have meant that such analyses were underpowered.
CONCLUSIONS
As the field of atherosclerotic plaque imaging with FDG PET/CT continues to evolve, it is important to identify the challenges and limitations of the technique. Although this study did not find a correlation between FDG uptake in symptomatic peripheral artery atherosclerosis and underlying CD68 content, we did highlight previously unknown challenges posed by imaging peripheral vessels with PET/CT. The importance of accurate image:tissue coregistration was also demonstrated, as imprecision in this study likely contributed to the negative result.
More positively, this study was able to show the feasibility of multicenter PET/CT vascular imaging studies by reproducing several findings previously demonstrated only at expert, single-center imaging facilities. These include noting significantly higher FDG uptake in males compared with females, demonstrating strong correlations in FDG uptake between left and right vessels, and measuring higher FDG uptake in the carotid arteries than in the femoral vessels.
Acknowledgments
This research was funded by the National Institutes of Health/National Heart, Lung and Blood Institute (NIH/NHLBI R01 HL71021, NIH/NHLBI and the Doris Duke Clinical Research Foundation. R01 HL78667, and NIH/NIBIB R01 EB009638 [to Dr. Fayad]) and by unrestricted research grants from Merck Research Laboratories and FoxHollow Technologies. Dr. Myers was supported by the Doris Duke Charitable Foundation and Dr. Rudd by the NIHR Cambridge Biomedical Research Center and an International Fellowship from the British Heart Foundation. Ms. Burke, Ms. Pinto, Mr. Klimas, Mr. Hargreaves, and Dr. Dansky are associated with Merck Research Laboratories. Dr. Hailman and Mr. Bolognese were associated with Merck Research Laboratories during the research study but are currently associated with Novartis Institutes for Biomedical Research Inc. and Cytel Inc., respectively. H. William Strauss, MD, served as Guest Editor for this paper.
The authors acknowledge our collaborators at Mount Sinai Hospital, Memorial Hospital, Sacred Heart Hospital, William-Beaumont Hospital, St. Vincent’s Medical Center, and FoxHollow Technologies.
ABBREVIATIONS AND ACRONYMS
- CAD
coronary artery disease
- CD68
cluster of differentiation 68
- CT
computed tomography
- 18F-FDG
18flourine-fluorodeoxyglucose
- PAD
peripheral artery disease
- PET
positron emission tomography
- TBR
target-to-background ratio
References
- 1.Libby P, Aikawa M. Inflammation in atherosclerosis. Nature. 2002;420:868–74. doi: 10.1038/nature01323. [DOI] [PubMed] [Google Scholar]
- 2.Rudd JH, Myers KS, Sanz J, Fayad ZA. Multimodality imaging of atherosclerosis (magnetic resonance imaging/computed tomography/positron emission tomography-computed tomography) Top Magn Reson Imaging. 2007;18:379–88. doi: 10.1097/rmr.0b013e3181598db0. [DOI] [PubMed] [Google Scholar]
- 3.Rudd JH, Warburton EA, Fryer TD, et al. Imaging atherosclerotic plaque inflammation with [18F]-fluorodeoxyglucose positron emission tomography. Circulation. 2002;105:2708–11. doi: 10.1161/01.cir.0000020548.60110.76. [DOI] [PubMed] [Google Scholar]
- 4.Davies JR, Rudd JH, Fryer TD, et al. Identification of culprit lesions after transient ischemic attack by combined 18F fluorodeoxyglucose positron-emission tomography and high-resolution magnetic resonance imaging. Stroke. 2005;36:2642–7. doi: 10.1161/01.STR.0000190896.67743.b1. [DOI] [PubMed] [Google Scholar]
- 5.Dunphy MP, Freiman A, Larson SM, Strauss HW. Association of vascular 18F-FDG uptake with vascular calcification. J Nucl Med. 2005;46:1278– 84. [PubMed] [Google Scholar]
- 6.Tawakol A, Migrino RQ, Bashian GG, et al. In vivo 18F-fluorode-oxyglucose positron emission tomography imaging provides a noninvasive measure of carotid plaque inflammation in patients. J Am Coll Cardiol. 2006;48:1818–24. doi: 10.1016/j.jacc.2006.05.076. [DOI] [PubMed] [Google Scholar]
- 7.Font MA, Fernandez A, Carvajal A, et al. Imaging of early inflammation in low-to-moderate carotid stenosis by 18-FDG-PET. Front Biosci. 2009;14:3352–60. doi: 10.2741/3457. [DOI] [PubMed] [Google Scholar]
- 8.Graebe M, Pedersen SF, Borgwardt L, Hojgaard L, Sillesen H, Kjaer A. Molecular pathology in vulnerable carotid plaques: correlation with [18]-fluorodeoxyglucose positron emission tomography (FDG-PET) Eur J Vasc Endovasc Surg. 2009;37:714–21. doi: 10.1016/j.ejvs.2008.11.018. [DOI] [PubMed] [Google Scholar]
- 9.Rudd JH, Myers KS, Bansilal S, et al. Relationships among regional arterial inflammation, calcification, risk factors, and biomarkers: a prospective fluorodeoxyglucose positron-emission tomography/computed tomography imaging study. Circ Cardiovasc Imaging. 2009;2:107–15. doi: 10.1161/CIRCIMAGING.108.811752. [DOI] [PMC free article] [PubMed] [Google Scholar]
- 10.Pedersen SF, Graebe M, Fisker Hag AM, Højgaard L, Sillesen H, Kjaer A. Gene expression and 18FDG uptake in atherosclerotic carotid plaques. Nucl Med Commun. 2010;31:432–9. doi: 10.1097/MNM.0b013e32833767e0. [DOI] [PubMed] [Google Scholar]
- 11.American Heart Association. [Accessed June 14, 2011];2009: PAD Quick Facts. Available at: http://www.americanheart.org/presenter.jhtml?identifier=3020248.
- 12.Hirsch AT, Haskal ZJ, Hertzer NR, et al. ACC/AHA guidelines for the management of patients with peripheral arterial disease (lower extremity, renal, mesenteric, and abdominal aortic): a collaborative report from the American Associations for Vascular Surgery/Society for Vascular Surgery, Society for Cardiovascular Angiography and Interventions, Society for Vascular Medicine and Biology, Society of Interventional Radiology, and the ACC/AHA Task Force on Practice Guidelines (writing committee to develop guidelines for the management of patients with peripheral arterial disease)—summary of recommendations. J Am Coll Cardiol. 2006;47:1239–312. doi: 10.1016/j.jacc.2005.10.009. [DOI] [PubMed] [Google Scholar]
- 13.Rudd JH, Myers KS, Bansilal S, et al. Atherosclerosis inflammation imaging with 18F-FDG PET: carotid, iliac, and femoral uptake reproducibility, quantification methods, and recommendations. J Nucl Med. 2008;49:871–8. doi: 10.2967/jnumed.107.050294. [DOI] [PubMed] [Google Scholar]
- 14.Rudd JH, Myers KS, Bansilal S, et al. (18)Fluorodeoxyglucose positron emission tomography imaging of atherosclerotic plaque inflammation is highly reproducible: implications for atherosclerosis therapy trials. J Am Coll Cardiol. 2007;50:892–6. doi: 10.1016/j.jacc.2007.05.024. [DOI] [PubMed] [Google Scholar]
- 15.Tawakol A, Migrino RQ, Hoffmann U, et al. Noninvasive in vivo measurement of vascular inflammation with F-18 fluorodeoxyglucose positron emission tomography. J Nucl Cardiol. 2005;12:294–301. doi: 10.1016/j.nuclcard.2005.03.002. [DOI] [PubMed] [Google Scholar]
- 16.Izquierdo-Garcia D, Davies JR, Graves MJ, et al. Comparison of methods for magnetic resonance-guided [18-F]fluorodeoxyglucose positron emission tomography in human carotid arteries: reproducibility, partial volume correction, and correlation between methods. Stroke. 2009;40:86–93. doi: 10.1161/STROKEAHA.108.521393. [DOI] [PubMed] [Google Scholar]
- 17.Bishop PD, Feiten LE, Ouriel K, et al. Arterial calcification increases in distal arteries in patients with peripheral arterial disease. Ann Vasc Surg. 2008;22:799–805. doi: 10.1016/j.avsg.2008.04.008. [DOI] [PMC free article] [PubMed] [Google Scholar]
- 18.Silvera SS, Aidi HE, Rudd JH, et al. Multimodality imaging of atherosclerotic plaque activity and composition using FDG-PET/CT and MRI in carotid and femoral arteries. Atherosclerosis. 2009;207:139–43. doi: 10.1016/j.atherosclerosis.2009.04.023. [DOI] [PMC free article] [PubMed] [Google Scholar]