

SUMMARY
High-throughput operant conditioning systems for rodents provide efficient training on sophisticated behavioral tasks. Combining these systems with technologies for cellular resolution functional imaging would provide a powerful approach to study neural dynamics during behavior. Here we describe an integrated two-photon microscope and behavioral apparatus that allows cellular resolution functional imaging of cortical regions during epochs of voluntary head restraint. Rats were trained to initiate periods of restraint up to 8 seconds in duration, which provided the mechanical stability necessary for in vivo imaging while allowing free movement between behavioral trials. A mechanical registration system repositioned the head to within a few microns, allowing the same neuronal populations to be imaged on each trial. In proof-of-principle experiments, calcium dependent fluorescence transients were recorded from GCaMP-labeled cortical neurons. In contrast to previous methods for head restraint, this system can also be incorporated into high-throughput operant conditioning systems.
INTRODUCTION
The recently developed capacity to optically image neural activity at cellular resolution in behaving animals has the potential to transform the study of neural circuits underlying behavior. Two-photon laser-scanning microscopy (TPM) (Denk et al., 1990), in combination with genetically encoded calcium indicators, has been used to image the activity of hundreds of simultaneously recorded individual neurons in behaving animals. The recordings are unbiased in the sense that the entirety of the neuronal population within the field of view is imaged and recorded from. Vascular landmarks and the stable relative positioning of neuronal somata allow the same neurons to be recorded on successive days, which is difficult to verify with microelectrode recording. Using cellular-resolution function imaging, choice-specific sequences of neural activity have recently been measured during a two-alternative forced choice navigation task (Harvey et al., 2012); also, the plasticity of the neural representation of sensory stimuli and movement has been studied over the course of learning (Huber et al., 2012).
In mammals, cellular resolution functional imaging during behavior has been primarily applied to mice. However, rats are the most widely studied species in behavioral research and in neurophysiology (Aitman et al., 2008; Dwinell, 2010), and can be efficiently trained in tasks that require cognitive abilities, such as working memory. Recent developments in rat genetics have led to the ability to engineer the rat genome with unprecedented efficiency (Geurts et al., 2009; Huang et al., 2011; Tesson et al., 2011) and to the production of genetically modified rat strains for basic neuroscience research (Witten et al., 2011) as well as new genetic models of human neurological disorders such as schizophrenia and autism (Dolgin, 2010). Together, these trends suggest the rat as an attractive model species to study cognitive processes, and motivate efforts to adapt the new cellular resolution imaging methods to this species.
One of the most widely used experimental tools for behavioral analysis in rodents is the operant conditioning chamber. A recent technical advance is to use these chambers in computer controlled systems for high-throughput training. Using this approach, many rodents can be trained in parallel, with animals placed in the automated training chambers either by husbandry staff blind to the experiment being performed (Erlich et al., 2011; Brunton et al. 2013), or by computer-controlled gates and passageways (Winter and Schaefers, 2011). High-throughput systems facilitate training in complex behavioral tasks that require long training times, provide statistics difficult to achieve in small-scale studies, and can generate a ready source of animals for perturbation experiments or neurophysiological recording.
Inspired by previous reports that rats could be trained to self head-fix (Kampff et al., 2010;Girman 1980; Girman 1985), we developed a behavioral apparatus for automated voluntary head restraint during each trial of operant learning tasks. Our approach was based upon the development of a mechanical registration system that allowed the rat’s head to be reliably repositioned to within a few microns each time it was activated. We then combined the voluntary head restraint system with a two-photon microscope. This enabled in vivo cellular resolution imaging of the same population of neurons across multiple head restraint periods throughout a training session and over multiple days. All essential functions of the two-photon microscope and behavioral system, including movement of the objective, delivery of immersion fluid and presentation of sensory stimuli, were robotically controlled by signals from an open-sourced behavioral training system (Bcontrol) used for high-throughput operant conditioning (Erlich et al., 2011; Brunton et al 2013). A custom training algorithm, which was implemented using Bcontrol software, allowed rats to progress through a series of training stages without human involvement. Once rats were trained, functional imaging began. Calcium-dependent fluorescence transients in neurons labeled with the genetically-encoded calcium sensors GCaMP3 (Tian et al., 2009) and GCaMP6s (Chen et al., 2013) were recorded using TPM. Trained rats performed hundreds of fixation trials per day and registration brought the same neurons into the objective field of view on each trial. Proof-of-principle experiments were conducted using this system to characterize responses in the visual cortex in awake, behaving rats. Our results demonstrate that in vivo imaging during voluntary head restraint facilitates the study of cortical dynamics at cellular resolution during a variety of operant behaviors.
RESULTS
Design of an implantable, miniature kinematic registration system
Our approach was based upon the development of a clamp for head immobilization and precise repositioning. This clamp was incorporated as part of a nose poke in an operant conditioning chamber and could be activated by the animal in exchange for water reward. A critical feature of the clamp was that it should allow the brain to be returned to the exact same location in space (to within a few microns) each time it was activated. To accomplish this, we designed a headplate and associated clamp based on the principles of kinematic mounts that are widely used in optical instrumentation (Figure 1A). Kinematic mounts achieve precisely repeatable repositioning by independently constraining each of the 3 directions (X,Y,Z) and 3 rotations (yaw, pitch roll) of object movement. In our implementation, a titanium headplate containing a conical depression and a V groove on one surface was designed to mate with two stainless steel ball bearings mounted on pneumatic pistons (Figure 1B). The pistons were housed in an aluminum frame (headport) that contained a slot for easy entry of the headplate, as well as a space for the rat’s head and forepaws to rest (Figure 1C,D). Also mounted on the headport were two low-force, miniature snap action switches (contact sensors) that were used to detect the position of the headplate and trigger piston deployment. The interior of the slot in the headport was designed with a complementary shape to the headplate in order to help guide the headplate toward the contact sensors and to provide an initial, millimeter-scale registration required for the kinematic clamp to properly engage and finish the alignment process, producing precise, micron-scale registration (Figure 1E).
Figure 1. Design of a kinematic clamp and implantable kinematic headplate capable of precise mechanical registration.
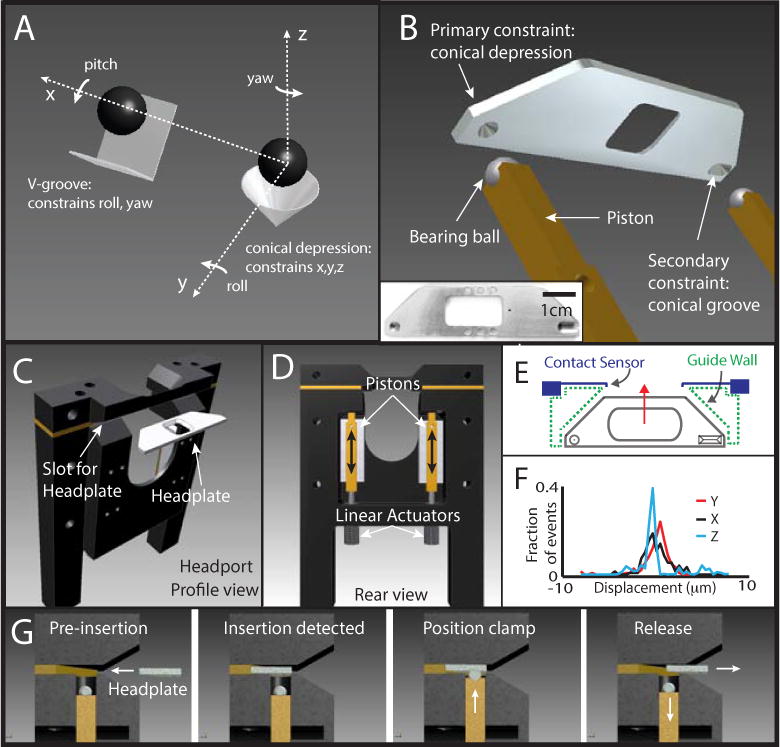
(A) Diagram illustrating the principle of kinematic mounts in which a conical depression and V groove are used to constrain the position of two spheres. This design eliminates redundant physical constraints, which can interfere with accurate registration, and fully constrains five of the six degrees of freedom (x,y,z, roll and yaw). (B) Illustration of a miniature kinematic mount, composed of a surgically implantable headplate containing a conical depression and a V groove designed to mate with two spherical bearing balls mounted on pistons. Pitch is constrained by the interaction of the top flat surface of the headplate with the ceiling of the interior of the headplate slot, preventing rotation around the ball bearing when the clamp is engaged. Left Inset: Photograph of a titanium headplate that was constructed based on this kinematic headplate design. The headplate contains an aperture in the center to allow optical access to the animal’s head for in vivo imaging experiments. (C) Illustration of a headport that was designed to house the pistons and provides a slot that guides the headplate to the position above the pistons. (D) Rear view of the headport shown in C indicating the location of the pistons and the pneumatic linear actuators that drive them. Black arrows indicate the axis of movement of the pistons when the kinematic clamp is activated and deactivated. (E) Diagram of a top down, cut away view of the headplate (solid gray lines), headplate slot (dashed green lines) and the contact sensors (solid blue lines). The movement of the headplate during insertion is indicated by the red arrow. The walls of the headplate slot help guide the headplate toward the contact sensors and provide crude alignment of the conical depression and V groove with the piston-mounted spheres. (F) Performance of the miniature kinematic mount measured manually. The displacement of the kinematic headplate relative to a reference position along the Y-axis (red), X-axis (black) and Z-axis (blue) is indicated. (G) Illustration of the steps starting from leftmost panel, involved in the function of the kinematic clamp. Pre-insertion: a headplate approaches the slot in the headport. Insertion detected: the position of the headplate is detected by the contact sensors mounted on the headport. Position clamp: actuation of pneumatic cylinders drives the pistons into the headplate. Interaction between the spherical ball bearings and the conical depression and V groove, constrains the position of the headplate. Release: Following a signal for the termination of the clamp, the pistons withdraw allowing the headplate to be removed from the slot in the headport.
Registration accuracy for the kinematic clamp was measured by manually inserting a headplate, actuating the pistons, imaging a patterned fluorescent sample mounted on the kinematic headplate, releasing the clamp and iterating this process. Displacement in the focal plane (X and Y dimension) was calculated by performing 2D cross-correlation between a reference image and the image taken at each insertion, and identifying the X and Y translations that produced the peak correlation value. Displacement in the Z-axis was calculated by comparing the peak correlation value of the 2D cross-correlation across a Z-stack series of reference images acquired at regular intervals throughout the depth of the fluorescence sample. Root mean square displacement between successive images was 1.6μm in the medial lateral (X) dimension, 1.9μm in the anterior posterior (Y) dimension and 2.7μm in the dorsal ventral (Z) dimension (Figure 1F). The displacements in X and Y are small enough to be corrected offline using established image registration algorithms (Dombeck et al., 2007), and the Z displacement is modest compared to both the typical axial dimension of the point spread function for in vivo TPM, and the diameter of a cell body. These data therefore suggested that kinematic mounts can, in principle, provide sufficient registration accuracy for cellular resolution imaging of the same neuronal population across multiple behavioral trials.
Development of an operant conditioning procedure for voluntary head restraint
A testing apparatus and associated training procedure were developed in order to determine if rats would learn to operate the kinematic clamp and whether they would be willing to head restrain themselves for water reward. Rats (n=22) were surgically implanted with kinematic headplates (Figure 2A) and the kinematic clamp and headport were installed into operant conditioning chambers (Figure 2B,C; (Uchida and Mainen, 2003)). After recovery from surgery, rats were placed on a schedule in which their access to water was limited to the behavioral training session and an additional ad lib period, up to 1-hour in duration, following training. Rats were trained to head-fix using three training stages (Figure 2 D–F).
Figure 2. Stages in voluntary head-restraint training.
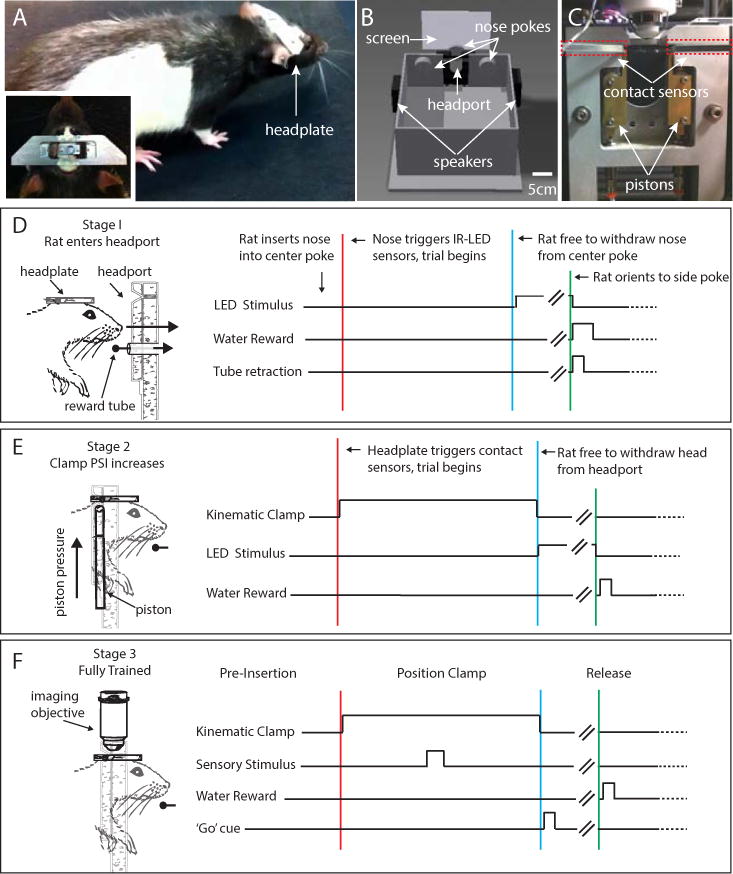
(A) Photograph of a rat that has been surgically implanted with the kinematic headplate. Inset: dorsal view of the headplate mounted on the rat’s head. (B) Illustration of an operant chamber used to train rats in voluntary head restraint. The chamber contains three nose pokes that can deliver water reward. Each nose poke also contains an infrared LED and sensor to detect insertion of the rat’s nose, and a visible LED to provide visual cues. To access the center nose poke, the animal must insert its head into the central headport that contains the mechanical registration system. The behavioral chamber also contains a back projection screen for the presentation of visual stimuli, as well as speakers mounted on the left and right chamber walls for auditory stimuli. (C) Photograph showing a rear view of the headport as installed in the wall of the behavioral chamber. Locations of the pistons are indicated by white arrows and positions of the arms of the contact sensors are indicated by white arrows and are surrounded by dashed red lines. (D–F) Illustration showing the stages in voluntary head restraint training. (D) Stage 1: During exploration of the behavioral chamber rats spontaneously insert their nose into the center nose poke, breaking an infrared beam, which triggers delivery of a water reward. Once the rat has learned to associate nose pokes with reward, on each successful trial, the center nose poke gradually moves further away from the center of the behavioral chamber. Left: Drawing indicating the movement of the center port further away from the animal. In order to continue to reach the reward, the rat must insert its head into an aperture in the headport while sliding its headplate further into the headplate slot. Right: Timing of events during a stage 1 behavioral trial. Stage 1 ends when the rat inserts its head far enough into the headport so that the leading edge of the headplate touches contact sensors in the headplate slot. (E) Stage 2: Rat acclimates to the kinematic clamp. Left: Drawing indicating the movement of the pistons during the beginning of the trial and the position of the rat head and headplate relative to the headport during restraint. Right: Timing of events during a stage 2 behavioral trial. Pistons are deployed when the contact sensors are activated (red line). Piston pressure is low and gradually increases over trials. The rat receives water reward after maintaining contact between the headplate and contact sensors in the headplate slot for a set duration. Withdrawal of the headplate from the slot before the end of the fixation period (blue line) leads to termination of the behavioral trial and a ‘time-out’ period when no water can be obtained. Right: (F) Stage 3. Once the rat has acclimated to full piston pressure and can maintain restraint for the desired duration, in vivo imaging can begin. Left: Drawing indicating the relative position of the rat head, headplate, imaging objective and headport. Right: Timing of events during a stage 3 behavioral trial. In this example, rats perform a two-alternative choice task in which the stimulus is presented during the head-fixation period.
In the first stage (Figure 2D), rats learned to initiate behavioral trials by inserting their nose into the center nose poke in the training chamber. Nose position was detected by an infrared LED and sensor mounted in the center nose poke. Initially, rats would spontaneously insert their noses into the nose poke during natural exploration of the behavioral chamber, and this behavior was re-enforced by delivery of a water reward (typically 12 – 24 μl). Each session, the center nose poke, which was mounted on a linear translation stage, was moved further away from the center of the behavior box, thus shaping the rat’s behavior toward inserting its headplate further into the headplate slot to initiate a behavioral trial. Once a rat inserted its head far enough into the headport so that its headplate touched the contact sensors that trigger the kinematic clamp (~40 mm depending on the implantation coordinates of the headplate) the animal was transitioned to the second training stage.
In the second stage (Figure 2E), rats initiated trials by contacting the anterior edge of the headplate with the spring-loaded arms of the contact sensors mounted on the kinematic clamp. Simultaneous depression of both left and right sensor arms guaranteed an initial millimeter-scale alignment, and was used as the signal to trigger deployment of the clamp. To acclimate the rat to voluntary head restraint, clamp piston pressure was gradually increased over trials. If the rat terminated the trial early by removing the headplate before the clamp was released, a time-out period (2–8 seconds) during which no reward could be obtained was imposed. If the head restraint was completed successfully, a water reward was available at either the right or left nose poke. The location of this additional reward was randomized trial-to-trial and was indicated by the illumination of an LED located on the reward baited nose poke. Rats were considered fully trained (stage 3) when they had acclimated to the pressure required to fully activate the kinematic clamp (air pressure = 25 PSI). At this pressure, rats were no longer physically able to remove the headplate from an activated clamp.
A key factor for reliable voluntary head-fixation training is to prevent animals from associating the headport with long aversive involuntary restraint. One solution to minimizing such events is to keep head restraint periods short (<1s). A second solution, which we used for head restraint periods of up to 8 seconds, was to deliver intermittent water rewards (0.5–1hz) during head restraint. A third solution, which we used for 6-second long head restraint periods without intermittent water reward, was to provide a rat-activated release switch. We observed that rats pushed on the floor of the cage when they attempted to withdraw their head from the headport. In this approach, the floor of the cage was mounted on a low-friction linear slide with a 2.5 mm travel. Movement of the floor toward the kinematic clamp, caused by the animal pushing with its hind legs, would depress a 1.67 N force snap action switch, which was used to trigger release of the clamp. The release switch appeared to be successful in preventing aversion to the clamp and allowed successful training for long head restraint periods: in sessions with 6 second long head restraint periods and without any water rewards during head restraint, an average of less than one trial per session was aborted by early release.
To determine if the voluntary head restraint system could be used with newly developed methods for high-throughput behavioral training, a second generation, fully automated, head restraining system was incorporated into a semi-automated rat training facility (Erlich et al 2011, Brunton et al 2013.). In this facility, rats are placed into operant chambers for a 1.5–2 hour behavioral training session by husbandry staff blind to the experiment being performed. During the behavioral training session, fully automated custom software controls the progression of rats across the stages of training. At the end of the session, the rat is removed from the chamber and is replaced by the next rat to be trained. In this way 6–9 rats per box can be trained daily while husbandry staff monitor the rats’ health and weights, and provide food and supplementary water. Human intervention is required only for animal transport and husbandry, allowing the facility to be readily scaled to many automated boxes running in parallel.
To automate training stage 1, the center nose poke was mounted on a linear translation stage driven by a stepper motor driver and robotically controlled by signals from a computer running behavioral training software. After each successful trial the nose poke was moved 200 μm away from the inside of the chamber. To automate training stage 2, piston pressure was provided by a voltage-controlled pneumatic regulator, which was in turn controlled by the behavioral training software. Computer control over piston pressure enabled the gradual ramping increase of piston pressure at the beginning of each head restraint trial. This prevented loud noises or jerking movements during piston deployment, which facilitated rapid acclimation of rats to the kinematic clamp.
Behavioral performance during voluntary head restraint
A total of 21/22 rats successfully learned to perform voluntary head restraint. Rats learned to operate the kinematic clamp in as little as 7 days and performed up to 900 trials per day. A variety of tasks were used to characterize different aspects of voluntary head restraint behavior (Table S1).
To evaluate the long-term reliability of the head restraint system, 5 rats performing 7-second long head fixations for intermittent water rewards during fixation were monitored over a 20-week period (Figure 3). Minimal experimenter intervention was required, and consisted of routine maintenance of the apparatus every 2 weeks. Five rats reliably performed 110+/−48 trials per day (Figure 3F) over the 20-week period.
Figure 3. Behavioral performance during voluntary restraint.

(A–C) Series of photographs of a trained rat performing 3 steps of a single voluntary head restraint trial. (A) Pre-insertion: The rat is motivated by water reward to approach the headport. (B) Position clamp: After insertion of the head into the headport, the rat activates the kinematic clamp by touching contact sensors with the headplate. (C) Release: Following a termination signal, the headplate is released from the clamp, the rat withdraws its head from the headport and is free to orient to the left or right nose poke for water reward. (D) Diagram indicating the timing of behaviorally relevant events during one type of voluntary head-restraint trial. In this behavioral task rats are presented with either visual or auditory stimuli that provide information about which side nose poke (left or right) will provide water reward following release from head restraint. (E) Changes in voluntary head restraint behavior during learning. During stage 1 (blue line), rats maintained nose contact with the infrared sensor for short durations. During stage 2 (red line), rats gradually increased the frequency of trials in which their headplate maintains contact with contact sensors for the entire duration of the trials (7–8 seconds). During stage 3 (black line) rats reliably maintain head restraint for the entire trial duration (here 7 seconds). (F) Mean number of successful head restraint trials performed per day by 5 rats during stage III. Rats displayed consistent performance on the behavioral paradigm illustrated in 3D for 20 weeks. Error bars indicate standard error of the mean. See also Figure S1 and Table S1.
To verify that rats could learn to perform voluntary head restraint in an automated fashion, the high-throughput facility was used to train 6 rats to initiate a behavioral trial and maintain fixation for 0.6s. After the termination of fixation, an LED on the left or right side was illuminated to indicate the location of a water reward. Computer-controlled gradual ramping of piston pressure was used with these rats. Remarkably, by increasing the piston pressure gradually over 50 trials, all 6 rats acclimated to head restraint within a single session. To increase motivation, no additional water was given after behavioral training. Fully trained rats in this behavioral paradigm performed 510 +/−180 head-fixation trials per session.
To determine whether rats could perform a sensory discrimination task in which the sensory stimulus was provided during voluntary head restraint, we trained two rats in a visual version of memory guided orienting (Erlich et al. 2011). A visual cue (100 ms flash presented to the left or right visual field) was presented 500 ms after the initiation of head restraint, and indicated the location of a later water reward. Restraint continued for a further 500 ms memory delay period, after which the end of restraint was signaled by clamp release and an auditory ‘Go’ cue (Figure 2F). Nose insertions into the side poke located on the same side as the earlier visual cue resulted in a water reward (24μl) while responses to the opposite side resulted in a timeout. After completing initial head restraint training (stages 1 & 2), 2/2 rats learned this task in 12 sessions, performing 362+/− 82 trials per session at 97+/− 2% correct.
In sum, rats can operate the voluntary head restraint system reliably over long periods of time, they can be trained to operate the restraint system in an automated facility, and they can be readily trained to perform sensory discrimination tasks during head restraint. These behavioral data encouraged us to combine two-photon microscopy with voluntary head restraint.
Design of an apparatus for in vivo imaging during voluntary head restraint
An automated two-photon laser-scanning microscope (TPM) was developed for cellular resolution imaging during the period of voluntary head restraint (Figure S1). Once the rat initiated head restraint, behavioral control software triggered the opening of the laser shutter and the acquisition of the TPM. We used two different types of objectives, with complementary advantages and disadvantages. Fluid immersion objectives allowed higher numerical apertures, but required delivery and removal of fluid at the beginning and end of each head fixation period. Imaging could not be carried out during the process of fluid delivery or removal (~500 ms each). In contrast, air objectives have lower numerical apertures, but allowed imaging to continue until the end of head restraint on each trial. Both types of objectives allow high quality cellular resolution functional imaging.
For experiments with fluid immersion objectives, we developed an automated immersion fluid delivery and removal system (Figure 4A). This system consisted of two thin tubes, one for delivery, connected to an immersion fluid reservoir, and one for suction, connected to a vacuum pump. A custom collar mounted on the objective barrel positioned the openings of the tubes at the gap between the imaging region and the face of the objective. To discourage the use of this fluid as a water-reward source, 5–10 mM quinine was used instead of distilled water. Timing of the addition and removal of immersion fluid with each insertion was controlled by solenoid valves, which received commands from behavioral software (Figure 5A). Addition of the immersion fluid began at the initiation of head-restraint and lasted 400ms. Fluid removal began 400ms before the end of head-fixation, concomitant with the end of image acquisition for that trial.
Figure 4. Development of a system for imaging of GCaMP-labeled neurons in voluntarily head restrained rats.

(A) Photograph of the imaging objective and the automated immersion fluid delivery and removal system used for experiments with the fluid immersion objectives. A custom collar mounted on the objective barrel holds the dispenser tube and the vacuum tube in position such that the tips of both tubes are located at the face of the imaging objective. Inset: bottom view of the imaging objective and automated fluid system. (B) Diagram of the rat’s head in cross-sectional view (coronal perspective) illustrating relative position of structures related to in vivo imaging of GCaMP3-labeled neurons in the medial agranular cortex (AGm). Inset: Illustration of the optical window used for in vivo imaging. (C) Illustration of a rat skull with a small dashed circle indicating the position of the optical window implanted over AGm. A photograph of the cortical region that lies below the 3mm diameter optical window is shown to the right of the skull illustration. (D) Image of GCaMP3-labeled neurons in layer II/III of the rat AGm obtained by in vivo two-photon microscopy. See also Figure S2.
Figure 5. Measurement of brain registration and motion during voluntary head restraint.
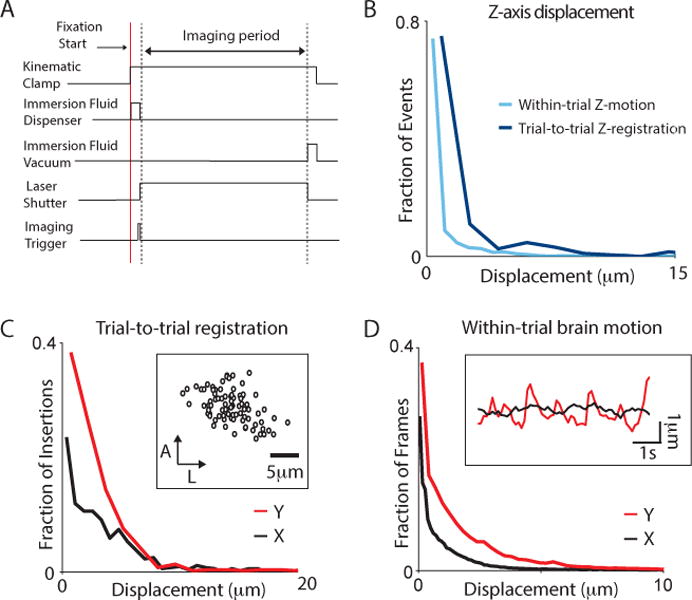
(A) Diagram of the timing of events related to in vivo imaging during voluntary head restraint. All events are synchronized to the start of voluntary fixation (red line) triggered by the animal. After a pre-imaging initialization period determined by the amount of time required for the actuation of the kinematic clamp, delivery of the immersion fluid and movement of the imaging objective, TPM acquisition is triggered to begin. TPM acquisition is terminated before the removal of the immersion fluid and the release of the kinematic clamp. (B) Histogram of displacements perpendicular to the imaging plane (Z-axis) during voluntary head restraint in 2 rats. Within-trial image displacement caused by brain motion is shown in light blue, across-trial displacement caused by registration is shown in dark blue. (C) Histogram of trial-to-trial displacement along the anterior-posterior (Y) dimension (red) and the mediolateral (X) dimension (black) for 6 rats. Inset: scatter plot where each marker indicates the displacement of the brain relative to a reference position on each trial for one rat in one imaging session. (D) Histogram of within-trial image displacement caused by brain motion along the AP dimension (Y) and the ML dimension (X) for 6 rats. Inset: Time course of brain motion during a single trial. Note the periodic motion along the AP dimension in this trial. Timing of displacements in this dimension was correlated with the time of reward delivery. See also Figure S3.
An aperture (0.9 cm by 1.5 cm) in the center of the headplate allowed access to the skull and could accommodate the implantation of an optical window that allowed optical access to the brain. The optical window was designed based on an implantable optical device previously used to perform in vivo cellular resolution imaging in mice with minimal brain motion over long periods of time (Figure 4B; Dombeck et al., 2010). It consisted of a 150 μm thick, 3.5mm diameter circular cover glass that was bonded to a short 9-gauge stainless steel ring using optical adhesive. The height of the ring was designed to match the thickness of the rat skull over the imaging region. In experiments targeting the medial agranular cortex (AGm), the height of the ring was 400μm, whereas in experiments targeting the visual cortex (V1) the height was 800μm. To increase mechanical stability during imaging, the optical window was designed to depress the cortical surface by ~150μm below the bottom of the skull when fully implanted (Dombeck et al., 2007).
Given the working distance of the imaging objectives (3.3 mm for water, 4.0 mm for air) relative to the combined thickness of the headplate (1.65 mm) and rat skull (0.4–0.8 mm), it became necessary in some cases to move the objective out of the way, prior to the insertion of the headplate on each trial, to prevent the headplate from hitting, and potentially damaging, the objective. This was accomplished using a movable objective microscope in which the objective is mounted on a stage capable of motorized translation in X, Y and Z. Commands from the behavioral control computer synchronized the robotic movements of the objective stage with voluntary head-restraint to move the objective into imaging position with each insertion. Using this approach, the objective could be held at a safe position (typically 1mm) above the imaging position, then lowered to the imaging position during restraint and finally retracted to the safe position prior to release of the kinematic clamp.
Quantification of brain motion in voluntarily head restrained rats
A necessary criterion for successful in vivo imaging is that brain motion artifacts are small enough so they are addressable through software (Dombeck et al. 2007). To quantify the performance of this aspect of the combined microscope and head restraint apparatus, across-trial registration and within-trial brain motion was measured during voluntary head restraint in 8 trained rats by imaging GCaMP-labeled neurons in AGm (6 rats) or V1 (2 rats) through an implanted optical window (Figure 4C, see Methods). Prior to implantation of the window, the dura was removed and AAV-GCaMP3 (AGm) or AAV-GCaMP6s (V1) was injected into layer II/III of the exposed cortical region.
One to four weeks after implantation of the optical window, GCaMP fluorescence was observed in the peri-nuclear somata and processes of neurons (Figure 4D). For analysis of brain motion, images of GCaMP-labeled neurons were acquired at a rate of 10 Hz over a 6–8-second head restraint period (Figure 5). Motion correlated with the activation of the kinematic clamp limited visibility during the first few hundred milliseconds of the behavioral trial, delaying the start of the effective imaging period until approximately 600ms after the initiation of head restraint (Figure 5A). In addition, when an immersion fluid objective was employed, optical distortions caused by the removal of immersion fluid prevented image acquisition in the last 500ms of the head-restraint trial.
In vivo trial-to-trial displacement (4.7 μm in X, 8.4 μm in Y, 3.5 μm in Z Figure 5B,C and S3) was slightly larger than that measured by manual insertion of an isolated headplate. In most cases these registration errors could be corrected by offline image registration algorithms (see Methods). However, on a subset of trials in which the immersion objective was used (10.0+/−11.5%, n=13/130 trials), no visible image was produced. This problem was caused by loss of imaging fluid, the formation of bubbles in the imaging fluid or by movements of the rat’s head after it had triggered a behavioral trial, but before the kinematic clamp was fully engaged. Nevertheless, because of the large number of trials performed per day, the loss of 10% of imaging did not significantly impact the utility of the immersion objective. With an air objective, typically no trials were lost during an imaging session.
Within-trial brain motion (RMS displacement = 2.5μm in X, 4.3μm in Y, 2.3 μm in Z, Figure 5B & D) was similar to previously reported values for awake, behaving mice (Dombeck et al., 2007) and could be corrected off-line with motion correction algorithms (see Methods). Brain motion was highest at the beginning and ending of the behavioral trial and in some animals, small amplitude brain motion along the anterior posterior axis was repeatedly observed following the regular delivery of water rewards within the trial.
Cellular resolution calcium imaging in rat V1 using genetically encoded indicators
Our initial imaging experiments, described above, suggested that the combined two-photon microscope and voluntary head restraint apparatus could be used to reliably image the same neurons within a field of view throughout a training session with minimal disruption due to brain motion. These experiments also revealed fluorescence changes in GCaMP-labeled neurons (Figure S2) that could reflect neuronal dynamics associated with behavior. However, the GCaMP series of indicators has not been previously used to measure calcium transients in vivo in rats. Therefore we decided to evaluate the use of GCaMP3 and GCaMP6s as a reporter of neuronal activation by measuring orientation tuning of neurons in V1. Responses of V1 neurons to oriented, drifting gratings have been previously studied in the rat using synthetic calcium indicators (Ohki et al., 2005) as well as microelectrodes (Girman et al., 1999; Parnavelas et al., 1981), providing multiple points of comparison for our system. GCaMP3 was selected to provide comparison with previous measurements of orientation tuning in V1 in mouse (Akerboom et al. 2012), while GCaMP6s was selected due to its high sensitivity (Chen et al. 2013).
Visually evoked responses were measured in layer II/III V1 neurons labeled with GCaMP3 (49 cells, 2 rats) or GCaMP6s (113 cells, 2 rats) during voluntary head restraint (Movie S1). In order to characterize direction and orientation tuning of GCaMP-labeled neurons, large field, drifting sinusoidal gratings at 8 different orientations were presented to the eye contra-lateral to the imaged V1. Across both GCamP3 and GCaMP6s experiments, a subset of layer II/III neurons (54/162) exhibited significant fluorescence transients following the presentation of the drifting grating stimulus (Figure 6,7; ANOVA p<0.01, see methods). A higher proportion of GCaMP6s-labeled neurons were visually responsive (49/113) compared to GCaMP3-labeld neurons (5/49) (Figure S4). Visually responsive neurons were tuned for stimulus direction (mean DSI = 0.62) (Figure 6D) and orientation (mean OSI = 0.72) (Figure 7G). Repositioning allowed automated tracking of neuronal populations across multiple trials in the same imaging session (Figure 6A) and assisted in tracking neurons across multiple days (Figure S5). These data are qualitatively consistent with previous in vivo imaging experiments in rats and mice and indicate that TPM imaging of GCaMP fluorescence transients can be used to measure the temporal response and feature selectivity of layer II/III cortical neurons during voluntary head restraint.
Figure 6. Detection of calcium dependent fluorescence transients during voluntary head restraint.

(A) In vivo imaging of GCaMP3-labeled cortical neurons across multiple voluntary head restraint trials. Each of the four vertically organized panels illustrates data collected from a different example trial. During the inter-trial period the animal removed its head from the headport and was required to re-insert to begin a new trial. Upper section: Images of GCaMP3-labeled neurons in V1 acquired by two-photon microscopy using a water immersion objective. Images shown have not been corrected for registration in order to demonstrate the accuracy of repositioning of the kinematic clamp. Lower section: Fluorescence transients from a selected neuron (white arrow, upper section) during each example trial. On each example trial, one of eight visual stimuli, oriented drifting gratings, was presented. The orientation and direction of motion of the visual stimuli presented during the four example trials shown is indicated in the upper right corner of each panel. The time of the visual stimulus presentation is indicated by a blue line. (B) Response of the neuron identified in A across multiple trials. During each trial a randomly chosen stimulus direction is presented beginning at time = 1 second. Color indicates the change in the fluorescence intensity over time (X-axis) and across trials (Y-axis). (C) Mean response of the neuron in A across all trials (black line), stimulus presentation period is indicated in gray. (D) Direction tuning of the neuron identified in A. Black maker indicates the mean response to each direction of motion. Error bars indicated standard error of the mean. Red line is a fit of the data to the sum to two gaussians. See also Figure S5 and Movie S1.
Figure 7. Visually evoked responses in GCaMP6s-labeled neurons in V1 during voluntary head restraint.
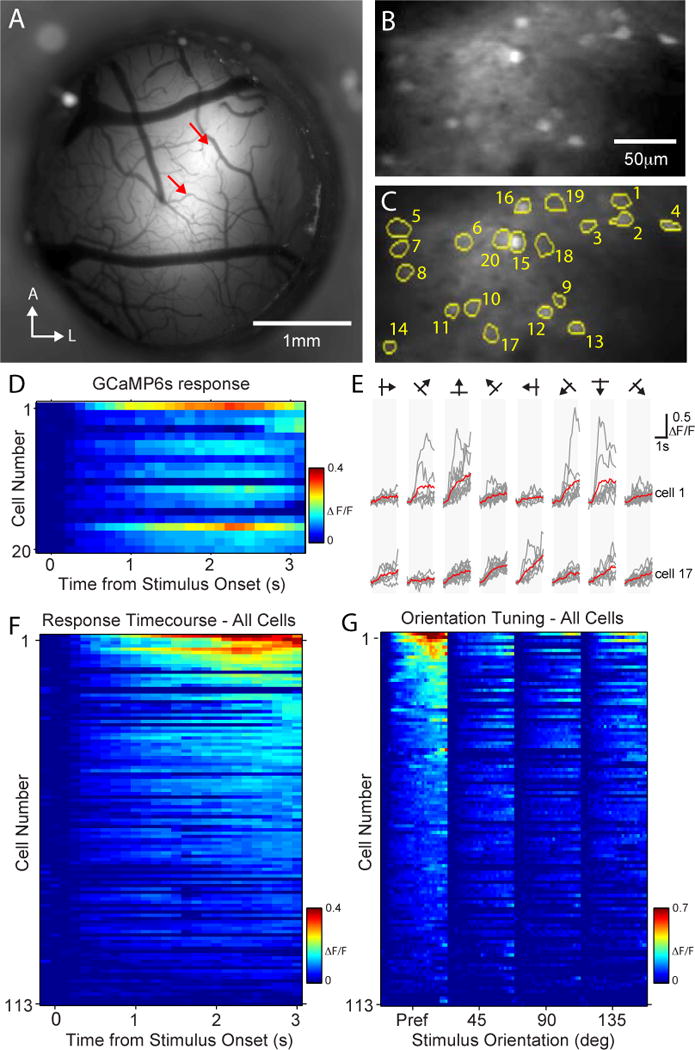
A) Wide-field, epifluorescence image of an optical window implanted above the rat visual cortex. Red arrows indicate the center of the two AAV-GCaMP6s injection sites. B) Image of GCaMP6s-labeled neurons and neuropil located in layers II/III, near the center of the posterior injection site shown in panel A, obtained during voluntary head restraint with a two-photon microscope using an air objective. C) Regions of interest (ROIs) around the somas of morphologically identified GCaMP6s-labeled neurons found in panel B. Numbers correspond to the rows of the response matrix in panel D. D) Mean responses (ΔF/F) across all trials for each of the 20 somatic ROIs identified in panel C. Visual stimuli, sinusoidal gratings moving in one of eight randomly selected directions, were presented beginning at time 0 and ending at 2 seconds. E) Responses for two of the cells identified in panels C and D during the presentation of visual stimuli on each trial (gray lines). Mean response for each stimulus direction is shown in red. Vertical gray bars indicate the time of stimulus presentation. F) Responses for all recorded GCaMP6s-labeled neurons ranked by the magnitude of the response after the presentation of the stimulus. G) Responses of all GCaMP6s-labeled neurons grouped by the orientation of the stimulus and ranked by the magnitude of their response to the preferred direction (Pref). See also Figure S4.
DISCUSSION
Here we demonstrate that rats can be trained to voluntarily produce head restraint in which brain motion is limited to a few microns, enabling two recently developed powerful technologies to be used together for the first time: (1) high-throughput behavioral training using computer-controlled behavior boxes, and (2) cellular resolution imaging of neural dynamics using two photon excitation fluorescence microscopy and genetically-encoded calcium sensors. The crucial technical development was a precise method by which the brain can be returned to nearly the exact same location in space on each insertion. As we demonstrate, the spatial precision that can be obtained when the mount is engaged is a few microns, which is less than one neuron’s cell body diameter. Thus the same field of neurons can be imaged on successive insertions, and across successive days. This approach opens up an entirely new way of combining the power of optical methods with the efficiency of high-throughput training systems.
Comparison to Other Methods
Previous reports have described methods for acclimating rats to forced head-restraint by providing water reward and by gradually increasing the duration of restraint (reviewed in Schwarz et al., 2010). Head-restrained rats could be trained to perform motor movements to indicate behavioral choice in sensory discrimination (Harvey et al., 2001; Stuttgen et al., 2006; Verhagen et al., 2007) and detection tasks (Houweling and Brecht, 2008). However, the training procedures require a long acclimation period and significant experimenter involvement, precluding automation (Schwarz et al., 2010). Moreover, none of these systems allowed animals to transition between head-fixation and free motion in a single session, prohibiting behavioral response modalities such as head-movements, which are commonly used in operant conditioning paradigms.
The use of spherical treadmills has been shown to help acclimate mice to head restraint. This approach allows mice to report behavioral choice by movement of the treadmill (Dombeck et al., 2010) and can be combined with visual feedback to produce a virtual reality environment where mice can be trained to ‘navigate’ while head-fixed (Harvey et al., 2009). One key advantage of this system is that the amount of force the animal is able to apply to the headplate can be reduced since the treadmill rotates whenever the animal tries to push with its legs. Such an approach could in principle be applied to rats, in which the neural circuitry underlying navigation has been well studied. Indeed body-tethered rats have already been trained to operate a spherical treadmill in a virtual reality system (Hölscher et al., 2005). However, head-fixed navigation systems for rats have not yet been reported.
Miniature head mounted two-photon microscopes provide an alternative to head immobilization during in vivo imaging (Helmchen et al., 2001; Piyawattanametha et al., 2009). Advantages of this approach include the ability to measure neuron activity in a wide variety of natural behaviors. Recently designed implantable microscopes have been shown to allow cellular resolution imaging of fluorescence calcium transients in the visual cortex of awake rats (Sawinski et al., 2009). However, the technical difficulty in using these miniature microscopes has limited their use as an experimental tool in neuroscience (Kerr and Nimmerjahn, 2012). Moreover, many other in vivo imaging technologies are difficult to miniaturize, which precludes their use as head-mounted devices.
In general, brain motion during imaging can limit the spatial scale of neural structures appropriate for time series fluorescence measurements in vivo. We demonstrated that brain motion during imaging within a single trial of voluntary head fixation is on the micron scale and similar to that observed in head-fixed mice on a spherical treadmill (Dombeck, 2007, 2010). However, during voluntary head restraint, there is additional micron-scale variability in registration of the kinematic headplate on each insertion. Of particular importance are registration errors in Z, which cannot be corrected offline using existing methods. As demonstrated in Figures 6 and 7, the combined brain motion and registration errors of our system still allow for somatic measurements of calcium dynamics from large populations of neurons. In the future, Z-registration errors on insertion could potentially be corrected by appropriate re-positioning of the objective (as currently performed to protect the objective during insertion of the headplate) based on correlation of the first image with a reference Z-stack. Also Z-motion artifacts can be mitigated through the use of an elongated axial point spread function or rapid volume scanning and offline processing.
Technical Outlook and Other Applications
The combined system of voluntary head restraint and in vivo cellular resolution imaging provides a foundation to utilize the growing arsenal of fluorescent sensors, genetics tools and optical technologies for the study of the neural circuits. Measurement of calcium dependent fluorescence transients with genetically encoded sensors can be optimized for recording the dynamics of large populations of neurons during behavior and, as we have shown, enables efficient tracking the same population of neurons over time. In addition, stable optical access allows for the perturbation of neuronal activity at cellular resolution (Rickgauer and Tank, 2009) with new optogenetic methods (Miesenbock, 2011; Zhang et al., 2007).
Although our focus here is on cellular resolution imaging, the voluntary head restraint system we describe should be more broadly applicable in neuroscience. We foresee three additional areas of application. First, voluntary head restraint could be combined with other imaging modalities, such as wide-field single photon imaging of calcium indicators, fMRI, functional ultrafast ultrasound imaging (fUS) (Mace et al., 2011), and high resolution positron emission tomography (microPET) (Kornblum et al., 2000), to study global dynamics and identify brain regions involved in different aspects of behavioral tasks of interest.
A second use of voluntary head restraint could be to increase control over sensory input and behavioral output. The ability for rats to rapidly switch between head-restraint and head-free behaviors would be particularly useful in characterizing sensory and motor systems as the responses of the same neurons could be compared across both states. For example when studying the visual system, a head-mounted recording device could be used to measure neuronal dynamics to complex stimuli while animals freely view objects. Then upon voluntary head restraint, those same neurons could be characterized in a controlled environment where the position of the eye can be tracked and where the location of the visual stimulus on the retina can be easily controlled. Indeed an earlier form of voluntary head restraint was used to facilitate presentation of visual stimuli to the same region of visual space, enabling reliable mapping of responses in V1 (Girman 1980; Girman 1985).
A third potential use of voluntary head restraint could be to serve as a platform to develop high-throughput in vivo imaging. The imaging system we report is automated, in the sense that during a recording session no experimenter intervention is required; it therefore could, in principle, form the basis for a truly high-throughput imaging facility, in which multiple rats can be imagined in parallel or series without human involvement. Such an approach could prove useful for systematic whole brain mapping experiments, characterizing newly developed contrast agents for brain imaging or for screening the effects of neuropharmocological agents in awake animals (Borsook et al., 2006).
Conclusion
The key advantage of voluntary head-restraint is that it is the first system that allows in vivo imaging to be integrated into automated behavioral training and analysis systems such as live-in training chambers or high-throughput facilities. By decreasing the time-demand on the user, the combined automated behavioral and imaging system described here allows for long-term training, which facilitates the study of cognitive tasks that require long training times per animal (Brunton et al., 2013), as well as the training and imaging of large numbers of animals. This system also provides a new tool for drug discovery by providing an efficient means of evaluating the effect of psychoactive compounds on brain dynamics in awake behaving animals, and facilitates the characterization of rat models of neuropsychiatric disorders.
EXPERIMENTAL PROCEDURES
Kinematic clamp and microscope design
A kinematic clamp for voluntary head restraint was drafted using 3D mechanical modeling design software (Autodesk Inventor) and fabricated in the Princeton University Physics Department machine shop. Stainless steel ball bearings (either 1/4 inch or 3/16 inch diameter, McMaster Carr) were mounted on brass pistons that coupled to the frame of the kinematic clamp via small low-friction linear tables (NDN 2-40.30, Schneeberger) and driven by pneumatic linear actuators (6604k11, McMaster Carr). A custom implantable titanium headplate was designed to mate with the kinematic clamp. Low-force, miniature snap action switches (D42L-R1XL, Cherry corporation) mounted on the clamp were used to detect when the anterior edge of the headplate reached the rear end of the heaplate slot. When the headplate was in this location, actuation of the kinematic clamp would drive the piston-mounted ball bearings toward the conical depression and the v-groove. Interaction between the piston-mounted ball bearings and the conical depression and the v-groove constrained 5 of 6 of the degrees of freedom of the headplate. The sixth degree, pitch, was constrained by interactions between the top plane of the headplate and the flat surface of the ceiling of the headplate slot. In some cases, we found it necessary to more firmly constrain pitch as some animals were able to produce sufficient torque on their headplate to create pitch movements, which contributed to brain motion. In these cases we mounted miniature Teflon tipped brass arms to the pistons that contacted the underside of the anterior portion of the headplate and clamped the headplate more firmly to the ceiling of the headplate slot. Delivery of air pressure (0-90PSI) to the pneumatic linear actuators was controlled either by a manual regulator combined with two solenoid valves (T9-65-900, Toohey corporation), or using a voltage-controlled regulator (ITV1050-31N2S4, SMC corporation). The kinematic clamp was installed along one wall of the modified rat operant conditioning chamber (Island Motion), which also contained two additional reward pokes on the left and right side. Position of the center poke was controlled either by a custom manual translation stage or using a motorized linear stage (ET-50-21, Newmark Systems). A behavioral control system, Bcontrol (see below), controlled the timing of fluid rewards, auditory and visual cues. A schematic diagram of the overall system architecture is shown in Figure S1.
The operant conditioning chamber was mounted on an air table that also housed a movable objective microscope (Sutter Instruments). The microscope was positioned so that the vertically oriented objective was centered over the headport clamp. Two objectives were used in for TPM: a 40x, 0.8 N.A., water immersion (LUMPLFN40XW, Olympus) and a 40X, 0.6 N.A. with a correction collar (LUCPLFLN40X, Olympus). A Ti:Sapphire laser was used as an illumination source (Chameleon Ultra II, Coherent) for 920nm light. A delrin collar was designed to mount on the barrel of the water immersion objective and position two stainless steel tubes, one for fluid delivery and one for fluid removal. Upon activation of the clamp at the beginning of each insertion event, 75 μl of immersion fluid was delivered to the gap between the implanted optical window and the face of the imaging objective. Inflow was produced by a gravity fed system. Immersion fluid was removed by aspiration at the end of each trial’s imaging period. Tubes for fluid were constructed from 18-guage stainless steel tubing that was bent to follow the curve of the objective.
Behavioral Control System
Sensors and actuators in the behavioral training chamber were controlled by the freely available, open source software platform, Bcontrol (Erlich et al., 2011). Bcontrol consists of an enhanced finite state machine, instantiated on a linux computer running a real-time operating system (RTLinux) and capable of state transitions at a rate of 6kHz, plus a second computer, running custom software written in Matlab. The state machine contained a multifunction data acquisition card (PCI-6025E, National Instruments), which was connected to the sensors and actuators in the behavioral chamber via a powered breakout box (Island Motion). Each behavioral trial consisted of a sequence of states in which different actuators – for example opening of a solenoid valve for water reward – could be triggered. Transitions between the states were either governed by elapsed times (e.g. 40ms for water reward) or by the animal’s actions, which caused changes to the voltage output of a sensor in the chamber (e.g. the headplate contacting the miniature snap action switches). Sensors included infrared LED sensors (Island Motion) and miniature snap action switches. Actuators included speakers (Island Motion), visible LEDs (Island Motion), solenoid valves for water reward (Island Motion) and solenoid valves for the air, which drove the pneumatic linear actuators. Solenoid valves controlled by Bcontrol also were used to apply and remove the immersion fluid for the microscope objective. Output signals from the state machine were also used to trigger actions in downstream devices, such as the imaging acquisition computer.
Subjects
Animal use procedures were approved by the Princeton University Institutional Animal Care and Use Committee and carried out in accordance with National Institutes of Health standards. All subjects were adult male Long-Evans rats (Taconic, NY) weighing between 200g and 400g. Rats were placed on a water schedule in which fluids are provided during behavioral training and an additional period lasting 0–1 hour.
Surgery
To implant the headplate, animals were anesthetized with isoflurane in oxygen and given Buprenorphine as an analgesic. Animals also received an injection of dexamethasone the day of and the day after surgery. Once anesthetized, the scalp and periostium were retracted, exposing the skull. Dental cement (Metabond) was used to bond the headplate to the skull. After a 1-week recovery period implanted animals began training in voluntary head restraint.
We found two aspects of the headplate implantation surgery to be critical for the integrity of the junction between the skull and the headplate over a long period of time. First, sterile technique was critical to prevent infection of the bone, which can lead to a softening of the skull and loss of headplates. Second, we found it was necessary to keep the skull completely clear of blood and other fluids so that it was dry when the metabond was applied. We used a thin layer of medical grade cynanoacryate adhesive (Vetbond) to form a fluid impermeable barrier to protect the skull from fluid prior to application of the metabond and to enhance adhesion.
Optical access to the cortex was achieved by implantation of an optical window for chronic in vivo imaging. The optical window could be implanted either during the same surgery as the headplate or in a second surgery that could be performed after many weeks of training. This second approach allowed animals to be screened for good behavioral performance before implantation of the optical window.
To implant the optical window, a small 3.5 mm diameter trephination was made in the skull. Next, the dura was removed, since in preliminary experiments we found that it prevents deep imaging due to its propensity to scatter light. After the cortex was exposed, 20–30nl of high titer (>3×10¹³ GC per ml) adeno-associated viral vector 2/1 carrying the gene for either GCaMP3 (8 animals) or the slow variant of GCaMP6 (2 animals) under control of the human synapsin promoter (AAV2/1.hSynap.GCaMP3.WPRE.SV40 & AAV2/1.hSynap.GCaMP6s.WPRE.SV40, University of Pennsylvania Vector Core) was slowly injected (10nl/minute) at multiple (2–3) locations 250–350μm deep and spaced roughly 0.5 mm apart, forming the vertices of an equilateral triangle. After injections were performed, the craniotomy was sealed with an optically clear implantable assembly consisting of 3.5mm diameter, #1 circular cover glass (Schott) bonded using UV curing optical adhesive (NOA 81, Norland Products) to a 9-gauge stainless steel ring that was 400 or 800μm high (MicroGroup). The optical implant was lowered into place stereotaxically and bonded to the animal’s skull using medical grade cyanoacrylate adhesive and dental cement.
In pilot experiments we observed the growth of new tissue between the optical implant and the cortical surface. This growth eventually made imaging impossible, usually within 1 week after it was first observed. We found that we could prevent this regrowth by taking the following steps during surgery: 1) administration of dexamethasone (1mg/kg) prior to surgery, 2) strict adherence to sterile technique during surgery, 3) minimizing the trauma to the cortical surface during the durotomy. 4) application of gentle pressure to the cortical surface using the optical window. In our hands >75% of optical window implantation surgeries yielded useable samples.
Presentation of sensory stimuli
Drifting gratings (0.3–0.03 cycles per degree, 2 cycles per second) used to measure orientation tuning of V1 neurons were generated using Matlab with the aide of Psychophysics Toolbox and back-projected on a 7.5 cm by 5 cm vellum screen, located 5 cm away from the animal’s left eye, using a laser-based projector (SHOWWX Laser Pico Projector, MicroVision). Gratings were oriented in 8 different directions separated by 45 degrees, and were randomly interleaved, trial-to-trial. All stimuli were presented using the blue laser (470nm) so that the light from the visual stimulus was spectrally separated from GCaMP fluorescence and could be filtered out by optics in the microscope collection path. Due to the narrow wavelength used to display the visual stimulation, no additional light shielding was needed aside from emission filters used in our microscopes collection path.
To control for potential single photon stimulation of GCaMP from the presentation of visual stimulation at 470nm, we compared the averaged fluorescence intensity of a FOV containing multiple GCaMP6s labeled neurons across two conditions: 1) visual stimulation alone (i.e. laser projector on, imagining laser off), and 2) background (i.e. laser projector off, imaging laser off). The PMT output signal was not significantly greater during visual stimulation alone then during background measurements (p>>0.01, one tailed t-test). These results suggest that: 1) single photon stimulation of GCAMP6 from our visual stimulation system does not produce significant fluorescence signals that effect data acquisition, and 2) stray light from the laser based projection system does not significantly effect our PMT readings during in vivo imaging.
Imaging acquisition
ScanImage (version 3.7) was used for microscope control and image acquisition (Pologruto et al., 2003). Images were acquired at 1ms per line at a resolution of 256 by 100 pixels, leading to an overall frame rate of 10 Hz. On each session a field of view was selected in layer 2/3 (150–300 μm below the cortical surface) based on the presence of large numbers of labeled cells. Laser intensity was controlled by the experimenter using a Pockels cell and was monitored using an amplified photodetector (Thorlabs). The power after the objective ranged between 40-150mW (typically ~50 mW for GCaMP6s, ~150mW for GCaMP3) and was adjusted to compensate for changes signal intensity which varied depending on the imaging depth and strength of GCaMP expression. Imaging acquisition of a fixed number of frames, depending on the duration of head-restraint, was triggered on each behavioral trial by a TTL pulse from Bcontrol.
Data analysis
Whole frame motion correction and offset registration were applied offline to collected data as previously described (Miri et al., 2011). Briefly, for each field of view we performed 2D cross-correlation between each frame and a manually selected reference frame to identify frame-to-frame displacements in the imaging plane. Frames for which the maximum correlation value fell below a user-determined threshold were excluded from further analysis. Motion corrected movies were used for subsequent quantification of GCaMP fluorescence transients. To quantify fluorescence transients, a region of interest (ROI) around each GCAMP positive cell body, process or region of neuropil was selected using the ROI manager in ImageJ. The ROI locations were imported into Matlab and used to extract the mean fluorescence value for each object on each frame (F(t)).
To correct for background activity and normalize for the fluorescence value of each cell, we first separated the trial into two parts: a baseline period corresponding to all the frames recorded prior to 1 frame (100ms) after the presentation of the stimulus, and a stimulus period, beginning 300ms after the onset of the stimulus and lasting 500ms after the offset of the stimulus. Next for each ROI we calculated ΔF/F for each frame (t), where and F(baseline) was the mean fluorescence value for that ROI for all frames in the baseline period for that trial.
To identify visually responsive neurons we performed two tests. First, mean ΔF/F for frames acquired during the stimulus periods for the 8 directions and the baseline period were compared using an ANOVA. Second the response of each cell was compared against responses from the neuropil (see below). Only cells with significant differences (p<0.01) across the stimulus and pre-stimulus periods, and that exceeded the response of the mean neuropil signal by two standard deviations were identified as ‘responsive’. The preferred direction (θpref) for each cell was defined as the direction that generated the largest mean response for that cell.
Estimate of neuropil signal
For each somatic ROI, a neuropil ROI was selected that was the same size of a neuronal soma (typically 10 by 10 pixels) offset from the somatic ROI by 10 pixels towards the center of the FOV. Pixels already contained within the ROI of the soma or the somas of other neurons were excluded from the neuropil ROI. Then we calculated the preferred direction for each neuropil ROI as described above. Finally, we calculated the mean and standard deviation of the magnitude of the response to the preferred direction (ΔF/F(θpref)) across all neuropil ROIs. Our second test for responsiveness was that the ΔF/F(θpref) for a neuron must exceed the mean neuropil response by 2 standard deviations.
Calculation of orientation and direction selectivity index
For each visually responsive neuron, we calculated the orientation selectivity index (OSI) and direction selectivity index (DSI) were calculated as follows:
where: θorth = θpref + π/2, θopp = θpref + π and R(θ) = ΔF/F(θ)-offset; where ΔF/F(θ) was the mean ΔF/F for all frames in the response period of all trials in which the stimulus direction = θ and offset was the mean ΔF/F for all frames in the response period for the individual trial with the weakest response.
Z-motion analysis
Motion perpendicular to the imaging plane (Z-motion) was estimated as previously described (Dombeck et al. 2007). Briefly, each frame acquired during voluntary head restraint (T-series) was compared to each frame of image stack acquired in an anesthetized animal after the behavioral session (Z-series). The Z-series was acquired at 0.25 μm steps extending over a total of 40μm and was centered on the same FOV recorded in the previous session. Motion correction was applied to the T-series before comparison and each frame in the Z and T series was intensity normalized by subtracting the mean and dividing by the standard deviation. For each element of the T stack the correlation values were computed for all the intensity normalized frames in the Z series. The frame in the Z-series with the greatest correlation to a given T-series was taken to be the relative Z position of that frame. Within-trial Z-motion was calculated by first subtracting the Z-position of each frame within a trial from the mean Z-position across all the frames of that trial and then taking the standard deviation of all mean subtracted values. Trial-to-trial Z-displacement was defined as the standard deviation of the mean Z-position for each trial across all trials within a training session.
Supplementary Material
HIGHLIGHTS.
Rat voluntary head restraint trained by automated operant conditioning
Micron scale brain repositioning during restraint using a novel kinematic mount
Two-photon cellular resolution calcium imaging from the same neurons on every trial
First demonstration of in vivo functional imaging of GECIs in awake, behaving rats
Acknowledgments
We thank K. Osorio and J. Teran for animal training, D. Aranov for translation of Girman 1980 and S. Lowe for assistance with hardware fabrication. This work was supported by NIH challenge grant number 1RC1NS068148 and by NIH grant number R21 NS082956
Footnotes
Publisher's Disclaimer: This is a PDF file of an unedited manuscript that has been accepted for publication. As a service to our customers we are providing this early version of the manuscript. The manuscript will undergo copyediting, typesetting, and review of the resulting proof before it is published in its final citable form. Please note that during the production process errors may be discovered which could affect the content, and all legal disclaimers that apply to the journal pertain.
References
- Aitman TJ, Critser JK, Cuppen E, Dominiczak A, Fernandez-Suarez XM, Flint J, Gauguier D, Geurts AM, Gould M, Harris PC, et al. Progress and prospects in rat genetics: a community view. Nature Genetics. 2008;40:516–522. doi: 10.1038/ng.147. [DOI] [PubMed] [Google Scholar]
- Akerboom, et al. Optimization of a GCaMP calcium indicator for neural activity imaging. J Neurosci. 2012;32:13819–13840. doi: 10.1523/JNEUROSCI.2601-12.2012. [DOI] [PMC free article] [PubMed] [Google Scholar]
- Borsook D, Becerra L, Hargreaves R. A role for fMRI in optimizing CNS drug development. Nat Rev Drug Discov. 2006;5:411–424. doi: 10.1038/nrd2027. [DOI] [PubMed] [Google Scholar]
- Brunton BW, Botvinick MM, Brody CD. Rats and humans can optimally accumulate evidence for decision-making. Science. 2013;340:95–98. doi: 10.1126/science.1233912. [DOI] [PubMed] [Google Scholar]
- Chen TW, Wardill TJ, Sun Y, Pulver SR, Renninger SL, Baohan A, Schreiter ER, Kerr RA, Orger MB, Jayaraman V, Looger LL, Svoboda K, Kim DS. Ultrasensitive fluorescent proteins for imaging neuronal activity. Nature. 2013;499:295–300. doi: 10.1038/nature12354. [DOI] [PMC free article] [PubMed] [Google Scholar]
- Denk W, Strickler JH, Webb WW. Two-photon laser scanning fluorescence microscopy. Science. 1990;248:73–76. doi: 10.1126/science.2321027. [DOI] [PubMed] [Google Scholar]
- Dolgin E. The knockout rat pack. Nature Medicine. 2010;16:254–257. doi: 10.1038/nm0310-254. [DOI] [PubMed] [Google Scholar]
- Dombeck DA, Harvey CD, Tian L, Looger LL, Tank DW. Functional imaging of hippocampal place cells at cellular resolution during virtual navigation. Nat Neurosci. 2010;13:1433–1440. doi: 10.1038/nn.2648. [DOI] [PMC free article] [PubMed] [Google Scholar]
- Dombeck DA, Khabbaz AN, Collman F, Adelman TL, Tank DW. Imaging large-scale neural activity with cellular resolution in awake, mobile mice. Neuron. 2007;56:43–57. doi: 10.1016/j.neuron.2007.08.003. [DOI] [PMC free article] [PubMed] [Google Scholar]
- Dwinell MR. Online tools for understanding rat physiology. Brief Bioinformatics. 2010;11:431–439. doi: 10.1093/bib/bbp069. [DOI] [PMC free article] [PubMed] [Google Scholar]
- Erlich JC, Bialek M, Brody CD. A cortical substrate for memory-guided orienting in the rat. Neuron. 2011;72:330–343. doi: 10.1016/j.neuron.2011.07.010. [DOI] [PMC free article] [PubMed] [Google Scholar]
- Geurts AM, Cost GJ, Freyvert Y, Zeitler B, Miller JC, Choi VM, Jenkins SS, Wood A, Cui X, Meng X, et al. Knockout rats via embryo microinjection of zinc-finger nucleases. Science. 2009;325 doi: 10.1126/science.1172447. [DOI] [PMC free article] [PubMed] [Google Scholar]
- Girman SV. Method for restricting movements of awake rat during neurophysiological experimentation. Zh Vyssh Nervn Deyat. 1980;30:1087–1089. [PubMed] [Google Scholar]
- Girman SV. Responses of neurons of primary visual cortex of awake unrestrained rats to visual stimuli. Neuroscience and Behavioral Physiology. 1985;15:379–386. doi: 10.1007/BF01184022. [DOI] [PubMed] [Google Scholar]
- Girman SV, Sauve Y, Lund RD. Receptive field properties of single neurons in rat primary visual cortex. J Neurophysiol. 1999;82:301–311. doi: 10.1152/jn.1999.82.1.301. [DOI] [PubMed] [Google Scholar]
- Harvey CD, Coen P, Tank DW. Choice-specific sequences in parietal cortex during a virtual-navigation decision task. Nature. 2012;484:62–68. doi: 10.1038/nature10918. [DOI] [PMC free article] [PubMed] [Google Scholar]
- Harvey CD, Collman F, Dombeck DA, Tank DW. Intracellular dynamics of hippocampal place cells during virtual navigation. Nature. 2009;461:941–946. doi: 10.1038/nature08499. [DOI] [PMC free article] [PubMed] [Google Scholar]
- Harvey M, Bermejo R, Zeigler H. Discriminative whisking in the head-fixed rat: optoelectronic monitoring during tactile detection and discrimination tasks. Somatosens Mot Res. 2001;18:211–222. doi: 10.1080/01421590120072204. [DOI] [PubMed] [Google Scholar]
- Helmchen F, Fee MS, Tank DW, Denk W. A miniature head-mounted two-photon microscope. high-resolution brain imaging in freely moving animals. Neuron. 2001;31:903–912. doi: 10.1016/s0896-6273(01)00421-4. [DOI] [PubMed] [Google Scholar]
- Hölscher C, Schnee A, Dahmen H, Setia L, Mallot HA. Rats are able to navigate in virtual environments. J Exp Biol. 2005;208:561–569. doi: 10.1242/jeb.01371. [DOI] [PubMed] [Google Scholar]
- Houweling AR, Brecht M. Behavioural report of single neuron stimulation in somatosensory cortex. Nature. 2008;451:65–68. doi: 10.1038/nature06447. [DOI] [PubMed] [Google Scholar]
- Huang G, Tong C, Kumbhani DS, Ashton C, Yan H, Ying QL. Beyond knockout rats. Cell Cycle. 2011;10:1059–1066. doi: 10.4161/cc.10.7.15233. [DOI] [PMC free article] [PubMed] [Google Scholar]
- Huber D, Gutnisky DA, Peron S, O’Connor DH, Wiegert JS, Tian L, Oertner TG, Looger LL, Svoboda K. Multiple dynamic representations in the motor cortex during sensorimotor learning. Nature. 2012;484:473–478. doi: 10.1038/nature11039. [DOI] [PMC free article] [PubMed] [Google Scholar]
- Kampff AR, Xie K, Agrochao M, Meister M, Ölveczky BP. The voluntarily head-restrained rat. Society for Neuroscience Annual Meeting; 2010. [Google Scholar]
- Kerr JND, Nimmerjahn A. Functional imaging in freely moving animals. Curr Opin Neurobiol. 2012;22:45–53. doi: 10.1016/j.conb.2011.12.002. [DOI] [PubMed] [Google Scholar]
- Kornblum HI, Araujo DM, Annala AJ, Tatsukawa KJ, Phelps ME, Cherry SR. In vivo imaging of neuronal activation and plasticity in the rat brain by high resolution positron emission tomography (microPET) Nat Biotechnol. 2000;18:655–660. doi: 10.1038/76509. [DOI] [PubMed] [Google Scholar]
- Mace E, Montaldo G, Cohen I, Baulac M, Fink M, Tanter M. Functional ultrasound imaging of the brain. Nat Methods. 2011;8:662–664. doi: 10.1038/nmeth.1641. [DOI] [PubMed] [Google Scholar]
- Miesenbock G. Optogenetic Control of Cells and Circuits. Annual Review of Cell and Developmental Biology. 2011;27:731–758. doi: 10.1146/annurev-cellbio-100109-104051. [DOI] [PMC free article] [PubMed] [Google Scholar]
- Miri A, Daie K, Burdine RD, Aksay E, Tank DW. Regression-Based Identification of Behavior-Encoding Neurons During Large-Scale Optical Imaging of Neural Activity at Cellular Resolution. J Neurophysiol. 2011;105:964–980. doi: 10.1152/jn.00702.2010. [DOI] [PMC free article] [PubMed] [Google Scholar]
- Ohki K, Chung S, Ch’ng YH, Kara P, Reid RC. Functional imaging with cellular resolution reveals precise micro-architecture in visual cortex. Nature. 2005;433:597–603. doi: 10.1038/nature03274. [DOI] [PubMed] [Google Scholar]
- Parnavelas JG, Burne RA, Lin CS. Receptive field properties of neurons in the visual cortex of the rat. Neuroscience Letters. 1981;27:291–296. doi: 10.1016/0304-3940(81)90445-6. [DOI] [PubMed] [Google Scholar]
- Piyawattanametha W, Cocker ED, Burns LD, Barretto RPJ, Jung JC, Ra H, Solgaard O, Schnitzer MJ. In vivo brain imaging using a portable 2.9 g two-photon microscope based on a microelectromechanical systems scanning mirror. Opt Lett. 2009;34:2309–2311. doi: 10.1364/ol.34.002309. [DOI] [PMC free article] [PubMed] [Google Scholar]
- Pologruto TA, Sabatini BL, Svoboda K. ScanImage: flexible software for operating laser scanning microscopes. Biomed Eng Online. 2003;2:13. doi: 10.1186/1475-925X-2-13. [DOI] [PMC free article] [PubMed] [Google Scholar]
- Rickgauer JP, Tank DW. Two-photon excitation of channelrhodopsin-2 at saturation. PNAS. 2009;106:15025–15030. doi: 10.1073/pnas.0907084106. [DOI] [PMC free article] [PubMed] [Google Scholar]
- Sawinski J, Wallace DJ, Greenberg DS, Grossmann S, Denk W, Kerr JND. Visually evoked activity in cortical cells imaged in freely moving animals. Proc Natl Acad Sci USA. 2009;106:19557–19562. doi: 10.1073/pnas.0903680106. [DOI] [PMC free article] [PubMed] [Google Scholar]
- Schwarz C, Hentschke H, Butovas S, Haiss F, Stuttgen MC, Gerdjikov TV, Bergner CG, Waiblinger C. The head-fixed behaving rat—procedures and pitfalls. Somatosens Mot Res. 2010;27:131–148. doi: 10.3109/08990220.2010.513111. [DOI] [PMC free article] [PubMed] [Google Scholar]
- Stuttgen MC, Ruter J, Schwarz C. Two psychophysical channels of whisker deflection in rats align with two neuronal classes of primary afferents. J Neurosci. 2006;26:7933–7941. doi: 10.1523/JNEUROSCI.1864-06.2006. [DOI] [PMC free article] [PubMed] [Google Scholar]
- Tesson L, Usal C, Menoret S, Leung E, Niles BJ, Remy S, Santiago Y, Vincent AI, Meng X, Zhang L, et al. Knockout rats generated by embryo microinjection of TALENs. Nat Biotechnol. 2011;29:695–696. doi: 10.1038/nbt.1940. [DOI] [PubMed] [Google Scholar]
- Tian L, Hires SA, Mao T, Huber D, Chiappe ME, Chalasani SH, Petreanu L, Akerboom J, McKinney SA, Schreiter ER, et al. Imaging neural activity in worms, flies and mice with improved GCaMP calcium indicators. Nat Methods. 2009;6:875–881. doi: 10.1038/nmeth.1398. [DOI] [PMC free article] [PubMed] [Google Scholar]
- Uchida N, Mainen ZF. Speed and accuracy of olfactory discrimination in the rat. Nat Neurosci. 2003;6:1224–1229. doi: 10.1038/nn1142. [DOI] [PubMed] [Google Scholar]
- Verhagen JV, Wesson DW, Netoff TI, White JA, Wachowiak M. Sniffing controls an adaptive filter of sensory input to the olfactory bulb. Nat Neurosci. 2007;10:631–639. doi: 10.1038/nn1892. [DOI] [PubMed] [Google Scholar]
- Winter Y, Schaefers ATU. A sorting system with automated gates permits individual operant experiments with mice from a social home cage. J Neurosci Methods. 2011;196:276–280. doi: 10.1016/j.jneumeth.2011.01.017. [DOI] [PubMed] [Google Scholar]
- Witten IB, Steinberg EE, Lee SY, Davidson TJ, Zalocusky KA, Brodsky M, Yizhar O, Cho SL, Gong S, Ramakrishnan C, et al. Recombinase-driver rat lines: tools, techniques, and optogenetic application to dopamine-mediated reinforcement. Neuron. 2011;72:721–733. doi: 10.1016/j.neuron.2011.10.028. [DOI] [PMC free article] [PubMed] [Google Scholar]
- Zhang F, Wang LP, Brauner M, Liewald JF, Kay K, Watzke N, Wood PG, Bamberg E, Nagel G, Gottschalk A, et al. Multimodal fast optical interrogation of neural circuitry. Nature. 2007;446:633–639. doi: 10.1038/nature05744. [DOI] [PubMed] [Google Scholar]
Associated Data
This section collects any data citations, data availability statements, or supplementary materials included in this article.