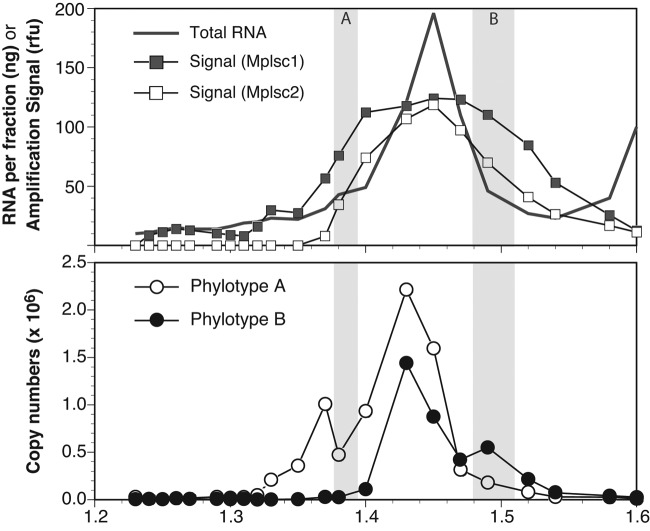
FIG 1 .
Distribution of picornavirad-like viruses in a CsCl buoyant density gradient. (Upper panel) The total RNA from the 2009 sample measured in each fraction of a buoyant density gradient (redrawn using data from reference 4) is shown along with the average amplification signal from endpoint PCR with degenerate primers targeting marine picornavirad-like viruses. The amplification signal value (in arbitrary relative fluorescence units) was determined by image analysis of the amplicons on an agarose gel and is presented as the running average of the signal for two sets of primers broadly targeting marine picornavirad-like subclade 1 (Mplsc1) and Mplsc2. (Lower panel) The copy numbers of two specific RdRp phylotypes that were identified by cloning and sequencing of amplicons from two of the fractions as determined by RT-qPCR. The shaded regions in both panels indicate the fractions used to create clone libraries and are labeled according to the phylotype (A or B) that was found only in that library.

