

Abstract
By allowing simultaneous measurements of tumor volume and metabolic activity, integrated PET/CT opens up new approaches for assessing tumor response to therapy. The aim of this study was to determine whether combined assessment of tumor volume and metabolic activity improves the accuracy of 18F-FDG PET for predicting histopathologic tumor response in patients with soft-tissue sarcomas.
Methods
Twenty patients with locally advanced high-grade soft-tissue sarcoma (10 men and 10 women; mean age, 49 ± 17 y) were studied by 18F-FDG PET/CT before and after preoperative therapy. CT tumor volume (CTvol) was measured by delineating tumor borders on consecutive slices of the CT scan. Mean and maximum 18F-FDG standardized uptake value within this volume (SUVmean and SUVmax, respectively) were determined. Two indices of total lesion glycolysis (TLG) were calculated by multiplying tumor volume by SUVmean (TLGmean) and SUVmax (TLGmax). Changes in CTvol, SUVmean, SUVmax, TLGmean, and TLGmax after chemotherapy were correlated with histopathologic tumor response (≥95% treatment-induced tumor necrosis). Accuracy for predicting histopathologic response was compared by receiver-operating-characteristic (ROC) curve analysis.
Results
Baseline SUVmax, SUVmean, CTvol, TLGmean, and TLGmax were 11.22 g/mL, 2.84 g/mL, 544.1 mL, 1,619.8 g, and 8852.9 g, respectively. After neoadjuvant therapy, all parameters except CTvol showed a significant decline (ΔSUVmax = −51%, P < 0.001; ΔSUVmean = −40%, P < 0.001; ΔCTvol = −14%, P = 0.37; ΔTLGmean = −44%, P = 0.006; and ΔTLGmax = −54%, P = 0.001). SUV changes in histopathologic responders (n = 6) were significantly more pronounced than those in nonresponders (n = 14) (P = 0.001). Histopathologic response was well predicted by changes in SUVmean and SUVmax (area under ROC curve [AUC] = 1.0 and 0.98, respectively) followed by TLGmean (AUC = 0.77) and TLGmax (AUC = 0.74). In contrast, changes in CTvol did not allow prediction of treatment response (AUC =0.48).
Conclusion
In this population of patients with sarcoma, TLG was less accurate in predicting tumor response than were measurements of the intratumoral 18F-FDG concentration (SUVmax, SUVmean). Further evaluation of TLG in larger patient populations and other tumor types is necessary to determine the value of this conceptually attractive parameter for assessing tumor response.
Keywords: sarcoma, PET/CT, 18F-FDG, treatment monitoring, multimodality imaging
Several years ago, Larson et al. (1) proposed a semi-quantitative index of total tumor lesion glycolysis (TLG) for better describing tumor glucose use and their changes in response to treatment. This index combined volumetric tumor assessments with tumor 18F-FDG uptake. At that time PET/CT (2) was not routinely available, and the investigators derived both tumor volumes and average SUVs from whole-body PET images.
With the advent of PET/CT, changes in 18F-FDG uptake can now be determined accurately within an anatomically well-defined volume, which allows for establishing a potentially more robust index of TLG. The potential advantage of such an index is that volume measurements could be combined with glucose metabolic assessments of tumor responses.
Whether such measurements of TLG could provide a better readout of treatment effects than could maximum standardized uptake value (SUVmax; single maximum pixel value) (3,4) or mean SUV of a defined volume of interest (SUVmean) (5,6) is currently unknown. Intuitively, the TLG parameter is attractive, because it uses much more of the PET/CT information than does the intensity of 18F-FDG uptake in a single voxel.
The aim of this study was to determine whether combined assessment of volumetric and metabolic measurements (TLG) is superior to individual volumetric or metabolic measurements for predicting histopathologic tumor response in patients with high-grade soft-tissue sarcomas. We selected high-grade soft-tissue sarcomas for this study because these tumors are generally large at diagnosis and demonstrate a high intratumoral heterogeneity in 18F-FDG uptake. Therefore, we hypothesized that maximum tumor 18F-FDG uptake, mean tumor 18F-FDG uptake, and TLG should differ in their ability to assess tumor response to therapy.
One motivation behind the current study was the need for standardizing quantitative PET measurements for treatment response assessments in multicenter trials and in clinical practice. Changes in 18F-FDG SUVs correlate well with tumor responses and patient survival across a variety of tumors (3,7–9). However, standardization of response assessment within and among institutions is lacking. Standardized metabolic response criteria have only been established and accepted in lymphoma (10). Thus, despite increasing evidence of the usefulness of 18F-FDG PET for treatment monitoring, treatment responses are still monitored almost exclusively by measuring changes in tumor size on CT.
MATERIALS AND METHODS
This study included patients with soft-tissue sarcoma who were enrolled prospectively at UCLA. Inclusion criteria were: age greater than 18 y, biopsy-proven soft-tissue sarcoma, a whole-body PET/CT study within 4 wk before the initiation of neoadjuvant therapy (baseline study), a second whole-body PET/CT study after completion of neoadjuvant therapy (posttreatment study), and tumor resection and histologic examination after the posttreatment PET/CT study. To ascertain that CT measurements are reliable and that SUV measurements are not subject to image noise, only patients with well-defined tumor borders on CT and a baseline SUVmax of greater than 2.5 were included. Patients with blood glucose levels of greater than 150 mg/dL were excluded (11). On the basis of these criteria, 20 patients were eligible for this analysis. Patient demographics are provided in Table 1.
TABLE 1.
Clinical, Pathologic, and Treatment Characteristics
| Characteristic | n = 20 |
|---|---|
| Age (y) | |
| Median | 50 |
| Range | 19–86 |
|
| |
| Sex | |
| Male | 10 (50%) |
| Female | 10 (50%) |
|
| |
| Site | |
| Extremity | 16 (80%) |
| Retroperitoneum/abdomen | 1 (5%) |
| Chest/trunk | 3 (15%) |
|
| |
| Neoadjuvant therapy | |
| Chemotherapy | 6 (30%) |
| Chemo−/radiotherapy | 14 (70%) |
|
| |
| Pathologic necrosis | |
| ≥95% (responder) | 6 (30%) |
| <95% (nonresponder) | 14 (70%) |
Briefly, the study population consisted of 10 men and 10 women, with a mean age of 48.9 ± 17.4 y (range, 19–86 y). The most common site of disease was the extremity (n = 16, 80%). Six (30%) patients received systemic chemotherapy (ifofamide/doxorubicin or gemcitabine/docetaxel) alone. Fourteen patients (70%) underwent additional external-beam radiation.
All participants gave written informed consent to participate in this study, which was approved by the UCLA Institutional Review Board.
PET/CT Image Acquisition
Patients were instructed to fast for at least 6 h before 18F-FDG PET to standardize blood glucose and insulin levels. Blood glucose levels were measured before the injection of 18F-FDG. All PET/CT studies were performed on a PET/CT scanner (Biograph Duo; Siemens) comprising an ECAT ACCEL (Siemens) and a dual-detector helical CT scanner. Images were acquired as a single whole-body protocol. For CT, all patients received 700–900 mL of oral contrast (Readi-Cat 2; EZEM) 1 h before the study. Intravenous contrast (iohexol [Omnipaque]; GE Healthcare) was administered to all patients at a rate of 2 mL/s, 30–40 s before imaging commenced. The CT acquisition parameters were 130 kVp, 120 mAs, 1-s rotation, 4-mm slice collimation, 1.3 pitch, and 8 mm/s bed speed. Patients were injected intravenously with 7.77 MBq/kg (0.21 mCi/kg) of 18F-FDG 77 ± 8.7 min before image acquisition. The PET emission scan duration per bed position was 1–5 min, depending on the patient’s body weight as previously described (12,13).
To minimize misregistration between the CT and the PET images, patients were instructed to use shallow breathing during the PET/CT image acquisition (14). The CT images were reconstructed using conventional filtered backprojection, at 3.4-mm axial intervals to match the slice separation of the PET data.
PET images were reconstructed using iterative algorithms (ordered-subset expectation maximization, 2 iterations, 8 subsets) to a final image resolution of 8.8-mm full width at half maximum. A 5-mm full width at half maximum gaussian filter was applied after reconstruction.
To correct for the photon attenuation in PET, the previously published CT-based algorithm was applied (15).
Image Analysis
PET/CT scans were analyzed quantitatively by 1 observer unaware of clinical data and histopathologic response. Baseline and posttreatment PET/CT images were analyzed as follows. A soft-tissue CT window was used to display tumor images on a PET/CT display station (Mirada Workstation; Mirada) for delineation of the sarcomas. Because all tumors were well delineated on CT, tumor volumes were defined on the CT images without using the PET information. In contrast, tumors were frequently difficult to delineate on the posttherapeutic PET images. First, the tumor borders were manually delineated on consecutive axial slices of the CT scan (Fig. 1). Using these regions of interest, the following parameters were calculated: tumor volume in milliliters (CTvol), maximum 18F-FDG uptake (SUVmax) within this volume, and mean 18F-FDG uptake (SUVmean) within this volume. Finally, the TLG index was calculated as CTvol × SUVmean (TLGmean) and CTvol × SUVmax (TLGmax).
FIGURE 1.
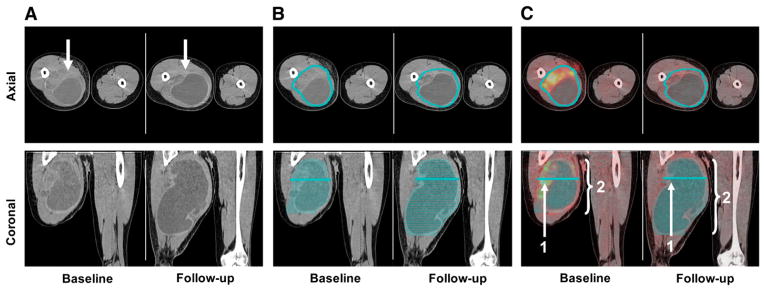
Contrast-enhanced CT images acquired before and after treatment are shown (axial cuts at level of proximal thigh [top] and coronal images [bottom]). (A) Patient with soft-tissue sarcoma located in right proximal thigh (arrow). (B) Regions of interest were placed manually around all axial cuts that included tumor on baseline and follow-up scans. (C) This volume of interest was then used to determine SUVmax (1) and SUVmean (2) within tumor volume.
Histopathology
All specimens were analyzed in a standardized fashion as previously described (16), with masking of PET and CT data. Each specimen was bisected along the greatest diameter, and the perimeter of the tumor was defined. Along with additional randomly sampled areas, the entire cross-sectional area of the bisected tumor was partitioned into 2.0-cm2 (average) blocks and processed for histologic examination. Histopathologic response to therapy was assessed in a manner previously established for soft-tissue sarcomas and quantified as percentage of pathologic necrosis (16). For the purpose of this study, patients with no less than 95% pathologic necrosis (<5% viable tumor cells) were classified as histopathologic responders as previously described (16).
Statistical Analysis
Quantitative data for tumor volume, SUVmean, SUVmax, and TLG are expressed as mean ± 1 SD and range. Intra- and inter-individual comparisons of absolute values and changes were made by the Wilcoxon signed rank and the Mann–Whitney tests, respectively. The SD in the treatment-induced changes of the various studied parameters describes the SD across patients. To determine the diagnostic accuracy of 18F-FDG PET and CT in identifying responders, receiver-operating-characteristic (ROC) curve analysis was used (17). Histopathology was used as the reference standard. The area under the ROC curve (AUC) provides a measure for the accuracy of a diagnostic test. It ranges from 0.5 (random guessing) to 1.0 (perfect test).
All P values are 2-sided and P values of less than 0.05 were considered to be statistically significant. Data were analyzed by using SPSS, version 14.0 (SPSS Inc.), for Windows (Microsoft) and Statistica, version 8.0 (StatSoft, Inc.), for Windows.
RESULTS
Histopathology
On the basis of excised tumor tissue, 6 patients (30%) were classified as histopathologic responders (≥95% necrosis). The mean percentage tumor necrosis was 62.9% ± 30.7%, ranging from 10% to 99%.
PET/CT Findings
The imaging findings are listed in Tables 2 and 3. Baseline SUVmax, SUVmean, CTvol, TLGmean, and TLGmax averaged 11.22 ± 8.23 g/mL, 2.84 ± 1.46 g/mL, 544.14 ± 543.50 mL, 1,619.77 ± 1,837.03 g, and 8,852.85 ± 14,103.66 g, respectively.
TABLE 2.
Imaging Results
| Parameter | Baseline study | Posttreatment study | Changes (%) | |
|---|---|---|---|---|
| Responder | Nonresponder | |||
| SUVmax | 11.22 ± 8.23 (2.52–31.08) | 4.58 ± 3.34* (1.24–14.90) | −77.9 ± 6.9 | −39.5 ± 20.2* |
| SUVmean | 2.84 ± 1.46 (1.05–6.72) | 1.52 ± 0.74* (0.43–3.03) | −70.3 ± 8.5 | −26.9 ± 19.5* |
| CTvol | 544.14 ± 543.50 (18.60–1,913.60) | 532.58 ± 715.35 (8.7–2,663.10) | −7.5 ± 49.5 | −16.3 ± 46.0 |
| TLGmean | 1,619.77 ± 1,837.03 (39.80–6,815.65) | 704.37 ± 831.80* (10.53–2,978.30) | −70.5 ± 23.3 | −32.7 ± 48.1 |
| TLGmax | 8,852.85 ± 14,103.66 (58.96–5,9474.69) | 2,625.82 ± 3,585.97* (16.27–14,316.82) | −77.6 ± 18.6 | −43.2 ± 44.9 |
P values < 0.05.
Data presented are mean ± 1 SD, with range in parentheses.
TABLE 3.
Individual Measurements of Tumor Volume and 18F-FDG Uptake at Baseline and Follow-up
| Patient no. | Baseline
|
Follow-up
|
% viable cells | ||||||||||
|---|---|---|---|---|---|---|---|---|---|---|---|---|---|
| Glu. | Vol. | SUVmean | SUVmax | TLGmean | TLGmax | Glu. | Vol. | SUVmean | SUVmax | TLGmean | TLGmax | ||
| 1 | 91 | 1,355.0 | 5.03 | 20.03 | 6,815.65 | 27,140.65 | 97 | 875.7 | 1.03 | 3.17 | 901.97 | 2,775.97 | 1 |
|
| |||||||||||||
| 2 | 114 | 452.4 | 6.72 | 17.92 | 3,040.13 | 8,107.01 | 134 | 119.0 | 2.13 | 3.69 | 253.47 | 439.11 | 1 |
|
| |||||||||||||
| 3 | 85 | 53.4 | 1.32 | 2.52 | 70.49 | 134.57 | 91 | 52.7 | 1.30 | 2.24 | 68.51 | 118.05 | 50 |
|
| |||||||||||||
| 4 | 123 | 863.1 | 3.14 | 9.58 | 2,710.13 | 8,268.50 | 93 | 1,027.0 | 2.90 | 7.33 | 2,978.30 | 7,527.91 | 20 |
|
| |||||||||||||
| 5 | 87 | 728.1 | 2.52 | 10.41 | 1,834.81 | 7,579.52 | 79 | 805.4 | 2.31 | 7.00 | 1,860.47 | 5,637.80 | 70 |
|
| |||||||||||||
| 6 | 80 | 34.5 | 2.36 | 4.62 | 81.42 | 159.39 | 88 | 8.7 | 1.21 | 1.87 | 10.53 | 16.27 | 15 |
|
| |||||||||||||
| 7 | 93 | 148.9 | 1.21 | 3.59 | 180.17 | 534.55 | 78 | 36.2 | 0.80 | 1.24 | 28.96 | 44.89 | 20 |
|
| |||||||||||||
| 8 | 86 | 156.7 | 1.92 | 4.69 | 300.86 | 734.92 | 108 | 182.5 | 1.95 | 4.19 | 355.88 | 764.68 | 70 |
|
| |||||||||||||
| 9 | 79 | 317.5 | 1.34 | 2.90 | 425.45 | 920.75 | 85 | 226.8 | 0.96 | 1.82 | 217.73 | 412.78 | 40 |
|
| |||||||||||||
| 10 | 97 | 241.2 | 2.10 | 8.60 | 506.52 | 2,074.32 | 85 | 212.2 | 1.18 | 2.66 | 250.40 | 564.45 | 70 |
|
| |||||||||||||
| 11 | 84 | 187.6 | 4.12 | 9.82 | 772.91 | 1,842.23 | 91 | 187.5 | 3.03 | 6.77 | 568.13 | 1,269.38 | 90 |
|
| |||||||||||||
| 12 | 147 | 1,913.6 | 2.60 | 31.08 | 4,975.36 | 59,474.69 | 115 | 2,087.0 | 0.85 | 6.86 | 1,773.95 | 14,316.82 | 5 |
|
| |||||||||||||
| 13 | 100 | 664.0 | 2.86 | 15.82 | 1,899.04 | 10,504.48 | 96 | 646.9 | 0.96 | 4.29 | 621.02 | 2,775.20 | 5 |
|
| |||||||||||||
| 14 | 96 | 101.2 | 4.44 | 15.22 | 449.33 | 1,540.26 | 78 | 84.2 | 0.83 | 2.17 | 69.89 | 182.71 | 5 |
|
| |||||||||||||
| 15 | 86 | 799.5 | 4.60 | 27.24 | 3,677.70 | 21,778.38 | 89 | 115.1 | 1.96 | 14.90 | 225.60 | 1,714.99 | 15 |
|
| |||||||||||||
| 16 | 95 | 1,526.5 | 1.05 | 4.90 | 1,602.83 | 7,479.85 | 69 | 2,663.1 | 0.43 | 1.59 | 1,145.13 | 4,234.33 | 5 |
|
| |||||||||||||
| 17 | 91 | 52.9 | 2.55 | 6.18 | 134.90 | 326.92 | 97 | 50.6 | 1.47 | 2.93 | 74.38 | 148.26 | 70 |
|
| |||||||||||||
| 18 | 93 | 18.6 | 2.14 | 3.17 | 39.80 | 58.96 | 81 | 12.4 | 1.16 | 1.73 | 14.38 | 21.45 | 70 |
|
| |||||||||||||
| 19 | 94 | 838.8 | 2.09 | 17.48 | 1,753.09 | 14,662.22 | 105 | 454.7 | 1.52 | 7.41 | 691.14 | 3,369.33 | 50 |
|
| |||||||||||||
| 20 | 105 | 429.3 | 2.62 | 8.70 | 1,124.77 | 3,734.91 | 86 | 803.9 | 2.46 | 7.69 | 1,977.59 | 6,181.99 | 70 |
Glu. = blood glucose (mg/dL); vol. = volume.
After therapy, these parameters decreased to 4.58 ± 3.34 g/mL, 1.52 ± 0.74 g/mL, 532.58 ± 715.35 mL, 704.37 ± 831.80 g, and 2625.82 ± 3585.97 g, respectively. Changes in SUVmax (P < 0.001), SUVmean (P < 0.001), TLGmean (P = 0.006), and TLGmax (P = 0.001) reached statistical significance, whereas changes in tumor volume did not (P = 0.37).
The data were then stratified by histopathologic response (Fig. 2). Changes in SUVmax and SUVmean (P = 0.001) were significantly more pronounced in responders than in nonresponders. In contrast, TLGmean (P = 0.06), TLGmax (P = 0.09), and CTvol (P = 0.87) changes did not differ significantly between responders and nonresponders. Changes in all measured parameters are listed in Table 2.
FIGURE 2.

Changes in CTvol, SUVmean, SUVmax, TLGmean, and TLGmax are stratified into responders and nonresponders as defined by histopathology. Each patient is represented by 1 box.
ROC Curve Analysis
SUVmean and SUVmax predicted treatment responses (AUC = 1.0 and 0.98, respectively) more accurately than did TLGmean (AUC = 0.77) and TLGmax (AUC = 0.74). CTvol failed to predict treatment responses, with an AUC of 0.48 (Fig. 3).
FIGURE 3.

ROC curve for assessment of histopathologic response by changes in SUVmean, SUVmax, TLGmean, TLGmax, and CTvol.
Correlation Between SUVmax and SUVmean
A high correlation was found for changes in the single maximum pixel value (SUVmax) and changes in the global tumor 18F-FDG uptake (SUVmean) from the baseline to the posttreatment scan (Pearson correlation coefficient = 0.92, P < 0.001; Fig. 4). In contrast, the correlation between SUVmax and SUVmean at the pretreatment and posttreatment scans was only 0.598 and 0.579, respectively.
FIGURE 4.

Graphs show correlations between SUVmax and SUVmean at baseline (A) and at follow-up (B) (Pearson correlation coefficient = 0.598 and 0.579, respectively). (C) Relative changes in SUVmax and SUVmean from baseline to posttreatment scan were closely correlated (Pearson correlation coefficient = 0.92).
DISCUSSION
In this group of patients with high-grade soft-tissue sarcoma, changes in SUVmax and SUVmean were superior to those of TLG for predicting histopathologic tumor responses. Changes in CT-based tumor volumes failed to discriminate between responders and nonresponders. These findings have several implications. First, both SUVmean and SUVmax are well suited to identify responders to neoadjuvant therapy among patients with sarcoma. Second, changes in tumor volume by CT were not useful for identifying treatment responders, casting more doubts on the usefulness of response evaluation criteria in solid tumors (RECIST) (18) in sarcoma treatment evaluations. As a consequence, combining CTvol changes with lesion glycolysis diminished the response information that can be derived from glucose metabolic imaging alone.
A second unexpected finding of our study was that SUVmean and SUVmax provided a similar accuracy for differentiation of histopathologically responding and non-responding tumors. The average tumor volume in this study was more than 500 mL. As shown in Figure 1, the intensity of 18F-FDG uptake within these large tumor volumes was highly heterogenous. In fact, the poor correlation between SUVmax and SUVmean at the time of the baseline scan and at the posttreatment scan reflects the heterogeneity of these tumors at both time points. Nevertheless, changes in SUVmax and SUVmean from the baseline to the follow-up scan were closely correlated (Pearson correlation coefficient = 0.92; P < 0.001). This correlation suggests that neoadjuvant therapy has led to similar relative changes in all voxels. Therefore, the use of SUVmax to assess treatment response is as accurate as measurements of changes of the average 18F-FDG uptake (SUVmean).
The assessment of tumor response to neoadjuvant chemotherapy or chemoradiotherapy by anatomic imaging techniques remains challenging. RECIST, which define partial response as a 30% decrease in the sum of the largest diameter of the target lesions, have failed in several cancers to assess treatment responses accurately (19–21). This failure of CT-based tumor size measurements to separate reliably between responding and nonresponding tumors may be caused by, among others, necrosis, edema, and intratumoral hemorrhage, all of which present as mass and cannot reliably be differentiated from viable tumors. Thus, on the basis of the lack of significant size changes tumors that are actually responding may be classified incorrectly as nonresponding. As evidenced in the current and other studies, this problem is not limited to monitoring the effects of cytostatic treatments (22) but also occurs with established chemotherapy and chemoradiotherapy regimens.
In the original publication of the TLG, Larson et al. (1) proposed that the SUV of a lesion should be multiplied by its volume on PET. Tumor volume on PET was obtained by including voxels with an activity concentration above a certain threshold (1,9,23). In pretreated, homogeneous tumors with high 18F-FDG uptake, this approach is feasible and reproducible. However, we found that in posttherapeutic scans the contrast between tumor 18F-FDG uptake and background or surrounding normal tissue is frequently low. However, more sophisticated segmentation algorithms may be developed that work in the PET image space. This development, in turn, results in overestimated tumor volumes and underestimated tumor mean activity concentration within this volume. For these reasons, we decided to use the CT information to outline tumor borders.
Limitations to this approach exist, because CT-based volume measurements cannot provide information about tumor viability. This is most likely the reason why the introduction of the TLG index derived by PET/CT was less predictive of percentage tissue necrosis than was SUVmax or SUVmean alone. A poor correlation between changes in tumor size and histopathologic response or patient outcome has been described in soft-tissue sarcoma previously (19,24,25). Future studies will have to clarify whether the combined analysis of metabolic and volumetric changes by PET/CT (i.e., TLG) may improve tumor response assessments in other cancers. For example, in esophageal cancer, changes in tumor volume in response to neoadjuvant therapy were correlated with histopathologic tumor response (26). In this situation, a combined analysis of tumor size and volume may improve the accuracy of response assessment.
CONCLUSION
Our study indicates that in soft-tissue sarcomas, changes in SUVmax are as accurate for assessment of tumor response as more sophisticated parameters, such as TLG. The high correlation between changes in SUVmax and changes in SUVmean suggest that decreases and increases in SUVmax are representative of changes in average tumor 18F-FDG uptake. Therefore, a sophisticated delineation of tumor extension may not be necessary for response assessment by 18F-FDG PET.
References
- 1.Larson SM, Erdi Y, Akhurst T, et al. Tumor treatment response based on visual and quantitative changes in global tumor glycolysis using PET-FDG imaging: the visual response score and the change in total lesion glycolysis. Clin Positron Imaging. 1999;2:159–171. doi: 10.1016/s1095-0397(99)00016-3. [DOI] [PubMed] [Google Scholar]
- 2.Beyer T, Townsend DW, Brun T, et al. A combined PET/CT scanner for clinical oncology. J Nucl Med. 2000;41:1369–1379. [PubMed] [Google Scholar]
- 3.Pottgen C, Levegrun S, Theegarten D, et al. Value of 18F-fluoro-2-deoxy-D-glucose-positron emission tomography/computed tomography in non-small-cell lung cancer for prediction of pathologic response and times to relapse after neoadjuvant chemoradiotherapy. Clin Cancer Res. 2006;12:97–106. doi: 10.1158/1078-0432.CCR-05-0510. [DOI] [PubMed] [Google Scholar]
- 4.Schelling M, Avril N, Nahrig J, et al. Positron emission tomography using [18F]fluorodeoxyglucose for monitoring primary chemotherapy in breast cancer. J Clin Oncol. 2000;18:1689–1695. doi: 10.1200/JCO.2000.18.8.1689. [DOI] [PubMed] [Google Scholar]
- 5.Eschmann SM, Friedel G, Paulsen F, et al. 18F-FDG PET for assessment of therapy response and preoperative re-evaluation after neoadjuvant radio-chemotherapy in stage III non-small cell lung cancer. Eur J Nucl Med Mol Imaging. 2007;34:463–471. doi: 10.1007/s00259-006-0273-5. [DOI] [PubMed] [Google Scholar]
- 6.Cascini GL, Avallone A, Delrio P, et al. 18F-FDG PET is an early predictor of pathologic tumor response to preoperative radiochemotherapy in locally advanced rectal cancer. J Nucl Med. 2006;47:1241–1248. [PubMed] [Google Scholar]
- 7.Schuetze SM, Rubin BP, Vernon C, et al. Use of positron emission tomography in localized extremity soft tissue sarcoma treated with neoadjuvant chemotherapy. Cancer. 2005;103:339–348. doi: 10.1002/cncr.20769. [DOI] [PubMed] [Google Scholar]
- 8.Wieder HA, Brucher BL, Zimmermann F, et al. Time course of tumor metabolic activity during chemoradiotherapy of esophageal squamous cell carcinoma and response to treatment. J Clin Oncol. 2004;22:900–908. doi: 10.1200/JCO.2004.07.122. [DOI] [PubMed] [Google Scholar]
- 9.Hoekstra CJ, Stroobants SG, Smit EF, et al. Prognostic relevance of response evaluation using [18F]-2-fluoro-2-deoxy-D-glucose positron emission tomography in patients with locally advanced non-small-cell lung cancer. J Clin Oncol. 2005;23:8362–8370. doi: 10.1200/JCO.2005.01.1189. [DOI] [PubMed] [Google Scholar]
- 10.Juweid ME, Stroobants S, Hoekstra OS, et al. Use of positron emission tomography for response assessment of lymphoma: consensus of the Imaging Subcommittee of International Harmonization Project in Lymphoma. J Clin Oncol. 2007;25:571–578. doi: 10.1200/JCO.2006.08.2305. [DOI] [PubMed] [Google Scholar]
- 11.Shankar LK, Hoffman JM, Bacharach S, et al. Consensus recommendations for the use of 18F-FDG PET as an indicator of therapeutic response in patients in National Cancer Institute Trials. J Nucl Med. 2006;47:1059–1066. [PubMed] [Google Scholar]
- 12.Halpern BS, Dahlbom M, Quon A, et al. Impact of patient weight and emission scan duration on PET/CT image quality and lesion detectability. J Nucl Med. 2004;45:797–801. [PubMed] [Google Scholar]
- 13.Halpern BS, Dahlbom M, Auerbach MA, et al. Optimizing imaging protocols for overweight and obese patients: a lutetium orthosilicate PET/CT study. J Nucl Med. 2005;46:603–607. [PubMed] [Google Scholar]
- 14.Beyer T, Antoch G, Muller S, et al. Acquisition protocol considerations for combined PET/CT imaging. J Nucl Med. 2004;45(suppl 1):25S–35S. [PubMed] [Google Scholar]
- 15.Kinahan PE, Townsend DW, Beyer T, Sashin D. Attenuation correction for a combined 3D PET/CT scanner. Med Phys. 1998;25:2046–2053. doi: 10.1118/1.598392. [DOI] [PubMed] [Google Scholar]
- 16.Eilber FC, Rosen G, Eckardt J, et al. Treatment-induced pathologic necrosis: a predictor of local recurrence and survival in patients receiving neoadjuvant therapy for high-grade extremity soft tissue sarcomas. J Clin Oncol. 2001;19:3203–3209. doi: 10.1200/JCO.2001.19.13.3203. [DOI] [PubMed] [Google Scholar]
- 17.Hanley JA, McNeil BJ. A method of comparing the areas under receiver operating characteristic curves derived from the same cases. Radiology. 1983;148:839–843. doi: 10.1148/radiology.148.3.6878708. [DOI] [PubMed] [Google Scholar]
- 18.Therasse P, Arbuck SG, Eisenhauer EA, et al. New guidelines to evaluate the response to treatment in solid tumors. European Organization for Research and Treatment of Cancer, National Cancer Institute of the United States, National Cancer Institute of Canada. J Natl Cancer Inst. 2000;92:205–216. doi: 10.1093/jnci/92.3.205. [DOI] [PubMed] [Google Scholar]
- 19.Evilevitch V, Weber WA, Tap WD. Reduction of glucose metabolic activity is more accurate than change in size at predicting histopathologic response to neoadjuvant therapy in high-grade soft-tissue sarcomas. Clin Cancer Res. 2008;14:715–720. doi: 10.1158/1078-0432.CCR-07-1762. [DOI] [PubMed] [Google Scholar]
- 20.Ceresoli GL, Chiti A, Zucali PA, et al. Assessment of tumor response in malignant pleural mesothelioma. Cancer Treat Rev. 2007;33:533–541. doi: 10.1016/j.ctrv.2007.07.012. [DOI] [PubMed] [Google Scholar]
- 21.Goffin J, Baral S, Tu D, Nomikos D, Seymour L. Objective responses in patients with malignant melanoma or renal cell cancer in early clinical studies do not predict regulatory approval. Clin Cancer Res. 2005;11:5928–5934. doi: 10.1158/1078-0432.CCR-05-0130. [DOI] [PubMed] [Google Scholar]
- 22.Choi H, Charnsangavej C, Faria SC, et al. Correlation of computed tomography and positron emission tomography in patients with metastatic gastrointestinal stromal tumor treated at a single institution with imatinib mesylate: proposal of new computed tomography response criteria. J Clin Oncol. 2007;25:1753–1759. doi: 10.1200/JCO.2006.07.3049. [DOI] [PubMed] [Google Scholar]
- 23.McDermott GM, Welch A, Staff RT, et al. Monitoring primary breast cancer throughout chemotherapy using FDG-PET. Breast Cancer Res Treat. 2007;102:75–84. doi: 10.1007/s10549-006-9316-7. [DOI] [PubMed] [Google Scholar]
- 24.Pisters PW, Patel SR, Varma DG, et al. Preoperative chemotherapy for stage IIIB extremity soft tissue sarcoma: long-term results from a single institution. J Clin Oncol. 1997;15:3481–3487. doi: 10.1200/JCO.1997.15.12.3481. [DOI] [PubMed] [Google Scholar]
- 25.Kraybill WG, Harris J, Spiro IJ, et al. Phase II study of neoadjuvant chemotherapy and radiation therapy in the management of high-risk, high-grade, soft tissue sarcomas of the extremities and body wall: Radiation Therapy Oncology Group Trial 9514. J Clin Oncol. 2006;24:619–625. doi: 10.1200/JCO.2005.02.5577. [DOI] [PubMed] [Google Scholar]
- 26.Beer AJ, Wieder HA, Lordick F, et al. Adenocarcinomas of esophagogastric junction: multi-detector row CT to evaluate early response to neoadjuvant chemotherapy. Radiology. 2006;239:472–480. doi: 10.1148/radiol.2391050043. [DOI] [PubMed] [Google Scholar]