

Abstract
The objectives of this work were (i) to characterize the pharmacokinetics of cefazolin in pregnant women undergoing elective cesarean delivery and in their neonates; (ii) to assess cefazolin transplacental transmission; (iii) to evaluate the dosing and timing of preoperative, prophylactic administration of cefazolin to pregnant women; and (iv) to investigate the impact of maternal dosing on therapeutic duration and exposure in newborns. Twenty women received 1 g of cefazolin preoperatively. Plasma concentrations of total cefazolin were analyzed from maternal blood samples taken before, during, and after delivery; umbilical cord blood samples obtained at delivery; and neonatal blood samples collected 24 h after birth. The distribution volume of cefazolin was 9.44 liters/h. The values for pre- and postdelivery clearance were 7.18 and 4.12 liters/h, respectively. Computer simulations revealed that the probability of maintaining free cefazolin concentrations in plasma above 8 mg/liter during scheduled caesarean surgery was <50% in the cord blood when cefazolin was administered in doses of <2 g or when it was administered <1 h before delivery. Therapeutic concentrations of cefazolin persisted in neonates >5 h after birth. Cefazolin clearance increases during pregnancy, and larger doses are recommended for surgical prophylaxis in pregnant women to obtain the same antibacterial effect as in nonpregnant patients. Cefazolin has a longer half-life in neonates than in adults. Maternal administration of up to 2 g of cefazolin is effective and produces exposure within clinically approved limits in neonates.
INTRODUCTION
Cefazolin is a first-generation cephalosporin that is active against a wide range of Gram-positive bacteria and some Gram-negative bacteria (1). Cefazolin is the standard prophylactic antimicrobial agent for a variety of surgical interventions, including cesarean delivery. Administration of prophylactic cefazolin before skin incision is associated with a significant reduction in both endometritis and total postcesarean infectious morbidity, compared with administration after umbilical cord clamping (2–4). In general, the antibacterial activity of β-lactams in vitro depends on the duration of time that the free concentration remains above the MIC (5). This class of antibiotics is efficacious in vivo when the free concentration of the drug exceeds the target MIC for 60 to 70% of the dosing interval (6) or for the entire operation in surgical prophylaxis (7). Therefore, it is essential to optimize the dosing level and timing of preoperative administration of cefazolin to achieve effective antimicrobial protection from skin incision to skin closure.
Cefazolin sodium is a water-soluble drug (8), with high plasma protein binding in therapeutic concentrations, restricted distribution to the extracellular fluid, and extensive renal excretion (9, 10). Some reports have documented rapid placental passage of intravenously (i.v.) administered cefazolin to umbilical cord blood and amniotic fluid (11, 12). Compared with adults, neonates are characterized by reduced plasma protein binding capacity (13), large extracellular water fraction (14), and immature renal function (15). Hence, administration of cefazolin before cord clamping may be associated with a risk of adverse events in newborn infants. In contrast, transplacental passage of cefazolin may potentially decrease the incidence of neonatal sepsis. Cefazolin has recently been suggested as an effective alternative to vancomycin in the treatment of infants with coagulase-negative staphylococcal sepsis (16). However, there is no information on maternal dosing schemes to produce optimal safety and efficacy in neonates.
The American Congress of Obstetricians and Gynecologists has issued guidelines for administering cefazolin for perioperative prophylaxis during cesarean delivery (17). A literature search failed to identify studies addressing the population pharmacokinetics (PK) of cefazolin during cesarean delivery, but it did detect some reports based on individual compartmental and noncompartmental PK analyses (11, 12, 18). Only one study has investigated cefazolin disposition in neonates (19).
We conducted the current study (i) to characterize the PK of cefazolin in pregnant women undergoing elective cesarean delivery and in their neonates; (ii) to assess cefazolin transplacental transmission; (iii) to evaluate the dosing and timing of preoperative, prophylactic administration of cefazolin to pregnant women; and (iv) to investigate the impact of maternal dosing on therapeutic duration and exposure in newborns using a population-based, PK-pharmacodynamic (PD) modeling approach.
MATERIALS AND METHODS
Patients, cefazolin dosing, and sampling.
Following Stanford University Institutional Review Board (IRB) approval, 20 healthy women undergoing elective cesarean delivery and their neonates were enrolled in this prospective, open-label study conducted at Stanford's Lucile Packard Children's Hospital. Informed consent was obtained from the mothers at the time of anesthesia evaluation. The mother and father (if possible) provided informed consent for the neonates.
Each pregnant woman received 1 g of cefazolin within 1 h before skin incision as per standard clinical practice. Maternal blood samples were taken before the cefazolin was administered and 10 min and 25 min following administration, at delivery, and 2 h and 6 h postdelivery. A venous blood sample was obtained from the umbilical cord at delivery. The blood samples were centrifuged immediately following collection, and the plasma was separated and frozen for batched assay. Dried blood spots (DBSs) were obtained from the neonates 24 h after birth using a heel prick for capillary blood according to the Clinical and Laboratory Standards Institute's (CLSI) newborn screening guidelines (20).
Analytical method. (i) Chemicals and reagents.
Cefazolin and the internal standard ondansetron-D3 were purchased from Toronto Research Chemical, Inc. High-performance liquid chromatography (HPLC)-grade water, methanol, acetonitrile, and dimethyl sulfoxide (DMSO) were used for sample extraction and as the mobile phase (Fisher Scientific, Fairlawn, NJ). Standard stock solutions of cefazolin (1 mg/ml) were prepared by dissolving the pure compound in DMSO. Stock solutions were stored at −20°C. Standard solutions of cefazolin were prepared by diluting a 0.4-mg/ml stock solution of cefazolin 3-fold with DMSO.
(ii) Preparation of calibration standards and quality control samples.
Human K2EDTA plasma and DBS calibration and quality control standards of cefazolin were prepared by adding the working standard solution of 2.5 μl of cefazolin to 50 μl of drug-free human EDTA plasma or blood (1:20 [vol/vol]).
(iii) Plasma sample preparation.
To prepare the plasma samples, 300 μl of acetonitrile containing the internal standard ondansetron-D3 at a concentration of 100 ng/ml were added to samples. Samples were vortexed for 2.5 min and centrifuged at 13,000 × g for 5 min at 4°C. After the samples were centrifuged, supernatants were transferred into a 96-well plate. The standard curve range was from 82.3 to 20,000 ng/ml.
(iv) DBS sample preparation.
To prepare the DBS samples, 50-μl samples of spiked blood were transferred onto Whatman 903 filter paper cards and left to dry for 1 h. The DBSs were then punched (6.4 mm in diameter, containing 20 μl of blood) and reconstituted with 100 μl of HPLC-grade water. Added to the cefazolin samples were 50 μl of the protein precipitation solution of methanol and 0.2 M ZnSO4 (7:3, vol/vol), which contained the internal standard ondansetron-D3 at a concentration of 50 ng/ml and 10 ng/ml. The samples were vortexed for 2.5 min and centrifuged at 8,000 × g for 5 min at 4°C. After the samples were centrifuged, supernatants were transferred into HPLC vials. The calibration curve range for cefazolin was from 27.4 to 20,000 ng/ml.
(v) HPLC-MS/MS analysis.
An LC-MS/MS (liquid chromatography coupled to tandem mass spectrometry) system analyzed the extracts: 10 μl of the sample supernatant was injected onto an analytical column. A gradient was run from 95% solvent A to 95% solvent B over 2 min. The mobile phase was solvent A (0.1% formic acid in acetonitrile) and solvent B (0.1% formic acid in water). The flow was 1 ml/min with a 5.0-min run time. An Agilent 1100 Series HPLC system was interfaced with the Sciex API5000 tandem quadruple mass spectrometer with a positive electrospray ionization (ESI) source. The mass spectrometer was run with positive multiple reaction monitoring (MRM). For cefazolin, the following ion transition was monitored: m/z = 455.1 [M+H]+ → 155.9 and 297.4 [M+H]+ → 173.3 to determine the ondanstetron-D3 internal standard. The total run time was 5 min, and the HPLC and mass spectrometer were controlled by the Analyst Software (version 1.4.1). The mean intraday assay variability (percent coefficient of variation [CV%]), and accuracy (percentage of nominal concentration) for 6 replicates determined at low, medium, and high quality control levels ranged from 3.8 to 5.5% and 100.9 to 106.3%, respectively. Across the three quality control levels, the mean interday variability and accuracy (n = 9) ranged from 7.8 to 14.8% and 96.8 to 107.6%, respectively.
Population pharmacokinetic analysis. (i) Modeling strategy.
Figure 1 shows the PK model used to simultaneously analyze the cefazolin total concentration-time data in the maternal blood (CM), umbilical cord blood (CUC), and neonatal blood (CN). A one-compartment linear disposition model parameterized in terms of distribution volume (V) and pregnancy-adjusted clearance (CL = CLpreg during pregnancy and CLpostpreg after pregnancy) was used to describe the data for the women. The cord (fetal unit) plasma concentrations were fitted to an effect compartment linked to the maternal compartment by a first-order equilibration rate constant (Keq). After delivery, the effect compartment evolved to a neonatal compartment with a distinct first-order elimination pathway (KN0). The PK model in neonates was based on the following assumptions. (i) Cefazolin concentrations in cord and fetal blood are at equilibrium (i.e., initial concentration in neonates = concentration in cord blood at delivery). (ii) The initial concentration in neonates declines in a single-exponential pattern after birth (i.e., one-compartment model). (iii) The blood-to-plasma ratio is 1.
FIG 1.
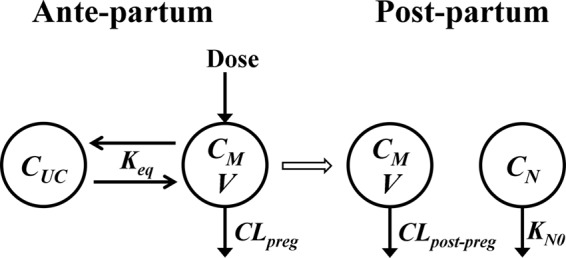
Pharmacokinetic model for cefazolin disposition in pregnant women and their neonates. CM, CUC, and CN denote concentration in the blood of mothers, umbilical cord, and neonates, respectively. CLpreg and CLpostpreg denote clearance during and after pregnancy, respectively. V is the maternal volume of distribution. Keq is the mother-to-cord equilibration rate constant, and KN0 is the neonatal elimination rate constant.
We analyzed total cefazolin concentration-time data using the nonlinear mixed-effects modeling software program NONMEM (version VII; Icon Development Solutions, Ellicott City, MD). The first-order conditional estimation (FOCE) with η-ε interaction was used for the estimation of the model parameters. The convergence criterion was three significant digits. The model was specified using NONMEM general differential equation solver ADVAN6 TOL5. The model was defined using the following differential equations (equations 1 to 3):
| (1) |
| (2) |
| (3) |
where MPAST is NONMEM's time event parameter (MPAST = 0 during pregnancy and MPAST = 1 after pregnancy). The initial conditions were as follows:
| (4) |
| (5) |
Interindividual variability was modeled exponentially under the assumption that the PK parameters are log normally distributed with diagonal variance-covariance matrix. Proportional and combined additive and proportional models of residual (intraindividual) variability for PK observations were evaluated.
We adopted a sequential approach to search for the optimal base model. Using the maternal plasma concentrations, we initially evaluated one- and two-compartment structural models for the mothers. Then we tested the effect of adjusting CL or V during pregnancy. In the second stage, the cord plasma concentrations were integrated to the maternal concentrations, and we evaluated three models for the fetal unit: (i) one-parameter effect compartment (mother-to-fetus and fetus-to-mother equilibration rate constants are equal); (ii) two-parameter effect compartment (mother-to-fetus and fetus-to-mother equilibration rate constants are not equal); and (iii) additional compartment in mammillary connection with the maternal compartment. The effect compartment assumes that the fetal unit behaves as a virtual compartment that does not alter the compartment model in the mothers. The mammillary connection is based on the hypothesis that the fetal unit contributes to the drug transfer processes in the maternal unit. Selection between competing models was based on (i) the Akaike information criterion (AIC) (21), computed as two times the number of model-estimated parameters added to the NONMEM minimum objective function (−2 log likelihood) value (OFV); and on (ii) the precision of parameter estimates, expressed as the relative standard error (percent standard error [%SE]) and calculated as the percentage of the standard error provided by NONMEM $COVARIANCE step to the parameter estimate.
One cord observation and one neonatal observation were available for each individual, precluding the possibility of discriminating between inter- and intrasubject random effects. For cord data, we tested two approaches: (i) using a single level of error (the residual variability); and (ii) using two levels of error with residual variability assumed to be equal to that in the mothers' blood. For neonatal data, we used only residual variability.
Once the base population model was selected, the influence of maternal weight at delivery, neonatal weight at birth, maternal age, gestational age, neonatal gender, and ethnicity on the estimates of CL, V, and Keq was investigated using stepwise forward addition and likelihood ratio testing at significance level of 1%. The relationship between a continuous covariate and a PK parameter was modeled as linear, exponential, or power functions after centering or normalization of the covariate using the corresponding mean value in the population studied. For categorical covariates, the relationship was formulated to obtain a specific parameter estimate for each group.
(ii) Model evaluation.
We evaluated quality of fit using the final model by visually inspecting the observed and predicted concentrations versus time, observed versus predicted concentrations, and conditional weighted residuals versus population predictions and time. The precision of the final model parameters was assessed by computing the 2.5th, 50th, and 97.5th percentiles of 1,000 bootstrap data sets, each with the same number of subjects as in the original data set. The bootstrap was stratified by delivery time, where individuals were randomly sampled with replacement from 5 delivery time groups: ≤0.75 h, 0.76 to 1.0 h, 1.01 to 1.25 h, 1.26 to 1.5 h, and >1.5 h. The nonparametric bootstrapping was automated using Perl-speaks-NONMEM (22).
Confidence interval visual predictive check (VPC) (23) was conducted to evaluate how well the final model predicted the distribution of measured cefazolin concentrations from a single administration (only one observation was ignored in the analysis). The final model was used to simulate 1,000 replicates of a data set having the same characteristics as the observed data set (i.e., the number of subjects, sampling times, doses, and delivery times) using NONMEM. The 5th, 50th, and 95th percentiles of the simulated concentrations were calculated for each data set. Then for these percentiles, the 95% confidence intervals across the 1,000 replicates were computed and compared graphically to the 5th, 50th, and 95th percentiles of the observed data. As a result of little data, it was not feasible to establish distributions for cord or neonatal observed concentrations. Therefore, a scatter VPC was constructed by overlaying the 5th, 50th, and 95th percentiles of the simulated concentrations at each time point over the observed data. Additional simulation records were included in the data set to capture the predelivery concentrations in the cord compartment and the exponential decay in the neonate compartment as characterized by the model.
(iii) Influential point analysis.
Two cord observations and one neonatal observation seemed to be much larger than the rest of the data points. To assess the influence of these data points on the population model fitted curve, Cook's distance (D) (24), commonly used in least-squares regression analysis, was calculated using equation 6:
| (6) |
where PREDi and PREDi(−p) are the population predictions for the ith observation before and after exclusion of the points under investigation (p), respectively, RESi is residual error for the ith observation, and n is the number of observations. The points were considered influential if D was >1 (25).
(iv) Simulation.
We performed a simulation study to evaluate cefazolin dosing schemes in cesarean delivery prophylaxis and their impact on exposure and therapeutic duration in newborns. The final population model parameter estimates (fixed effects, between subject, and residual variability) were used to simulate individual plasma total and free drug concentration-time profiles in 1,000 pregnant women and their neonates following the intravenous administration of 1 to 2 g cefazolin 15 to 120 min before the scheduled cesarean delivery. The surgery duration was assumed to be 1 h. Protein binding in pregnant women and neonates was set at 75% and 49%, respectively, based on published reports (19, 27). We calculated the probability of maintaining free drug concentrations in plasma of ≥8 mg/liter (the MIC for susceptible Gram-positive bacteria [26]) in maternal and cord blood during delivery. We also computed the area under the total concentration-time curve from 0 to 36 h (AUC0–36) and the duration of free cefazolin concentration in plasma ≥ MIC in neonates. Simulations were performed using NONMEM and were then replicated 100 times.
RESULTS
The population PK analysis included data from 20 parturient women and 19 of their neonates. Table 1 summarizes the demographic characteristics of the patients. In total, 98 maternal blood samples, 19 umbilical cord blood samples, and 19 neonatal total cefazolin concentrations were available for analysis. The median observed concentration in the mothers was 44.3 μg/ml (range, 1.4 to 141 μg/ml) following a 1-g bolus. Cefazolin readily crossed the placenta with a median observed cord blood concentration at delivery of 20.4 μg/ml (range, 6.14 to 92.5 μg/ml) and a neonatal concentration of 0.626 μg/ml (range, 0.186 to 3.7 μg/ml) 24 h after birth. At delivery, the median observed cord blood concentration-to-maternal concentration ratio was 0.41 (range, 0.21 to 1.45). Three samples (one each of the maternal, cord, and neonatal blood samples) were excluded from the analysis because they were below the lower quantification limit.
TABLE 1.
Demographic characteristics of the patients
| Patient characteristic | Mean (SD) | Range |
|---|---|---|
| Maternal age (yr) | 32.5 (5.3) | 23–43 |
| Maternal wt at delivery (kg) | 79.3 (8.26) | 62–93 |
| Maternal ht (cm) | 162 (6.14) | 150–175 |
| Gestation period (wk) | 39.1 (0.855) | 36.4–40.4 |
| Delay between last drug administration and delivery (h) | 1.10 (0.462) | 0.20–2.28 |
| Ethnicity (no. of Hispanic patients/no. of non-Hispanic patients) | 6/14 | |
| Neonatal wt at birth (kg) | 3.47 (0.5) | 2.47–4.30 |
| Neonatal ht at birth (cm) | 50.6 (2.17) | 46–55 |
| Neonate gender (no. of males/no. of females) | 10/10 |
The AIC for the maternal two-compartment model was slightly lower than that for the one-compartment model (612 versus 615). However, the %SE for some of the two-compartment model parameters was >70, suggesting that the current data were not sufficient to precisely estimate the extra parameters for the model. Using the one-compartment model and adjusting the volume of distribution (V) during pregnancy increased the AIC by 3 points. In contrast, pregnancy-adjusted clearance (CL) significantly improved the model fit, resulting in a 12-point reduction in the one-compartment AIC value. In addition, the latter model parameters were precisely estimated with %SE of <8. Taking these findings into account, we selected a one-compartment model with pregnancy-adjusted clearance (CL = CLpreg during pregnancy and CL = CLpostpreg after pregnancy) to be the structural model for cefazolin PK in the mothers.
We tested the following three models as structural model candidates for the umbilical cord concentration: (i) one-parameter effect compartment, (ii) two-parameter effect compartment, and (iii) additional compartment in mammillary connection with the maternal compartment. The AIC values for the three models were 738, 738, and 740, respectively, suggesting that a one-parameter effect compartment model is adequate for the cord data.
The NONMEM minimum objective function value (OFV) did not change by using a combined proportional and additive residual error model. Therefore, we used a proportional model.
The available data were not sufficient to estimate intersubject variability for V. Because only one cord observation and one neonatal observation were available for each subject, it was not possible to estimate intersubject variability for the mother-to-fetus equilibration rate constant (Keq) or the neonatal elimination rate constant (KN0). Assuming a constant residual error variance across maternal and cord observations, between-subject variability could be estimated for Keq with a significant reduction in OFV (from 737.6 to 708.1). This assumption is valid because we assayed maternal and cord blood concentrations at delivery time simultaneously using the same method.
We tested the effects of maternal weight at delivery, neonatal weight at birth, maternal age, gestational age, neonatal gender, and ethnicity on CL and Keq. None of these parameters had a significant effect.
Table 2 lists the final population PK model parameter estimates with their associated %SE, bootstrap median, and nonparametric 95% confidence intervals. The point estimates from the original data set were very similar to the median values obtained from the bootstrap analysis, indicating the stability and robustness of the population PK model. The maternal clearance and distribution volume and the neonatal elimination rate constant were estimated with good precision (%SE < 8). Moreover, the 95% confidence intervals for these parameters were narrow, confirming their high estimation precision. The mother-to-fetus equilibration rate constant was less precisely estimated (%SE = 24), which can be attributed to the relatively short duration between drug administration and delivery (<2.5 h). This narrow range was dictated by the fact that cord blood can be sampled without special invasive techniques only at the delivery time. The limited time range necessitated stratification of bootstrap by delivery time. Parameter precisions corresponding to between-subject variability were relatively low, with %SE of >50. However, the 95% confidence intervals obtained from the bootstrap analysis suggest that the between-subject random effects exhibited non-Gaussian distribution around the point estimates.
TABLE 2.
Cefazolin population pharmacokinetic parameter estimates and bootstrap statistics using the final pharmacokinetic modela
| Parameter | Original data |
Bootstrap replicates |
||
|---|---|---|---|---|
| Point estimate | %SE | Median | 95% CI | |
| CL (liters/h) | ||||
| CLpreg | 7.18 | 7.8 | 7.11 | 6.13, 8.17 |
| CLpostpreg | 4.12 | 7.7 | 4.12 | 3.58, 4.80 |
| V (liters) | 9.44 | 7.1 | 9.43 | 8.36, 11.02 |
| Keq (h−1) | 0.340 | 24 | 0.329 | 0.229, 0.558 |
| KN0 (h−1) | 0.136 | 5.2 | 0.135 | 0.116, 0.151 |
| ω2CL (%CV) | 0.036 (19) | 54 | 0.033 | 0.008, 0.067 |
| ω2Keq (%CV) | 0.637 (80) | 53 | 0.541 | 0.019, 1.174 |
| σ2mother + cord (%CV) | 0.090 (30) | 33 | 0.085 | 0.043, 0.143 |
| σ2neonate (%CV) | 0.239 (49) | 31 | 0.247 | 0.113, 0.689 |
Abbreviations: %SE, percent relative standard error; 95% CI, 95% confidence interval; CL, maternal clearance; CLpreg and CLpostpreg, clearance during and after pregnancy, respectively; V, maternal distribution volume; Keq, mother-to-cord equilibration rate constant; KN0,[ι] neonatal elimination rate constant; ω2, variance of between-subject random effects; CV, coefficient of variation; σ2, variance of residual error.
The analysis results shown in Table 2 suggest the following. (i) Cefazolin clearance increases by 74% during pregnancy. (ii) The elimination half-life of cefazolin in newborns is 3 times longer than that in nonpregnant adults (5 h versus 1.6 h). (iii) The cefazolin equilibration half-life between mothers and their fetuses is 2 h. (iv) Large between-subject variability exists in the umbilical cord concentrations.
Basic goodness-of-fit plots of the final population PK model are depicted in Fig. 2 to 4. The symmetric distribution of observed cefazolin concentrations as a function of population predictions around the identity line, as well as the good agreement between observed and individual predicted concentrations (Fig. 2) indicate that the model fit the data well at the population and subject levels. The plot of conditional weighted residuals versus population predicted concentrations (Fig. 3) or time (Fig. 4) showed random distribution around the line of zero, indicating a lack of any patterns in the model fit across the concentration or time ranges in this study.
FIG 2.
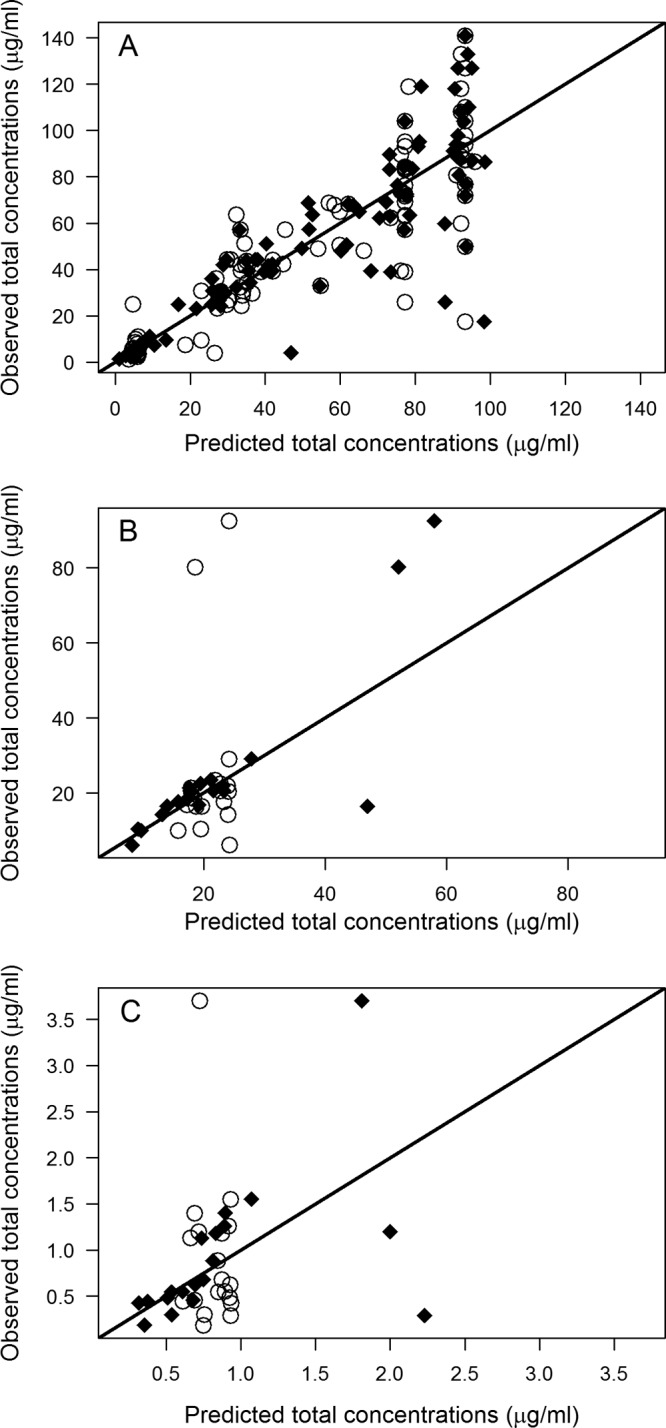
Cefazolin observed versus population (open circles) and individual (closed squares) predicted total concentrations in maternal (A), cord (B), and neonatal (C) blood. The identity line is shown.
FIG 4.
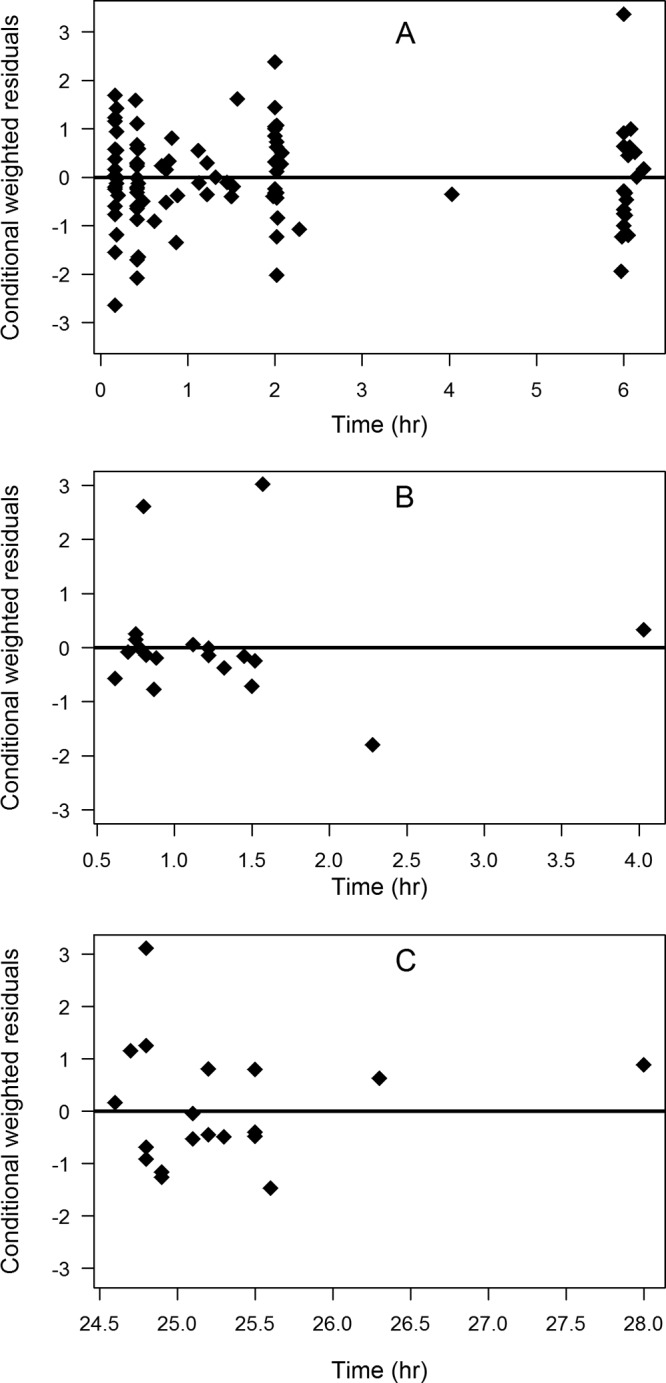
Conditional weighted residuals versus time (in hours) in maternal (A), cord (B), and neonatal (C) blood. The zero line is shown.
FIG 3.
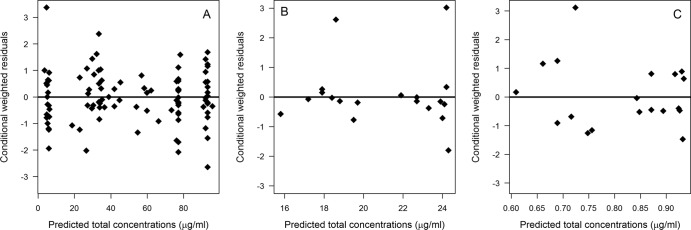
Conditional weighted residuals versus population predicted cefazolin total concentrations in maternal (A), cord (B), and neonatal (C) blood. The zero line is shown.
The visual predictive check of the final population PK model in mothers (Fig. 5) shows the predicted 5th, 50th, and 95th percentiles from 1,000 simulations as well as from the observed concentrations as a function of time. The observed concentration percentiles were consistently within the 95% confidence intervals of the simulated percentiles of the concentrations. This finding suggests that the model can adequately replicate the features of the observed data and confirms that the variability parameters were well estimated. For cord and neonatal data (Fig. 6), most of the observed concentrations were randomly scattered around the predicted median concentration from the 1,000 simulations. Only two cord samples and one neonatal sample were above the 95th prediction interval, suggesting that variability was reasonably estimated. The patients to whom the very high data points in Fig. 6 belonged did not have distinguishable demographic or clinical characteristics. Additionally, these samples were assayed twice to make sure that there was no measurement error. Accordingly, there was no evidence that the wide 90% prediction interval in Fig. 6A does not reflect “true” large interindividual variability in Keq. Running an influential point analysis using Cook's distance failed to detect a statistically considerable effect for these points on the model population predictions.
FIG 5.
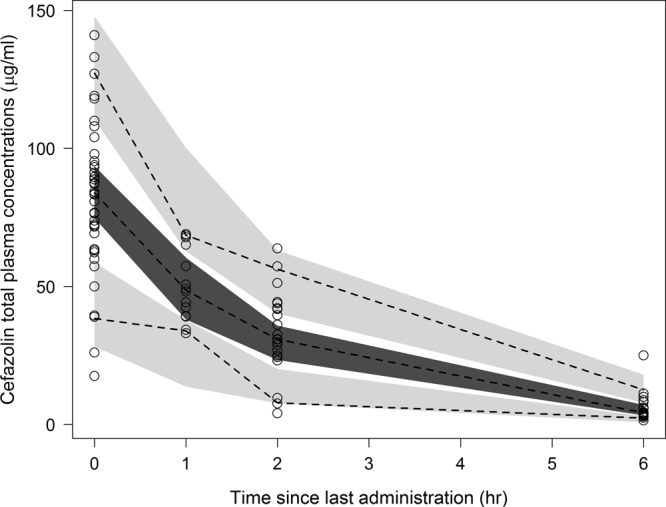
Visual predictive check of the final pharmacokinetic model for total cefazolin plasma concentrations in maternal blood. The dashed lines represent the 5th, 50th, and 95th percentiles of observed concentrations. The shaded areas represent the 95% confidence interval (95% CI) for the 5th, 50th, and 95th percentiles of simulated concentrations. The circles represent the binned observed concentrations.
FIG 6.
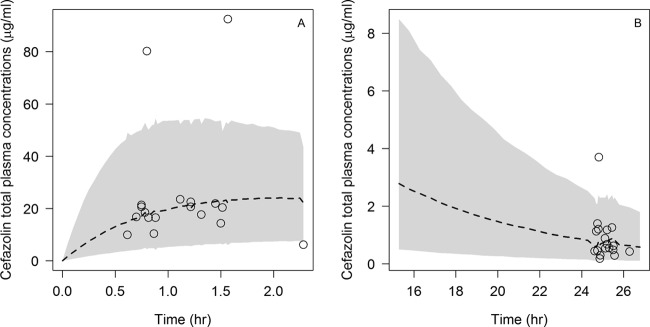
Visual predictive check of the final pharmacokinetic model showing comparison between the median (dashed line) and 90% prediction interval (shaded area) obtained from 1,000 simulations and the observed data (circles) for cefazolin total concentrations in cord (A) and neonatal (B) blood.
Following different dosing schemes, we simulated free cefazolin concentration-time profiles in 1,000 virtual mothers with their cords, using the final population PK model. The goal of the simulations was to evaluate the ability of different dosing levels (1 to 2 g) and administration times (15 to 120 min) to maintain free cefazolin concentrations in mothers and cord blood during an assumed 1-h surgery period above the MIC for susceptible Gram-positive bacteria (8 mg/liter) (26). The joint success in mothers and cord blood is shown in Fig. 7. The joint probability increases linearly with the dose, but it shows quadratic dependence on the lag time between administration and surgery. Two grams of cefazolin administered intravenously 60 min before surgery was associated with the highest target attainment rate (42%). Because the surgery period was assumed to be 1 h, for longer operations, the 2 g must be redosed every 2 h until delivery to maintain the joint success rate of >42%.
FIG 7.
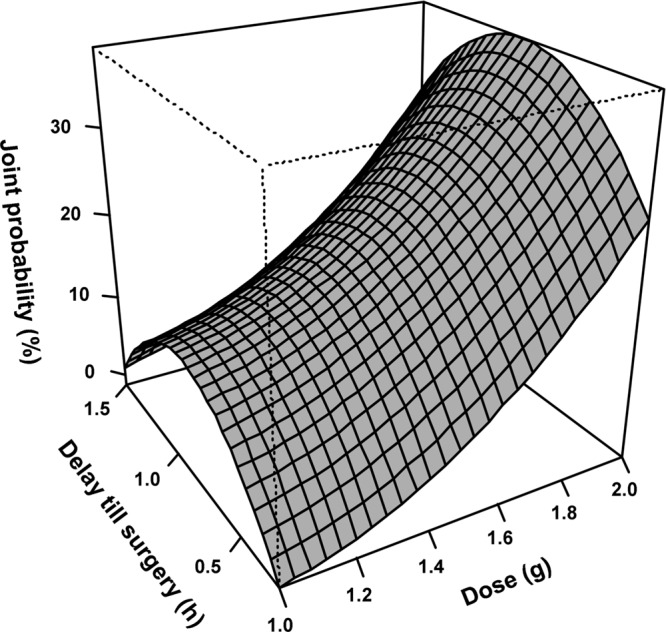
Response surface plot of the joint probability of maintaining free cefazolin plasma concentration of ≥8 μg/ml during surgery in maternal and cord blood as a function of dose and delay till surgery.
Examining the marginal success in maternal and cord blood (Fig. 8) suggests that high maternal plasma concentrations and target rates of >50% are achieved during surgery if cefazolin is administered less than 1 h before surgery. In contrast, the peak concentration in the cord blood is reached during surgery if the drug is administered 60 to 120 min before surgery. The maximum target attainment rates in the cord blood were 13%, 37%, and 58% for the 1-g, 1.5-g, and 2-g doses, respectively.
FIG 8.

Box plot of the marginal probability of maintaining free cefazolin plasma concentration of ≥8 μg/ml during surgery in maternal (black) or cord (gray) blood following administration of 1 g (A), 1.5 g (B), or 2 g (C) as a function of delay between drug administration and surgery.
Total and free cefazolin concentration profiles were also simulated in 1,000 virtual neonates. One to two grams of cefazolin administered 15 to 120 min before surgery was associated with (i) therapeutic duration, defined as the period in which the free cefazolin concentration in neonates was >8 mg/liter, ranging between 6 and 10 h; and (ii) area under the total cefazolin concentration-time curve from 0 to 36 h, ranging between 197 and 436 mg/liters/h.
DISCUSSION
The cord-to-maternal total concentration ratio of cefazolin was 41%. This confirms the findings of Fiore Mitchell et al. (11) and Popovic et al. (12), who reported the rapid placental transfer of cefazolin. In addition, we developed a population PK model in pregnant women (and in their neonates) undergoing elective cesarean delivery, with consideration of transplacental delivery to the fetus. Evaluation of the model using diagnostic plots (Fig. 2 to 4), bootstrap analysis (Table 2), and visual predictive check (Fig. 5 and 6) indicated that the model described the data well, was unbiased through the observations or time ranges, was robust and stable, and was able to predict the distribution of the observed data through stochastic simulations.
A one-compartment model appears to provide an adequate description of cefazolin kinetics. This is consistent with the common trend used for cefazolin PK analysis found in the literature (10). In our study, the volume of distribution and clearance values for cefazolin (Table 2) were in good agreement with the values reported in the literature for nonpregnant and pregnant adults (9, 28–32).
During pregnancy, the body undergoes extensive physiological alterations, which most likely influence the plasma and tissue concentrations of many drugs compared with these concentrations in nonpregnant subjects. Antibiotics exhibiting pregnancy-altered PK have been reviewed elsewhere (33). Reports investigating the influence of pregnancy on cefazolin clearance are conflicting. Popovic et al. failed to demonstrate a significant difference in cefazolin disposition between women undergoing cesarean delivery at term compared with women undergoing gynecological surgery (12). In contrast, Philipson et al. reported a 57% increase in cefazolin antepartum clearance compared with postpartum values (30). Our result (Table 2) supports the finding of Philipson et al. (30), where clearance estimate during pregnancy (7.2 liters/h) is almost two times greater than that following delivery (4.1 liters/h).
Cefazolin metabolism is a very insignificant process in the elimination of the drug, which is mainly conducted through renal excretion (10). Renal clearance of drugs is dependent on glomerular filtration rate, renal blood flow, and active tubular secretion/reabsorption (34). Maternal adaptation to pregnancy involves dramatic changes in renal hemodynamics, including 50% and 60% increases in glomerular filtration and renal blood flow during the third trimester, respectively, compared with nonpregnancy values (35). In the immediate wake of cesarean surgery, glomerular hyperfiltration persists, while renal hyperperfusion ceases (36). Therefore, the rapid decrease in cefazolin clearance noticed here may be attributed to a fall in renal blood flow that happens immediately after delivery.
Another potential contributor to the observed shift in cefazolin clearance is cesarean surgery itself. By necessity, surgical operations are accompanied by intraoperative blood loss, postoperative pain, and anesthesia-induced physiological alterations. Blood loss adds directly to the elimination of drug. Pain lowers renal blood flow by stimulating the release of vasoconstriction peptides (37). Epidural anesthesia, used in this study, has been associated with nonsignificant reduction in renal blood flow (38).
Cefazolin binding to albumin is highly nonlinear, depending on total plasma cefazolin and albumin concentrations (39). Albumin concentration decreases during the second trimester and continues to decline throughout pregnancy, reaching concentrations approximately 70 to 80% of normal values at the time of delivery (40). This pregnancy-induced hypoalbuminemia was found to be persistent during the early postpartum period (36). Thus, alterations in plasma albumin concentrations cannot be invoked to explain the postpartum decrease in cefazolin clearance that we observed.
The current estimated maternal volume of distribution (9.4 liters) is larger than the typical plasma volume (3 liters) but less than the typical extracellular fluid volume (15 liters), confirming that cefazolin distribution is restricted to extracellular water. In pregnancy, a substantial percentage of the weight gain is attributed to increased total body water, of which approximately 80% is extracellular (41). Therefore, pregnancy may be associated with increased drug dilution. However, consistent with the findings of Philipson et al. (30), we were unable to establish pregnancy-related changes in the volume of distribution.
The cefazolin half-life in neonates is 5 h, which is close to the value previously reported by Deguchi et al. (4.4 h) (19). The longer half-life in neonates relative to nonpregnant adults reflects a reduction in clearance and/or increase in the volume of distribution. Developmental physiology of preterm and full-term neonates involves a reduced glomerular filtration rate (15) and increased extracellular fluid (14). Disposition of β-lactam antibiotics is known to be significantly affected by differences in body composition and organ function in adults and newborns (42).
One objective of this work was to evaluate different dosing regimens for cesarean delivery prophylaxis using PK-PD analysis. The evaluations assessed the ability to achieve and maintain therapeutic concentrations throughout the surgery period. Only free drug was assumed to have bactericidal activity. The effect of protein binding on antibacterial activity is not clear, although one study (43) indicated that the presence of human serum resulted in a 41 to 48% decrease in the activity of cefazolin compared with buffered cefazolin solution.
Because surgical site infection is a significant clinical problem, affecting up to 20% of patients undergoing surgery and resulting in substantial mortality and morbidity (44), it is important to achieve and sustain a sufficient therapeutic concentration of the antibacterial agent in the circulation system and in the wound tissue. In this study, we used the concentration of cefazolin in the cord blood to indicate drug concentration in the target tissue, although drug penetration to various body tissues is influenced by several factors, including tissue membrane permeability, regional blood flow, and tissue composition.
For antibiotic prophylaxis during a cesarean delivery, the American Congress of Obstetricians and Gynecologists now recommends that 1 g of cefazolin be administered within 60 min of the start of the operation (17). Our simulations show that the probability of maintaining free cefazolin concentrations in plasma above 8 mg/liter during a scheduled cesarean delivery surgery is <50% in cord blood and >70% in maternal blood when cefazolin is administered in doses lower than 2 g or administered less than 1 h before delivery (Fig. 8). Only 2 g of cefazolin administered 1 h before incision is capable of achieving more than 50% success in both maternal and cord blood. The superior performance of this dosing regimen relative to the regimen recommended by the guidelines is most likely due to increased clearance during pregnancy (Table 2). It is necessary to shorten the dosing interval or increase the dose in pregnancy to compensate for accelerated elimination and to preserve the same free drug plasma concentration and free concentration/MIC ratios as those achieved in nonpregnant adults (33).
Fetal exposure to cefazolin and potential unwanted side effects in the newborn are a major concern when injecting large doses of cefazolin before the cord is clamped. When 2 g of cefazolin was administered 1 h before surgery, the maximum AUC of total cefazolin up to 36 h (>7 times the half-life in neonates) was 436 mg/liters/h. This value is smaller than the total AUC previously determined in neonates (662 mg/liters/h) following the i.v. administration of 30 mg/kg of body weight as a constant rate infusion for 30 min (19).
The influence of maternal administration of cefazolin on the rate of neonatal sepsis is poorly studied. Two clinical trials failed to report a significant difference in the incidence of infection when 1 or 2 g cefazolin is administered to women 15 to 60 min before the time of skin incision compared with administration after cord clamping (2, 3). However, these studies were not designed to investigate antibacterial activity in neonates. Recently, cefazolin successfully treated a majority of infants with coagulase-negative staphylococcal sepsis in a neonatal intensive care unit (16). Our simulations indicate that therapeutic concentrations of free cefazolin are preserved in newborns for a minimum of 6 h, which may be clinically beneficial as a preventive treatment.
The major drawback of our study is that only one cord sample and neonatal sample were used in the analysis. This prevents obtaining reliable estimates for interindividual variability and may influence the accuracy of the Monte Carlo simulation-based conclusions. However, sampling cord blood more than once per mother requires invasive sampling protocols that would have complicated the study. In addition, we adopted a study design that was in line with the standard clinical care provided by the Stanford University hospital and clinics to the newborns. Hence, the 24-h sample routinely collected for blood tests after birth was also used for cefazolin concentration determination.
This study lacks measurement of: (i) free cefazolin and albumin concentrations in plasma to account for the highly saturable plasma protein binding, (ii) cefazolin concentrations in surgical site tissue to ensure adequate antibiotic penetration, and (iii) intraoperative blood loss, glomerular filtration rate, and renal blood flow to assess the effect of delivery and surgical operation consequences on cefazolin PK. This shortage of data might have impacted our recommendation for the optimal dosing scheme in cesarean surgery.
In conclusion, because total clearance of cefazolin increases during pregnancy, larger doses are recommended for surgical prophylaxis in pregnant women in order to obtain the same antibacterial effect as is seen in a nonpregnant surgical population. Cefazolin has a longer half-life in neonates than in adults. In neonates, up to 2 g of cefazolin given to the mother within an hour of surgery is effective and produces exposure within clinically approved limits.
ACKNOWLEDGMENTS
We thank Maureen Donohue, Stanford University School of Medicine, for editorial assistance.
We declare that we have no conflicts of interest.
Footnotes
Published ahead of print 14 April 2014
REFERENCES
- 1.Nishida M, Matsubara T, Murakawa T, Mine Y, Yokota Y, Kuwahara S, Goto S. 1969. In vitro and in vivo evaluation of cefazolin, a new cephalosporin C derivative. Antimicrob. Agents Chemother. 9:236–243 [PubMed] [Google Scholar]
- 2.Sullivan SA, Smith T, Chang E, Hulsey T, Vandorsten JP, Soper D. 2007. Administration of cefazolin prior to skin incision is superior to cefazolin at cord clamping in preventing postcesarean infectious morbidity: a randomized controlled trial. Am. J. Obstet. Gynecol. 196:455.e1–455.e5 (Erratum, 197:333, 2007.) 10.1016/j.ajog.2007.03.022 [DOI] [PubMed] [Google Scholar]
- 3.Thigpen BD, Hood WA, Chauhan S, Bufkin L, Bofill J, Magann E, Morrison JC. 2005. Timing of prophylactic antibiotic administration in the uninfected laboring gravida: a randomized clinical trial. Am. J. Obstet. Gynecol. 192:1864–1871. 10.1016/j.ajog.2004.12.063 [DOI] [PubMed] [Google Scholar]
- 4.Tita ATN, Rouse DJ, Blackwell S, Saade GR, Spong CY, Andrews WW. 2009. Emerging concepts in antibiotic prophylaxis for cesarean delivery: a systematic review. Obstet. Gynecol. 113:675–682. 10.1097/AOG.0b013e318197c3b6 [DOI] [PMC free article] [PubMed] [Google Scholar]
- 5.Beal SL, Sheiner LB, Boeckmann AJ. 1994. NONMEM user's guides - Part V. NONMEM Project Group, University of California at San Francisco, San Francisco, CA [Google Scholar]
- 6.Craig WA. 1995. Interrelationship between pharmacokinetics and pharmacodynamics in determining dosage regimens for broad-spectrum cephalosporins. Diagn. Microbiol. Infect. Dis. 22:89–96. 10.1016/0732-8893(95)00053-D [DOI] [PubMed] [Google Scholar]
- 7.Bratzler DW, Houck PM, Surgical Infection Prevention Guidelines Writers Workgroup 2004. Antimicrobial prophylaxis for surgery: an advisory statement from the National Surgical Infection Prevention Project. Clin. Infect. Dis. 38:1706–1715. 10.1086/421095 [DOI] [PubMed] [Google Scholar]
- 8.Kariyone K, Harada H, Kurita M, Takano T. 1970. Studies on cephalosporin. 3. Cefazolin, a new semisynthetic cephalosporin antibiotic. I. Synthesis and chemical properties of cefazolin. J. Antibiot. 23:131–136 [DOI] [PubMed] [Google Scholar]
- 9.Kirby WM, Regamey C. 1973. Pharmacokinetics of cefazolin compared with four other cephalosporins. J. Infect. Dis. 128(Suppl 2):S341–S346. 10.1093/infdis/128.Supplement_2.S341 [DOI] [PubMed] [Google Scholar]
- 10.Nightingale CH, Greene DS, Quintiliani R. 1975. Pharmacokinetics and clinical use of cephalosporin antibiotics. J. Pharm. Sci. 64:1899–1927. 10.1002/jps.2600641202 [DOI] [PubMed] [Google Scholar]
- 11.Fiore Mitchell TF, Pearlman MD, Chapman RL, Bhatt-Mehta V, Faix RG. 2001. Maternal and transplacental pharmacokinetics of cefazolin. Obstet. Gynecol. 98:1075–1079. 10.1016/S0029-7844(01)01629-5 [DOI] [PubMed] [Google Scholar]
- 12.Popovic J, Grujic Z, Sabo A. 2007. Influence of pregnancy on ceftriaxone, cefazolin and gentamicin pharmacokinetics in caesarean vs. non-pregnant sectioned women. J. Clin. Pharm. Ther. 32:595–602. 10.1111/j.1365-2710.2007.00864.x [DOI] [PubMed] [Google Scholar]
- 13.Morselli PL, Francomorselli R, Bossi L. 1980. Clinical pharmacokinetics in newborns and infants. Age-related differences and therapeutic implications. Clin. Pharmacokinet. 5:485–527 [DOI] [PubMed] [Google Scholar]
- 14.Friis-Hansen B. 1961. Body water compartments in children - changes during growth and related changes in body composition. Pediatrics 28:169–181 [PubMed] [Google Scholar]
- 15.Arant BS. 1978. Developmental patterns of renal functional maturation compared in human neonate. J. Pediatr. 92:705–712. 10.1016/S0022-3476(78)80133-4 [DOI] [PubMed] [Google Scholar]
- 16.Hemels MAC, van den Hoogen A, Verboon-Maciolek MA, Fleer A, Krediet TG. 2011. A seven-year survey of management of coagulase-negative staphylococcal sepsis in the neonatal intensive care unit: vancomycin may not be necessary as empiric therapy. Neonatology 100:180–185. 10.1159/000324852 [DOI] [PubMed] [Google Scholar]
- 17.American College of Obstetricians and Gynecologists. 2010. Committee opinion no. 465: antimicrobial prophylaxis for cesarean delivery: timing of administration. Obstet. Gynecol. 116:791–792. 10.1097/AOG.0b013e3181f68086 [DOI] [PubMed] [Google Scholar]
- 18.Pevzner L, Swank M, Krepel C, Wing DA, Chan K, Edmiston CE., Jr 2011. Effects of maternal obesity on tissue concentrations of prophylactic cefazolin during cesarean delivery. Obstet. Gynecol. 117:877–882. 10.1097/AOG.0b013e31820b95e4 [DOI] [PubMed] [Google Scholar]
- 19.Deguchi Y, Koshida R, Nakashima E, Watanabe R, Taniguchi N, Ichimura F, Tsuji A. 1988. Interindividual changes in volume of distribution of cefazolin in newborn infants and its prediction based on physiological pharmacokinetic concepts. J. Pharm. Sci. 77:674–678. 10.1002/jps.2600770807 [DOI] [PubMed] [Google Scholar]
- 20.Clinical and Laboratory Standards Institute (CLSI). 2007. Blood collection on filter paper for newborn screening programs; approved standard, fifth ed. Clinical and Laboratory Standards Institute, Wayne, PA [Google Scholar]
- 21.Ambrose PG, Bhavnani SM, Rubino CM, Louie A, Gumbo T, Forrest A, Drusano G. 2007. Pharmacokinetics-pharmacodynamics of antimicrobial therapy: it's not just for mice anymore. Clin. Infect. Dis. 44:79–86. 10.1086/510079 [DOI] [PubMed] [Google Scholar]
- 22.Lindbom L, Pihlgren P, Jonsson EN. 2005. PsN-Toolkit–a collection of computer intensive statistical methods for non-linear mixed effect modeling using NONMEM. Comput. Methods Programs Biomed. 79:241–257. 10.1016/j.cmpb.2005.04.005 [DOI] [PubMed] [Google Scholar]
- 23.Karlsson MO, Holford NH. 2008. A tutorial on visual predictive checks, abstr 1434 Abstr. Annu. Meet. Pop. Approach Group Eur. 17th PAGE meeting [Google Scholar]
- 24.Cook RD. 1979. Influential observations in linear regression. J. Am. Stat. Assoc. 74:169–174. 10.1080/01621459.1979.10481634 [DOI] [Google Scholar]
- 25.Cook RD, Weisberg S. 1982. Residuals and influence in regression. Chapman & Hall, New York, NY [Google Scholar]
- 26.Clinical and Laboratory Standards Institute (CLSI). 2011. Performance standards for antimicrobial susceptibility testing: twenty-first informational supplement. Clinical and Laboratory Standards Institute, Wayne, PA [Google Scholar]
- 27.Allegaert K, Van Mieghem T, Verbesselt R, Vanhole C, Devlieger R, Cossey V, Deprest J, de Hoon J. 2009. Cefazolin plasma protein binding saturability during pregnancy. Methods Find. Exp. Clin. Pharmacol. 31:25–28. 10.1358/mf.2009.31.1.1346611 [DOI] [PubMed] [Google Scholar]
- 28.Allegaert K, van Mieghem T, Verbesselt R, de Hoon J, Rayyan M, Devlieger R, Deprest J, Anderson BJ. 2009. Cefazolin pharmacokinetics in maternal plasma and amniotic fluid during pregnancy. Am. J. Obstet. Gynecol. 200:170.e1–7. 10.1016/j.ajog.2008.08.067 [DOI] [PubMed] [Google Scholar]
- 29.Bergan T, Brodwall EK, Orjavik O. 1977. Pharmacokinetics of cefazolin patients with normal and impaired renal function. J. Antimicrob. Chemother. 3:435–443. 10.1093/jac/3.5.435 [DOI] [PubMed] [Google Scholar]
- 30.Philipson A, Stiernstedt G, Ehrnebo M. 1987. Comparison of the pharmacokinetics of cephradine and cefazolin in pregnant and non-pregnant women. Clin. Pharmacokinet. 12:136–144. 10.2165/00003088-198712020-00004 [DOI] [PubMed] [Google Scholar]
- 31.Regamey C, Gordon RC, Kirby WM. 1974. Cefazolin vs cephalothin and cephaloridine. A comparison of their clinical pharmacology. Arch. Intern. Med. 133:407–410 [PubMed] [Google Scholar]
- 32.Reller LB, Karney WW, Beaty HN, Holmes KK, Turck M. 1973. Evaluation of cefazolin, a new cephalosporin antibiotic. Antimicrob. Agents Chemother. 3:488–497. 10.1128/AAC.3.4.488 [DOI] [PMC free article] [PubMed] [Google Scholar]
- 33.Heikkila A, Erkkola R. 1994. Review of beta-lactam antibiotics in pregnancy. The need for adjustment of dosage schedules. Clin. Pharmacokinet. 27:49–62 [DOI] [PubMed] [Google Scholar]
- 34.Janku I. 1993. Physiological modelling of renal drug clearance. Eur. J. Clin. Pharmacol. 44:513–519. 10.1007/BF02440850 [DOI] [PubMed] [Google Scholar]
- 35.Dunlop W. 1981. Serial changes in renal haemodynamics during normal human pregnancy. Br. J. Obstet. Gynaecol. 88:1–9. 10.1111/j.1471-0528.1981.tb00929.x [DOI] [PubMed] [Google Scholar]
- 36.Lafayette RA, Malik T, Druzin M, Derby G, Myers BD. 1999. The dynamics of glomerular filtration after Caesarean section. J. Am. Soc. Nephrol. 10:1561–1565 [DOI] [PubMed] [Google Scholar]
- 37.O'Leary E, Hubbard K, Tormey W, Cunningham AJ. 1996. Laparoscopic cholecystectomy: haemodynamic and neuroendocrine responses after pneumoperitoneum and changes in position. Br. J. Anaesth. 76:640–644. 10.1093/bja/76.5.640 [DOI] [PubMed] [Google Scholar]
- 38.Suleiman MY, Passannante AN, Onder RL, Greene-Helms WF, Perretta SG. 1997. Alteration of renal blood flow during epidural anesthesia in normal subjects. Anesth. Analg. 84:1076–1080. 10.1097/00000539-199705000-00022 [DOI] [PubMed] [Google Scholar]
- 39.Smits A, Roberts JA, Vella-Brincat JW, Allegaert K. 2014. Cefazolin plasma protein binding in different human populations: more than cefazolin-albumin interaction. Int. J. Antimicrob. Agents 43:199–200. 10.1016/j.ijantimicag.2013.10.008 [DOI] [PubMed] [Google Scholar]
- 40.Dean M, Stock B, Patterson RJ, Levy G. 1980. Serum protein binding of drugs during and after pregnancy in humans. Clin. Pharmacol. Ther. 28:253–261. 10.1038/clpt.1980.158 [DOI] [PubMed] [Google Scholar]
- 41.Krauer B, Krauer F. 1977. Drug kinetics in pregnancy. Clin. Pharmacokinet. 2:167–181. 10.2165/00003088-197702030-00002 [DOI] [PubMed] [Google Scholar]
- 42.Paap CM, Nahata MC. 1990. Clinical pharmacokinetics of antibacterial drugs in neonates. Clin. Pharmacokinet. 19:280–318. 10.2165/00003088-199019040-00003 [DOI] [PubMed] [Google Scholar]
- 43.Wick WE, Preston DA. 1972. Biological properties of three 3-heterocyclic-thiomethyl cephalosporin antibiotics. Antimicrob. Agents Chemother. 1:221–234. 10.1128/AAC.1.3.221 [DOI] [PMC free article] [PubMed] [Google Scholar]
- 44.Owens CD, Stoessel K. 2008. Surgical site infections: epidemiology, microbiology and prevention. J. Hosp. Infect. 70(Suppl 2):3–10. 10.1016/S0195-6701(08)60017-1 [DOI] [PubMed] [Google Scholar]