

Abstract
The Protein Data Bank (PDB) was established in 1971 as a repository for the three dimensional structures of biological macromolecules. Since then, more than 85,000 biological macromolecule structures have been determined and made available in the PDB archive. Through analysis of the corpus of data, it is possible to identify trends that can be used to inform us about the future of structural biology and to plan the best ways to improve the management of the ever-growing amount of PDB data.
Introduction
The establishment of the Protein Data Bank (PDB) in 1971 [1] was the culmination of several years of community discussion about how best to archive and distribute the results of structure determinations of biological macromolecules. Led at first by Walter Hamilton and then by Tom Koetzle at Brookhaven National Laboratory, the young resource solicited data from the early pioneers in the field and distributed them on magnetic tapes to the scientists who requested them [2]. In 1989, following many years of discussion within the structural biology community, guidelines were established for the timing of data deposition [3]. These guidelines led to the now almost universal journal requirement that data are deposited before a manuscript is accepted and then released upon publication.
In 1998, the management of the PDB was taken over by the Research Collaboratory for Structural Bioinformatics (RCSB) [4]. At about the same time, data centers at the European Bioinformatics Institute in the United Kingdom (now PDBe [5,6]) and Osaka University in Japan (now PDBj [7]) expanded from being distribution sites to also accepting and processing data. The collaboration among the three sites was formalized in 2003 with the formation of the Worldwide PDB (wwPDB) [8,9]. In 2006, BioMagResBank joined the organization [10]. The mission of the wwPDB is to ensure that standards are set and met for data representation and data quality in the archive. To help accomplish this, the wwPDB established Task Forces of experts in X-ray crystallography, nuclear magnetic resonance (NMR) spectroscopy, 3D electron microscopy (3DEM), and small angle scattering. These Task Forces make recommendations about which data should be collected and how these data should be best validated [11,12].
Data are reviewed across the archive on a regular basis and remediated when appropriate [13,14]. In recent years, atom and residue nomenclatures have been aligned with International Union of Pure and Applied Chemistry (IUPAC) standards. An enriched Chemical Component Dictionary has enhanced the representation of small molecule ligands in the PDB archive. Most recently, the representation of complex peptides has been standardized [15].
The PDB is a well-curated archive that evolves with new developments in structural biology. In this paper, the current contents of the archive are analyzed in order to quantify some of these developments and better understand the trends.
Trends
Growth patterns
The holdings in the PDB continue to grow (Figure 1) at a rate slightly greater than the growth rate of publications in PubMed [16]. As early as 1978, Dick Dickerson had modeled the growth of crystallographic entries as exponential, n = exp(0.19 y), where n is the number of new structures per year and y is the number of years since. Overall, this model is largely correct [17]. More recently, Cele Abad-Zapatero reanalyzed the growth statistics in more detail and discovered that the overall growth rate has remained surprisingly close to Dickerson’s prediction through 2005, with some decrease in the growth rate between 2006 and 2010 [18]. This is consistent with an analysis of PDB depositions that shows a yearly acceleration in data deposition, with the notable exception of 2008. Based upon the rate of increase since the year 2000, our analysis predicts that PDB holdings will increase 1.5-fold between 2012 (current holdings of 85,000) and the end of 2017 (projected holdings of 134,000).
Figure 1.
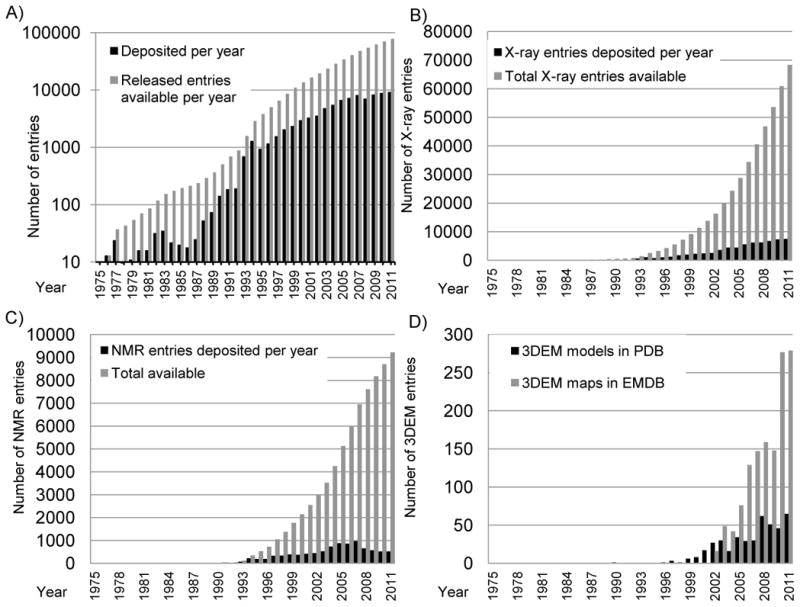
Growth of the PDB archive. A) Depositions per year are shown in black and total released entries available in gray on a logarithmic scale. Reprinted from Berman [46] with permission from Wiley; B) Growth of depositions from X-ray crystallography. Depositions per year are shown in black and total released entries available in light gray; C) Growth in depositions from NMR. Depositions per year are shown in black and total released entries available in light gray; D) Growth in depositions from 3DEM. Depositions per year of 3DEM maps are shown in light gray and depositions per year of model coordinates in black.
The usage of PDB data is also growing. There were 380 million downloads of data from the wwPDB FTP sites in 2011 as compared to 226 million downloads in 2008. Download statistics for the overall archive and for individual entries are available from the wwPDB website (http://www.wwpdb.org/downloadStats.php). Data are also accessed from the individual wwPDB member websites. The RCSB PDB website is accessed by about 250,000 unique visitors per month from 140 countries. Around 750 gigabytes of data are transferred each month from the website. The breadth of PDB usage can be seen in the more than 11,000 citations to the original RCSB PDB reference [4] in journal subject areas ranging from medical informatics and surgery to art to physics (wokinfo.com).
Figure 2 shows an overall increase in depositions from each continent, but with a notable dip in 2008. Since then, the number of depositions has resumed growing: North American depositions are continuing to grow steadily; despite a slight decline in 2011, analysis of 2012 statistics indicates that European depositions are growing overall; and in Asia, a slower growth rate of Japanese depositions is compensated for in part by a faster growth rate of Chinese depositions.
Figure 2.
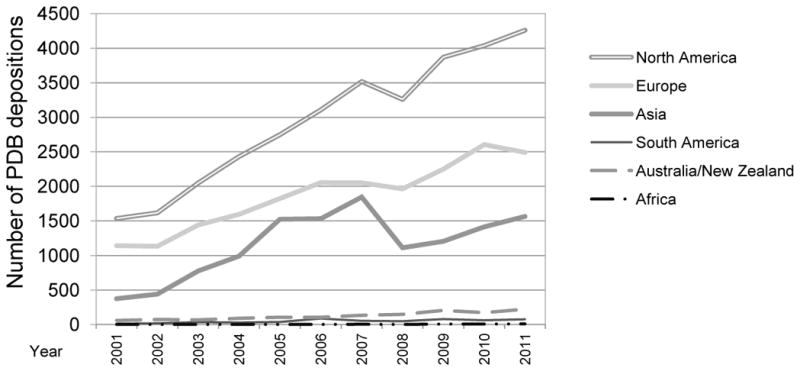
Number of PDB entries deposited per year by continent.
The number of structures released without a corresponding publication is growing. Information about publications associated with PDB entries is updated regularly. Ninety-eight percent of the structures released by the PDB in 2001 were published in journals. In 2011, that percentage decreased to 74%. Part of the reason for this drop was the establishment of the Protein Structure Initiative (PSI [19]), which requires data release within one month of structure determination. As a result of this requirement, the percentage of PSI entries with corresponding publications is necessarily much lower than the rest of the PDB archive. Overall, approximately 20% of PSI structures have an associated citation, as compared to almost 80% of all PDB depositions released between 2001 and 2011 [20].
Structure Determination Methods
Most structures in the PDB––currently 88% of the entire archive--have been determined using X-ray crystallography. There has been steady growth in the number of these depositions (Figure 1b). Synchrotron radiation is now the predominant source of X-rays used for data collection (Figure 3a). The use of either Single-wavelength Anomalous Dispersion (SAD) or Multi-wavelength Anomalous Dispersion (MAD) methods for phasing peaked in 2009. Since 1996, when MAD and SAD began to be used, approximately 15% of all X-ray structures deposited through 2011 have been phased using one of these methods (Figure 3b). Molecular replacement or Fourier phasing methods continue to be used for the majority of X-ray structure determinations.
Figure 3.
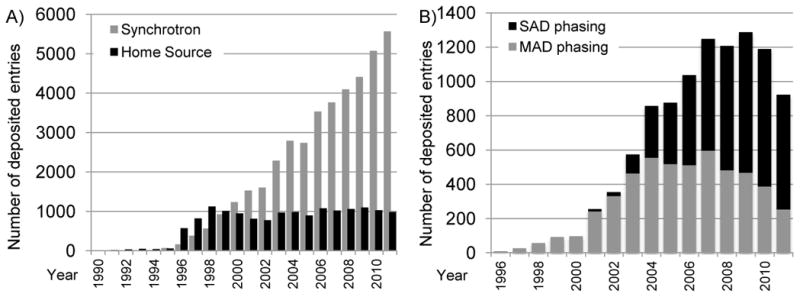
Use of synchrotron radiation in the PDB. A) The number of structures determined using synchrotron radiation deposited per year is shown in grey; the number using home-laboratory sources in black. This plot shows that while the use of home sources for X-ray structure determination has remained roughly constant, the use of synchrotron sources has increased rapidly. Reprinted from Berman [46] with permission from Wiley. B) Use of SAD (in black) and MAD (in gray) phasing in PDB entries deposited per year. After an initial growth in MAD phasing, SAD phasing has become more widely used.
The average resolution of X-ray structures has remained constant at about 2.0 Å. However, with the large volume of data available, there are now substantial numbers of structures determined to very high resolution, including at least one virus structure [21]. At the same time, as more large macromolecular machines are being studied using X-ray methods, there are many examples of very low-resolution structures [22–24].
The use of NMR methods for structure determination began in the 1980s (Figure 1c). After an initial period of growth, the number of structures deposited per year began to decrease in 2008. The average molecular weight for NMR depositions is about 10,000 daltons.
Electron microscopy (3DEM) has been used for structure determination since the 1990s, and the number of map and coordinate depositions is increasing (Figure 1d) [25]. The rapid growth in 3DEM map depositions points towards future growth in deposition of model coordinates from this method. The most popular 3DEM method is single particle reconstruction (for structures such as viruses), with some representation of helical reconstruction, electron crystallography, and subtomogram averaging methods (Figure 4).
Figure 4.
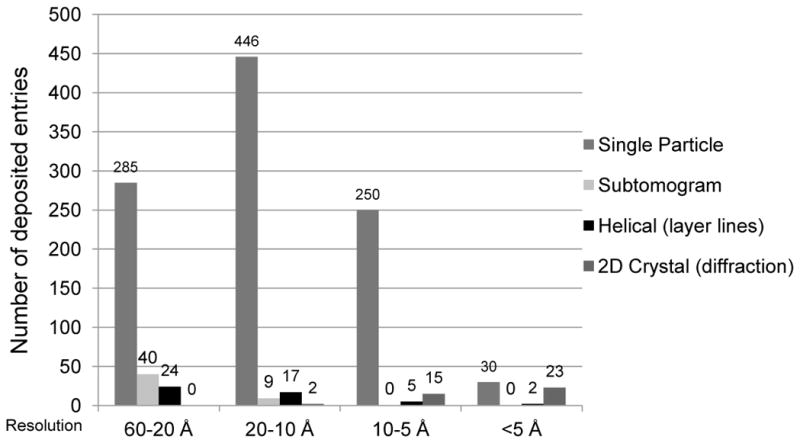
3DEM structures released in the PDB and EMDB [25] by resolution range and reconstruction method. Structures archived in the PDB were represented in this plot exclusively by method and not by mixed type. “Helical” represents the traditional layer-line approach, and “2D Crystal” denotes electron crystallography. Helical structures solved using the single particle approach are grouped under “Single Particle;” two-dimensional crystal structures solved exclusively using subtomogram averaging with no calculation of structure factors from images or measurement of structure factor intensities were grouped under “Subtomogram.” The graph represents 1148 total deposited EM structures encompassing 1146 maps deposited to EMDB and 415 models deposited to PDB. These include 840 map-only structures, 277 maps with one or more associated PDB models, and 31 electron crystallography PDB entries.
Chemistry
Overall
More than 90% of the PDB’s holdings are proteins. Over the years the average molecular weight of the asymmetric unit for crystal structures has increased from less than 30,000 daltons to over 110,000 daltons (Figure 5a). The number of biopolymer chains has increased at a somewhat faster rate than the number of entries (Figure 5b). The number of non-redundant sequence clusters is also growing constantly. Analysis of the top 20 sequence clusters in the PDB shows that the most studied proteins overall are lysozyme, human immunodeficiency virus (HIV) protease, carbonic anhydrase, and trypsin. However, the trends in recent years have changed, with HIV protease, major histocompatibility complex (MHC), carbonic anhydrase, beta secretase, and mitogen-activated protein (MAP) kinase being the most commonly deposited protein structures since 2007 (Table 1). This is most likely because of the important roles these proteins play in biomedical research.
Figure 5.
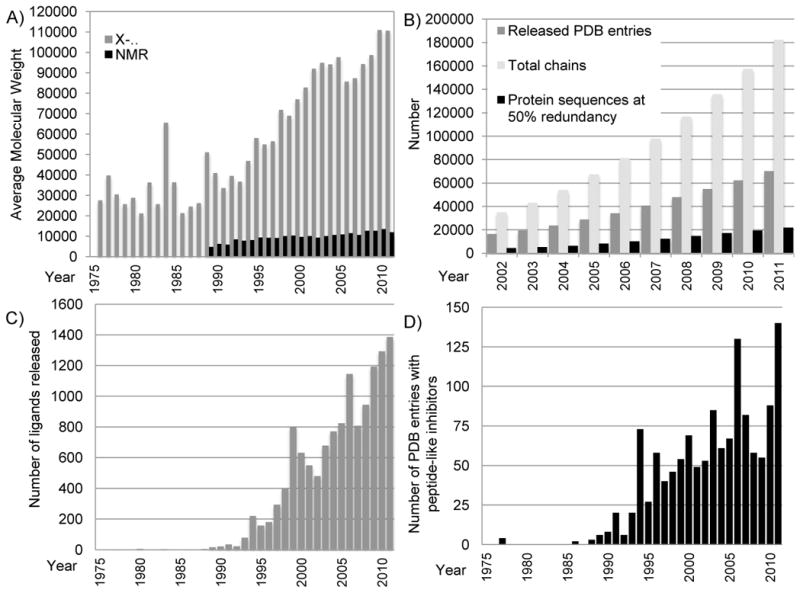
Growth in the size and complexity of PDB entries. A) Average molecular weight of entries released each year for structures determined by X-ray crystallography (for the asymmetric unit; in grey) and NMR (in black). Calculations excluded water and counted extremely large structures as single entries. For viruses and entries that used non-crystallographic symmetry (NCS), molecular weights for the full asymmetric unit were calculated by multiplying the molecular weight of the explicit polymer chains by the number of NCS operators. The large increase shown in 1984 was due to the release of the tomato bushy stunt virus 2tbv [47]. B) The number of PDB entries, total related polymer chains, and protein sequences (with 50% redundancy as calculated using blastclust [48]) available in the archive each year. C) The number of unique non-polymer ligands released each year (a single entry may have several ligands). There are three notable peaks: 73 structures with an inhibitor/antibiotic were released in 1994, the majority of which are thrombin inhibitors and renin inhibitors; 130 structures in 2006, the majority of which are thrombin inhibitors and other protease inhibitors; and 140 structures in 2011, the majority of which are protease inhibitors, including caspase inhibitors. Figures B & C reprinted from Berman [46] with permission from Wiley. D) The number of peptide-like inhibitor/antibiotic entries released per year.
Table 1. Proteins most-frequently deposited in the PDB.
Proteins were selected by creating clusters of structures with 90% sequence identity. To split the PDB roughly in half, August 2007 was used as the halfway point (42888 protein-containing entries (53.1% of the current archive) were available at the end of July 2007, compared to 80800 available at the end of July 2012).
| Cluster rank | Protein clusterb | Total number of PDB entries | Number released before Aug 2007 | Number released after Aug 2007 | Percentage released after Aug 2007 |
|---|---|---|---|---|---|
| 1 | T4 lysozyme | 531 | 441 | 90 | 16.9% |
| 2 | HIV protease | 497 | 271 | 226 | 44.5% |
| 3 | Carbonic anhydrase II | 408 | 218 | 190 | 46.6% |
| 4 | Egg-white lysozyme | 400 | 286 | 114 | 28.5% |
| 5 | Trypsin | 380 | 269 | 111 | 29.2% |
| 6 | Thrombin (complex of heavy and light chains) | 316 | 218 | 98 | 31.0% |
| 7* | Human MHC-I antigen (complex with Beta-2-microglobulin) | 312 | 134 | 178 | 57.0% |
| 8 | Myoglobin | 232 | 179 | 53 | 22.8% |
| 9 | Cyclin-dependent kinase 2 | 217 | 134 | 83 | 38.2% |
| 10 | Hemoglobin (complex of alpha and beta subunits) | 204 | 174 | 30 | 14.7% |
| 11 | Human lysozyme | 203 | 196 | 7 | 3.4% |
| 12 | Antibody chain | 201 | 84 | 117 | 58.2% |
| 13 | MAP Kinase 14 | 194 | 53 | 141 | 72.7% |
| 14 | Ribonuclease A | 193 | 126 | 67 | 34.7% |
| 15 | Beta-secretase 1 | 190 | 36 | 154 | 81.1% |
| 16 | Thermonuclease | 181 | 98 | 83 | 45.9% |
| 17 | Insulin (complex of A and B chains) | 173 | 105 | 68 | 39.3% |
Structures of the human MHC-I complex were grouped using 90% sequence identity on the beta-2-microglobulin component, not MHC-I antigen themselves, due to the sequence diversity of the antigens.
Protein sequence search target sources for each cluster: bacteria phage T4: 1; HIV: 2; human: 3, 6, 7, 9, 10, 11, 13, 15, 17; chicken: 4; bovine: 5, 14; sperm whale: 8; various: 12, Staphylococcus aureus: 16.
The number of ligands available in the PDB continues to increase; there are now more than 14,214 ligands in the wwPDB Chemical Component Dictionary, including some important drugs (Figure 5c, 6a–b). Of the 85,000 entries currently available in the PDB, 70% are complexes containing small molecule ligands. Peptide antibiotics and peptide inhibitors compose a special class of ligands, many of which have pharmaceutical value and whose numbers continue to increase (Figure 5d, 6c–d, 6f). In addition to the peptide-like antibiotics, there are several examples in the archive of other complex antibiotics such as aminoglycosides (Figure 6e).
Figure 6.
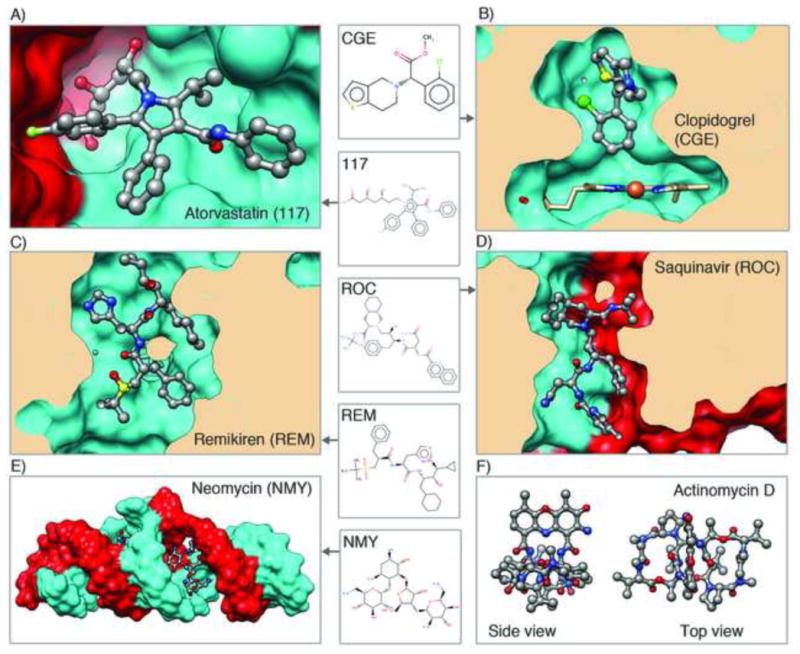
Examples of molecules in the PDB that are or have been used as drugs, shown in ball and stick. For each, the corresponding 3-character code from the Chemical Component Dictionary is listed. Blockbuster drugs shown are A) atorvastatin bound to HMG-CoA reductase, a key enzyme in the cholesterol biosynthesis pathway (PDB ID 1hwk [49]) and B) clopidogrel bound to cytochrome P450 2B4, which activates the prodrug (PDB ID 3me6 [50]); Peptidomimetic inhibitors shown are C) remikiren bound to human renin (PDB ID 3d91 [51]) and D) saquinavir bound to HIV protease (PDB ID 1hxb [52]). E) Aminoglycoside antibiotic shown is neomycin bound to extended duplex RNA (PDB ID 3c7r [53]). F) Peptide-like antibiotic/antitumor agent actinomycin D structure (PDB ID 1a7y [54])
Nucleic acid-containing entries
There are three major classes of nucleic acid-containing entries in the PDB archive: RNA, DNA, and protein-nucleic acid complexes. Nucleic acid crystallography took longer to become established than protein crystallography in large part due to the difficulties of isolating and purifying samples. The first nucleic acid structure to be deposited in the PDB was yeast phe tRNA [26,27] (Figure 7a). The first DNA structure determined was a short fragment of left-handed Z-DNA [28]. The first full turn of B-DNA was published in 1981 [29] (Figure 7c). There was steady growth in the number of DNA structures deposited in the PDB until the mid-1990s, when the growth rate plateaued. Around that time, ribozymes were discovered [30] (see example in Figure 7b), and RNA structure depositions increased and then leveled off. In the 1980s, the first structures of protein-DNA complexes were deposited, followed by the first single-crystal protein-RNA complex structures in the early 1990s (see examples in Figures 7d and 7e, respectively).
Figure 7.
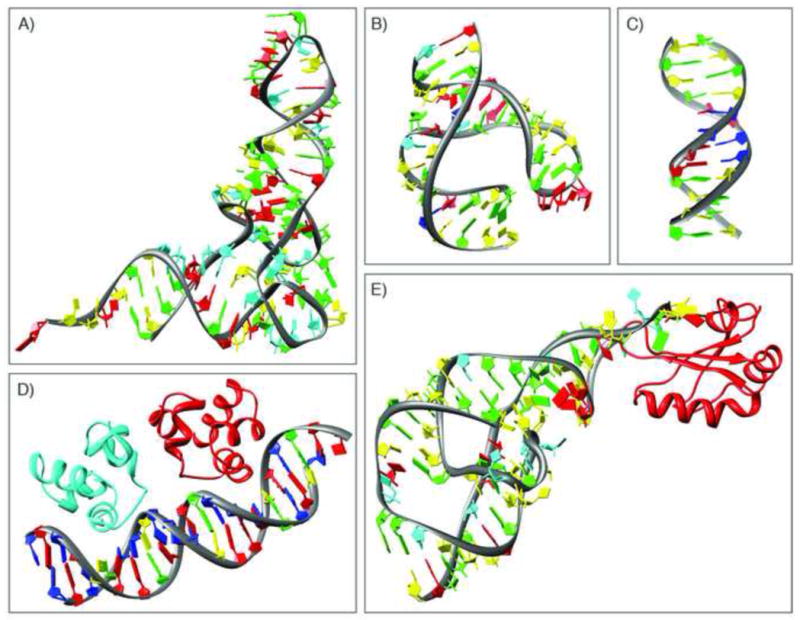
Examples of some of the early nucleic-acid containing structures. A) yeast tRNA-Phe (PDB ID 4tna [55]); B) hammerhead ribozyme (PDB ID 1hmh [30]); c) B-DNA dodecamer (PDB ID 1bna [29]); D) complex of the DNA operator and the phage 434 repressor (PDB ID 2or1 [56]); E) hepatitis delta virus ribozyme (PDB ID 1drz [57]).
The growth rate of the deposition of protein-nucleic acid complexes continues to increase (Figure 8), partly as a consequence of continuing investigations of the structure of ribosomes complexed with drugs.
Figure 8.
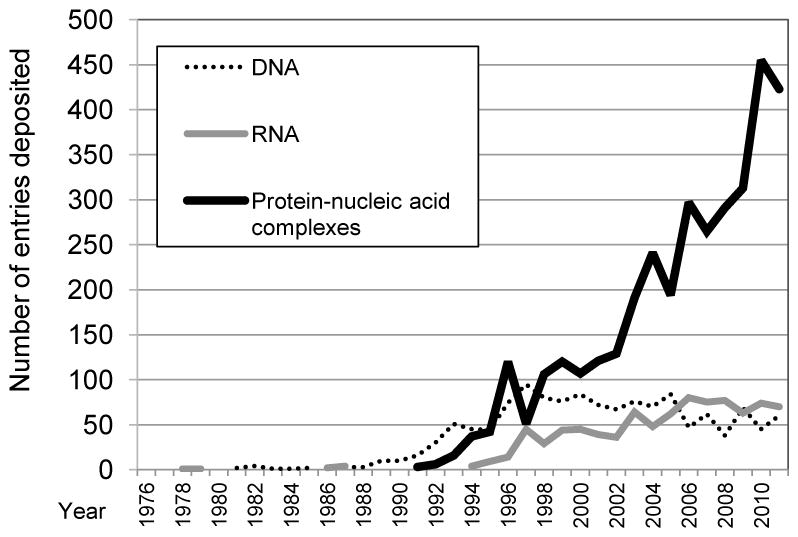
Growth in the number of depositions per year for nucleic acid-containing entries.
Carbohydrate-containing entries
Carbohydrates are known to play key roles in energy generation, cell signaling, cellular recognition, and cellular and extracellular matrix formation [31]. While the building blocks, interactions, structures, and organization of proteins and nucleic acids are relatively well understood, carbohydrates have yet to be fully characterized at either the structural or functional level. In addition, carbohydrate polymers, unlike proteins and nucleic acids, do not have a standard backbone structure and are not synthesized based on a genetic code. Carbohydrate polymers in protein glycosylations are subject to the activity of enzymes and to the availability of specific saccharide substrates, leading to considerable variability.
More than 7,000 PDB entries contain carbohydrate polymers and/or individual saccharides. They are present as single sugars (monosaccharides) that are either unbound (see example in Figure 9a) or covalently linked to proteins (as seen in some glycoproteins) and as polymers of various lengths that are either unbound (structural components or substrates of specific enzymes) or covalently linked to proteins (glycoproteins, example in Figure 9b). While monosaccharides are key components of nucleotides, mono- and polysaccharides also form key components of several antibiotics such as mithramycin (Figure 9c, [32]) and other biologically important molecules, such as peptidoglycans (Figure 9d, [33]), proteoglycans, and glycolipids. Because the PDB was originally designed as an archive for proteins, some important components of macromolecules such as carbohydrates are not well defined, making search and analysis of them difficult. This situation is recognized and is being remedied.
Figure 9.
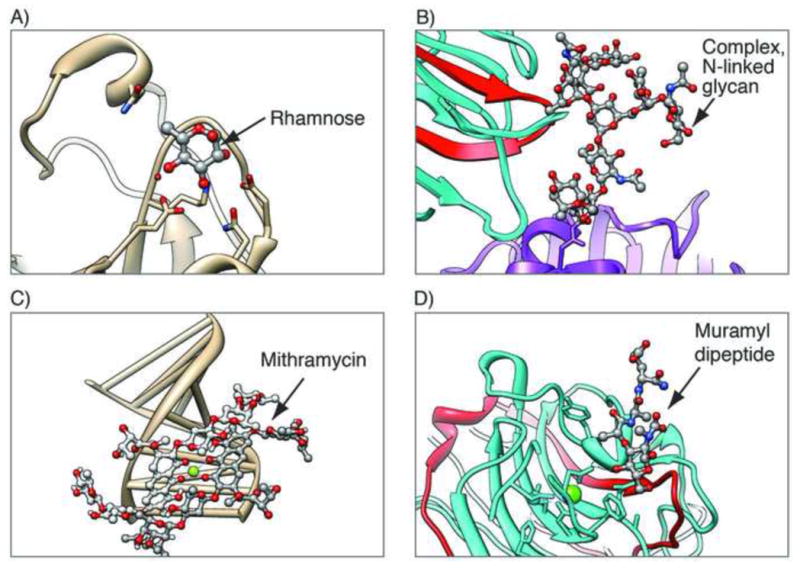
Examples of carbohydrate-containing entries, with the carbohydrates shown in ball and stick. A) Single unbound monosaccharide, rhamnose, in the structure of rhamnose-binding lectin, a pattern recognition protein with a role in innate immunity (PDB ID 2zx2 [58]); B) Polymeric glycoprotein in glycosylated human lactotransferrin N2 fragment (purple) in complex with legume lectin chains (cyan and red, PDB ID 1lg2 [59]); C) Polysaccharide antitumor drug mithramycin bound to a DNA fragment (PDB ID 1bp8 [32]); D) Mixed polymers: bacterial cell wall muramyl peptide (peptidoglycan) bound to legume isolectin chains (cyan and red, PDB ID 1loc [33])
Complex Biological Assemblies
The PDB contains many examples of multi-subunit biological assemblies (Figure 10). Analysis shows that fewer structures have an odd number of subunits than have an even number. Some assemblies are particularly overrepresented, such as those with 6, 8, 12, 24, and n*60 subunits. One plausible reason for this distribution is that the over-represented values correspond to complexes with regular point symmetries, such as the n*60 icosahedral viruses [14]. Further analysis of these assemblies yields some additional interesting observations. Multi-subunit assemblies can be used to facilitate the formation of nanoparticles within their cavities, as with octahedral ferritin (PDB ID 2z6m [34]). In other cases, nanoscale structures have been designed via self-assembly, including a ~13 nm octahedral cage (PDB ID 4ddf [35]) and a 16 nm cavity with a tetrahedral arrangement (PDB ID 3vdx [36]).
Figure 10.
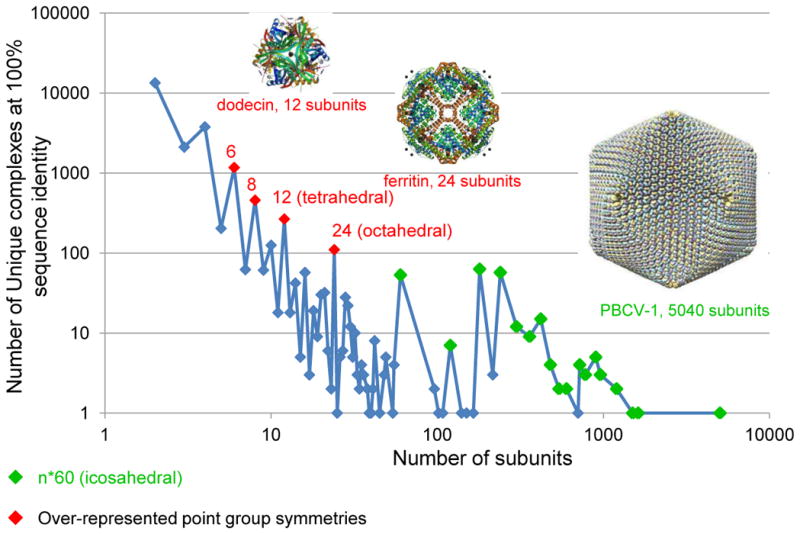
Distribution of unique protein complexes by the number of protein subunits. Any peptide chain with 24 or more residues is considered a protein subunit. The number of over-represented point group symmetries are in red; viral capsids with n*60 subunits are marked in green. The number of complexes decreases with the number of subunits, with a few exceptions. There are fewer complexes with an odd number of subunits than there are complexes with an even number of subunits. Examples shown are dodecin (PDB ID 2yiz [60]), ferritin (PDB ID 1aew [61]), and Paramecium bursaria Chlorella virus type 1 (PDB ID 1m4x [62]).
The first atomic structures of viruses were published about 35 years ago [37], and there are now about 400 virus structures in the PDB. The vast majority are icosahedral viruses solved by either X-ray crystallography or cryo-electron microscopy. Because success in this distinct area of structural biology critically depends on expertise in highly specialized methods [38–41], it is perhaps not surprising that it is practiced by a relatively small and interconnected group of scientists worldwide. Network cluster analysis was used to investigate interconnectedness and growth of this research community relative to the first structures determined between 1978 and 1985. The early structures directly nucleated three major author clusters that have each contributed between 30 to 100 icosahedral virus structures to the PDB (Figure 11: central blue, right purple, and lower red clusters). The community has now evolved into thirteen distinct author clusters; most of these are strongly interconnected by several entries with shared deposition authors.
Figure 11.
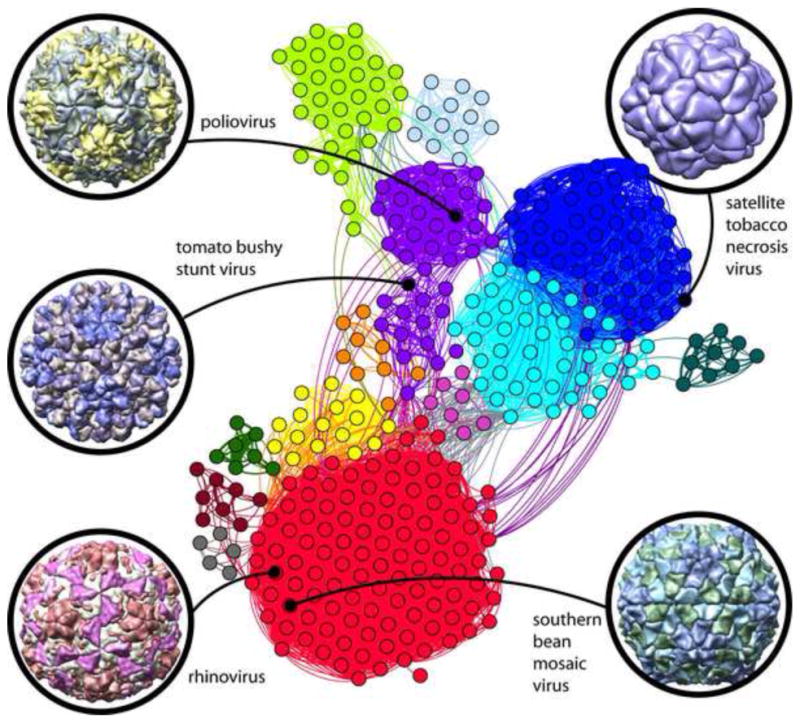
Strongly interconnected research community built around early virus structures. The network diagram shown at center illustrates author relationships among icosahedral virus structures deposited in the PDB. Structures are represented as nodes (circles); a curved line connects pairs of nodes where one or more authors are shared in common. The highest connectivity densities define thirteen major author clusters. Color key/cluster principle investigators: red: M.G. Rossmann, T.S. Baker; blue: L. Liljas, S.E.V. Phillips, P.G. Stockley; cyan: J.E. Johnson; purple: S.C. Harrison, J.M. Hogle; light green: D.I. Stuart, E.E. Fry, Z. Rao; yellow: M. Agbandje-McKenna; light blue: M.R.N. Murthy; orange: H. Zhou; dark cyan: A. McPherson; dark red: M.S. Chapman; pink: T. Tsukihara; dark green: W. Chiu; grey: E. Arnold. The nodes belonging to the first five structures are identified for reference: tomato bushy stunt virus (PDB ID 2tbv [47]), southern bean mosaic virus (PDB ID 4sbv [63]), satellite tobacco necrosis virus (PDB ID 2buk [37]), rhinovirus (PDB ID 4rhv [64]), and poliovirus (PDB ID 2plv [65]). Gephi [66] was used for cluster analysis of 375 icosahedral virus PDB entries connected by 364 deposition authors.
Looking Forward
Structural biology is unique in that the PDB archive provides a quantitative indicator of research productivity. Our analysis of these trends shows that the PDB has had an overall steady growth since its inception in 1971. The slight decline in the number of depositions in 2008 coincides with the discontinuation of a major program in Japan [42] as well as a decline in the use of NMR for structure determination. However, other factors such as global economic developments and changes in science funding may also be involved.
Analyses of these trends may help inform development of many aspects of the archive such as the data dictionaries, annotation practices, software development, and remediation efforts. For example, the current development of a Common Tool for Deposition and Annotation will allow the wwPDB to manage an increased data load without an increase in resources [43]. This tool will provide for distribution of the data load worldwide and incorporates the best practices for annotation developed by the wwPDB.
As another example, the increased complexity and size of the entries being deposited has led to the adoption of the PDBx format, which has far fewer restrictions than the legacy PDB format [44,45]. Current work with structure determination software developers to incorporate PDBx ensures that data will be input and exported from the PDB without loss of information. In addition, efforts to review and remediate special categories of entries such as those containing complex peptides or carbohydrates will improve the usability of the PDB by other scientists. Similarly, the diversity of methods used for structure determination had led to the creation of Task Forces that are making recommendations for data collection and validation.
These trends also inform the development of external resources. The decline in the percentage of publications with accompanying depositions strongly suggests the need to consider data as a type of publication. This is, in fact, being done by the Web of Knowledge’s Data Citation Index (http://wokinfo.com/).
Continued surveillance and analysis of the PDB holdings can provide new directions and opportunities for structural biology and will also allow the archive to evolve along with the science it represents.
Highlights.
The number of entries in the PDB archive is predicted to increase 1.5-fold between now and the end of 2017.
The structures deposited in the PDB are growing in complexity.
Three-dimensional electron microscopy is emerging as an important method for determining structures of large macromolecular assemblies.
Protein-nucleic acid complexes are responsible for strong growth in the number of nucleic acids in the PDB.
Acknowledgments
The RCSB PDB is a member of the wwPDB; we are grateful for the continued collaboration with our partners (PDBe, led by Gerard Kleywegt; PDBj, led by Haruki Nakamura; BMRB, led by John Markley). The RCSB PDB is supported by the National Science Foundation [NSF DBI 0829586]; National Institute of General Medical Sciences; Office of Science, Department of Energy; National Library of Medicine; National Cancer Institute; National Institute of Neurological Disorders and Stroke; and the National Institute of Diabetes & Digestive & Kidney Diseases. EMDataBank is supported in part by National Institutes of Health (R01GM079429) to Baylor College of Medicine, Rutgers University, and the European Bioinformatics Institute.
Footnotes
Publisher's Disclaimer: This is a PDF file of an unedited manuscript that has been accepted for publication. As a service to our customers we are providing this early version of the manuscript. The manuscript will undergo copyediting, typesetting, and review of the resulting proof before it is published in its final citable form. Please note that during the production process errors may be discovered which could affect the content, and all legal disclaimers that apply to the journal pertain.
References
- 1.Protein Data Bank. Protein Data Bank. Nature New Biol. 1971:233, 223. [Google Scholar]
- 2.Berman H. The Protein Data Bank: a historical perspective. Acta Crystallogr A: Foundations of Crystallography. 2008;64:88–95. doi: 10.1107/S0108767307035623. [DOI] [PubMed] [Google Scholar]
- 3.International Union of Crystallography. Policy on publication and the deposition of data from crystallographic studies of biological macromolecules. Acta Cryst. 1989;A45:658. [Google Scholar]
- 4.Berman HM, Westbrook JD, Feng Z, Gilliland G, Bhat TN, Weissig H, Shindyalov IN, Bourne PE. The Protein Data Bank. Nucleic Acids Res. 2000;28:235–242. doi: 10.1093/nar/28.1.235. [DOI] [PMC free article] [PubMed] [Google Scholar]
- 5.Velankar S, et al. PDBe: Protein Data Bank in Europe. Nucleic Acids Res. 2012;40:D445–52. doi: 10.1093/nar/gkr998. [DOI] [PMC free article] [PubMed] [Google Scholar]
- 6.Keller PA, Henrick K, McNeil P, Moodie S, Barton GJ. Deposition of macromolecular structures. Acta Crystallogr D Biol Crystallogr. 1998;54:1105–8. doi: 10.1107/s0907444998008464. [DOI] [PubMed] [Google Scholar]
- 7.Kinjo AR, et al. Protein Data Bank Japan (PDBj): maintaining a structural data archive and resource description framework format. Nucleic Acids Res. 2012;40:D453–60. doi: 10.1093/nar/gkr811. [DOI] [PMC free article] [PubMed] [Google Scholar]
- 8.Berman HM, Henrick K, Nakamura H. Announcing the worldwide Protein Data Bank. Nat Struct Biol. 2003;10:980. doi: 10.1038/nsb1203-980. [DOI] [PubMed] [Google Scholar]
- 9.Berman HM, Henrick K, Kleywegt G, Nakamura H, Markley J. The Worldwide Protein Data Bank. In: Arnold E, Himmel DM, Rossmann MG, editors. International Tables for X-Ray Crystallography. Springer; Dordrecht, The Netherlands: 2012. pp. 827–832. [Google Scholar]
- 10.Markley JL, Ulrich EL, Berman HM, Henrick K, Nakamura H, Akutsu H. BioMagResBank (BMRB) as a partner in the Worldwide Protein Data Bank (wwPDB): new policies affecting biomolecular NMR depositions. J Biomol NMR. 2008;40:153–5. doi: 10.1007/s10858-008-9221-y. [DOI] [PMC free article] [PubMed] [Google Scholar]
- 11.Read RJ, et al. A new generation of crystallographic validation tools for the Protein Data Bank. Structure. 2011;19:1395–412. doi: 10.1016/j.str.2011.08.006. [DOI] [PMC free article] [PubMed] [Google Scholar]
- 12.Henderson R, et al. Outcome of the first electron microscopy validation task force meeting. Structure. 2012;20:205–14. doi: 10.1016/j.str.2011.12.014. [DOI] [PMC free article] [PubMed] [Google Scholar]
- 13.Henrick K, et al. Remediation of the Protein Data Bank Archive. Nucleic Acids Res. 2008;36:D426–D433. doi: 10.1093/nar/gkm937. [DOI] [PMC free article] [PubMed] [Google Scholar]
- 14.Lawson CL, Dutta S, Westbrook JD, Henrick K, Berman HM. Representation of viruses in the remediated PDB archive. Acta Cryst. 2008;D64:874–882. doi: 10.1107/S0907444908017393. [DOI] [PMC free article] [PubMed] [Google Scholar]
- 15.Dutta S, et al. Representation of peptide-like inhibitor and antibiotic molecules in the Protein Data Bank. doi: 10.1002/bip.22434. in preparation. [DOI] [PMC free article] [PubMed] [Google Scholar]
- 16.Lu Z. PubMed and beyond: a survey of web tools for searching biomedical literature. Database (Oxford) 2011;2011:baq036. doi: 10.1093/database/baq036. [DOI] [PMC free article] [PubMed] [Google Scholar]
- 17.Rate of PDB Holdings Growth Predicted in 1978? PDB Newsletter. 2002;13:1. [Google Scholar]
- 18.Abad-Zapatero C. Notes of a protein crystallographer: on the high-resolution structure of the PDB growth rate. Acta Cryst. 2012;D68:613–617. doi: 10.1107/S0907444912004799. [DOI] [PubMed] [Google Scholar]
- 19.Montelione GT. The Protein Structure Initiative: achievements and visions for the future. F1000 Biol Rep. 2012;4:7. doi: 10.3410/B4-7. [DOI] [PMC free article] [PubMed] [Google Scholar]
- 20.Godzik A, Minor W. in preparation. [Google Scholar]
- 21.Lane SW, Dennis CA, Lane CL, Trinh CH, Rizkallah PJ, Stockley PG, Phillips SE. Construction and crystal structure of recombinant STNV capsids. J Mol Biol. 2011;413:41–50. doi: 10.1016/j.jmb.2011.07.062. [DOI] [PubMed] [Google Scholar]
- 22.Kern J, et al. Room temperature femtosecond X-ray diffraction of photosystem II microcrystals. Proc Natl Acad Sci U S A. 2012;109:9721–6. doi: 10.1073/pnas.1204598109. [DOI] [PMC free article] [PubMed] [Google Scholar]
- 23.Pereira JH, et al. Crystal structures of a group II chaperonin reveal the open and closed states associated with the protein folding cycle. J Biol Chem. 2010;285:27958–66. doi: 10.1074/jbc.M110.125344. [DOI] [PMC free article] [PubMed] [Google Scholar]
- 24.Sanchez-Weatherby J, et al. Improving diffraction by humidity control: a novel device compatible with X-ray beamlines. Acta Crystallogr D Biol Crystallogr. 2009;65:1237–46. doi: 10.1107/S0907444909037822. [DOI] [PubMed] [Google Scholar]
- 25.Lawson CL, et al. EMDataBank.org: unified data resource for CryoEM. Nucleic Acids Res. 2011;39:D456–D464. doi: 10.1093/nar/gkq880. [DOI] [PMC free article] [PubMed] [Google Scholar]
- 26.Kim SH, Sussman JL, Suddath FL, Quigley GJ, McPherson A, Wang AH, Seeman NC, Rich A. The general structure of transfer RNA molecules. Proc Natl Acad Sci U S A. 1974;71:4970–4. doi: 10.1073/pnas.71.12.4970. [DOI] [PMC free article] [PubMed] [Google Scholar]
- 27.Ladner JE, Jack A, Robertus JD, Brown RS, Rhodes D, Clark BF, Klug A. Atomic co-ordinates for yeast phenylalanine tRNA. Nucleic Acids Res. 1975;2:1629–37. doi: 10.1093/nar/2.9.1629. [DOI] [PMC free article] [PubMed] [Google Scholar]
- 28.Wang AHJ, Quigley GJ, Kolpak FJ, Crawford JL, van Boom JH, van der Marel GA, Rich A. Molecular structure of a left-handed double helical DNA fragment at atomic resolution. Nature. 1979;282:680–686. doi: 10.1038/282680a0. [DOI] [PubMed] [Google Scholar]
- 29.Drew HR, Wing RM, Takano T, Broka C, Tanaka S, Itakura K, Dickerson RE. Structure of a B-DNA dodecamer: conformation and dynamics. Proc Natl Acad Sci USA. 1981;78:2179–2183. doi: 10.1073/pnas.78.4.2179. [DOI] [PMC free article] [PubMed] [Google Scholar]
- 30.Pley HW, Flaherty KM, McKay DB. Three-dimensional structure of a hammerhead ribozyme. Nature. 1994;372:68–74. doi: 10.1038/372068a0. [DOI] [PubMed] [Google Scholar]
- 31.Varki A, Cummings RD, Esko JD, Freeze HH, Stanley P, Bertozzi CR, Hart GW, Etzler ME. Essentials of Glycobiology. Cold Spring Harbor Laboratory Press; Cold Spring Harbor, NY: 2009. [PubMed] [Google Scholar]
- 32.Keniry MA, Owen EA, Shafer RH. The three-dimensional structure of the 4:1 mithramycin:d(ACCCGGGT)(2) complex: evidence for an interaction between the E saccharides. Biopolymers. 2000;54:104–14. doi: 10.1002/1097-0282(200008)54:2<104::AID-BIP3>3.0.CO;2-2. [DOI] [PubMed] [Google Scholar]
- 33.Bourne Y, Ayouba A, Rouge P, Cambillau C. Interaction of a legume lectin with two components of the bacterial cell wall. A crystallographic study. J Biol Chem. 1994;269:9429–35. [PubMed] [Google Scholar]
- 34.Butts CA, Swift J, Kang SG, Di Costanzo L, Christianson DW, Saven JG, Dmochowski IJ. Directing noble metal ion chemistry within a designed ferritin protein. Biochemistry. 2008;47:12729–39. doi: 10.1021/bi8016735. [DOI] [PubMed] [Google Scholar]
- 35.King NP, et al. Computational design of self-assembling protein nanomaterials with atomic level accuracy. Science. 2012;336:1171–4. doi: 10.1126/science.1219364. [DOI] [PMC free article] [PubMed] [Google Scholar]
- 36.Lai YT, Cascio D, Yeates TO. Structure of a 16-nm cage designed by using protein oligomers. Science. 2012;336:1129. doi: 10.1126/science.1219351. [DOI] [PubMed] [Google Scholar]
- 37.Jones TA, Liljas L. Structure of satellite tobacco necrosis virus after crystallographic refinement at 2.5 Å resolution. J Mol Biol. 1984;177:735–767. doi: 10.1016/0022-2836(84)90047-0. [DOI] [PubMed] [Google Scholar]
- 38.Hryc CF, Chen DH, Chiu W. Near-atomic-resolution cryo-EM for molecular virology. Curr Opin Virol. 2011;1:110–7. doi: 10.1016/j.coviro.2011.05.019. [DOI] [PMC free article] [PubMed] [Google Scholar]
- 39.Zhou ZH. Atomic resolution cryo electron microscopy of macromolecular complexes. Adv Protein Chem Struct Biol. 2011;82:1–35. doi: 10.1016/B978-0-12-386507-6.00001-4. [DOI] [PMC free article] [PubMed] [Google Scholar]
- 40.Tang L, Johnson JE. Structural biology of viruses by the combination of electron cryomicroscopy and X-ray crystallography. Biochemistry. 2002;41:11517–24. doi: 10.1021/bi020170j. [DOI] [PubMed] [Google Scholar]
- 41.Rossmann MG. Ab initio phase determination and phase extension using non-crystallographic symmetry. Curr Opin Struct Biol. 1995;5:650–5. doi: 10.1016/0959-440x(95)80058-1. [DOI] [PubMed] [Google Scholar]
- 42.Protein 3000 project over—aim achieved. Riken Research. 2007;2:17. [Google Scholar]
- 43.Quesada M, et al. The wwPDB common tool for deposition and annotation. Acta Cryst. 2011;A67:C403–C404. [Google Scholar]
- 44.Westbrook J, Fitzgerald PM. The PDB format, mmCIF formats and other data formats. In: Bourne PE, Weissig H, editors. Structural Bioinformatics. John Wiley & Sons, Inc; Hoboken, NJ: 2003. pp. 161–179. [Google Scholar]
- 45.Westbrook J, Henrick K, Ulrich EL, Berman HM. 3.6.2 The Protein Data Bank exchange data dictionary. In: Hall SR, McMahon B, editors. International Tables for Crystallography. Springer; Dordrecht, The Netherlands: 2005. pp. 195–198. [Google Scholar]
- 46.Berman HM. Creating a community resource for protein science. Protein Sci. 2012;21:1587–96. doi: 10.1002/pro.2154. [DOI] [PMC free article] [PubMed] [Google Scholar]
- 47.Hopper P, Harrison SC, Sauer RT. Structure of tomato bushy stunt virus. V. Coat protein sequence determination and its structural implications. J Mol Biol. 1984;177:701–13. doi: 10.1016/0022-2836(84)90045-7. [DOI] [PubMed] [Google Scholar]
- 48.Altschul SF, Gish W, Miller W, Myers EW, Lipman DJ. Basic local alignment search tool. J Mol Biol. 1990;215:403–410. doi: 10.1016/S0022-2836(05)80360-2. [DOI] [PubMed] [Google Scholar]
- 49.Istvan ES, Deisenhofer J. Structural mechanism for statin inhibition of HMG-CoA reductase. Science. 2001;292:1160–4. doi: 10.1126/science.1059344. [DOI] [PubMed] [Google Scholar]
- 50.Gay SC, Roberts AG, Maekawa K, Talakad JC, Hong WX, Zhang Q, Stout CD, Halpert JR. Structures of cytochrome P450 2B4 complexed with the antiplatelet drugs ticlopidine and clopidogrel. Biochemistry. 2010;49:8709–20. doi: 10.1021/bi100914z. [DOI] [PMC free article] [PubMed] [Google Scholar]
- 51.Prade L, Bezencon O, Bur D, Weller T, Fischli W, Remen L. Human renin in complex with remikiren. doi: 10.2210/pdb3d91/pdb. [DOI] [Google Scholar]
- 52.Krohn A, Redshaw S, Ritchie JC, Graves BJ, Hatada MH. Novel binding mode of highly potent HIV-proteinase inhibitors incorporating the (R)-hydroxyethylamine isostere. J Med Chem. 1991;34:3340–2. doi: 10.1021/jm00115a028. [DOI] [PubMed] [Google Scholar]
- 53.Freisz S, Lang K, Micura R, Dumas P, Ennifar E. Binding of aminoglycoside antibiotics to the duplex form of the HIV-1 genomic RNA dimerization initiation site. Angew Chem Int Ed Engl. 2008;47:4110–3. doi: 10.1002/anie.200800726. [DOI] [PubMed] [Google Scholar]
- 54.Schaefer M, Sheldrick GM, Bahner I, Lackner H. Crystal Structures of Actinomycin D and Actinomycin Z3. AngewChemIntEdEngl. 1998;37:2381. doi: 10.1002/(SICI)1521-3773(19980918)37:17<2381::AID-ANIE2381>3.0.CO;2-L. [DOI] [PubMed] [Google Scholar]
- 55.Hingerty BE, Brown RS, Jack A. Further refinement of the structure of yeast T-RNA-Phe. J Mol Biol. 1978;124:523–524. doi: 10.1016/0022-2836(78)90185-7. [DOI] [PubMed] [Google Scholar]
- 56.Aggarwal AK, Rodgers DW, Drottar M, Ptashne M, Harrison SC. Recognition of a DNA operator by the repressor of phage 434: a view at high resolution. Science. 1988;242:899–907. doi: 10.1126/science.3187531. [DOI] [PubMed] [Google Scholar]
- 57.Ferre-D’Amare AR, Zhou K, Doudna JA. Crystal structure of a hepatitis delta virus ribozyme. Nature. 1998;395:567–574. doi: 10.1038/26912. [DOI] [PubMed] [Google Scholar]
- 58.Shirai T, Watanabe Y, Lee MS, Ogawa T, Muramoto K. Structure of rhamnose-binding lectin CSL3: unique pseudo-tetrameric architecture of a pattern recognition protein. J Mol Biol. 2009;391:390–403. doi: 10.1016/j.jmb.2009.06.027. [DOI] [PubMed] [Google Scholar]
- 59.Fusetti F, von Moeller H, Houston D, Rozeboom HJ, Dijkstra BW, Boot RG, Aerts JM, van Aalten DM. Structure of human chitotriosidase. Implications for specific inhibitor design and function of mammalian chitinase-like lectins. J Biol Chem. 2002;277:25537–44. doi: 10.1074/jbc.M201636200. [DOI] [PubMed] [Google Scholar]
- 60.Vinzenz X, Grosse W, Linne U, Meissner B, Essen LO. Chemical engineering of Mycobacterium tuberculosis dodecin hybrids. Chem Commun (Camb) 2011;47:11071–3. doi: 10.1039/c1cc12929e. [DOI] [PubMed] [Google Scholar]
- 61.Hempstead PD, Yewdall SJ, Fernie AR, Lawson DM, Artymiuk PJ, Rice DW, Ford GC, Harrison PM. Comparison of the three-dimensional structures of recombinant human H and horse L ferritins at high resolution. J Mol Biol. 1997;268:424–48. doi: 10.1006/jmbi.1997.0970. [DOI] [PubMed] [Google Scholar]
- 62.Nandhagopal N, Simpson AA, Gurnon JR, Yan X, Baker TS, Graves MV, Van Etten JL, Rossmann MG. The structure and evolution of the major capsid protein of a large, lipid-containing DNA virus. Proc Natl Acad Sci U S A. 2002;99:14758–63. doi: 10.1073/pnas.232580699. [DOI] [PMC free article] [PubMed] [Google Scholar]
- 63.Silva AM, Rossmann MG. The refinement of southern bean mosaic virus in reciprocal space. Acta Crystallogr B. 1985;41:147–157. [Google Scholar]
- 64.Arnold E, Rossmann MG. The use of molecular-replacement phases for the refinement of the human rhinovirus 14 structure. Acta Crystallogr A. 1988;44 (Pt 3):270–82. doi: 10.1107/s0108767387011875. [DOI] [PubMed] [Google Scholar]
- 65.Filman DJ, Syed R, Chow M, Macadam AJ, Minor PD, Hogle JM. Structural factors that control conformational transitions and serotype specificity in type 3 poliovirus. EMBO J. 1989;8:1567–79. doi: 10.1002/j.1460-2075.1989.tb03541.x. [DOI] [PMC free article] [PubMed] [Google Scholar]
- 66.Bastian M, Heymann S, Jacomy M. Gephi: An Open Source Software for Exploring and Manipulating Networks 2009 [Google Scholar]