

Abstract
Arctic ground squirrels (Urocitellus parryii) are active for a scant 3 to 5 months of the year. During the active season, adult squirrels compete for mates, reproduce, and fatten in preparation for hibernation, while juvenile squirrels, weaned in early July, must grow and acquire sufficient fat to survive their first hibernation season. During hibernation, the gut microbial community is altered in diversity, abundance, and activity. To date, no studies have examined the gut microbiota of hibernators across the truncated active season. We characterized trends in diversity (454 pyrosequencing), density (flow cytometry), viability (flow cytometry), and metabolism (short-chain fatty acid analysis) of the gut microbial community of juvenile arctic ground squirrels across their first active season at weaning and at 4, 6, 8, and 10 weeks postweaning. At 8 weeks postweaning, the mean bacterial density was significantly higher than that at weaning, and the mean percentage of live bacteria was significantly higher than that at either weaning or 4 weeks postweaning. No significant differences in microbial diversity, total short-chain fatty acid concentrations, or molar proportions of individual short-chain fatty acids were observed among sample periods. The level of variability in gut microbial diversity among squirrels was high across the active season but was most similar among littermates, except at weaning, indicating strong maternal or genetic influences across development. Our results indicate that genetic or maternal influences exert profound effects on the gut microbial community of juvenile arctic ground squirrels. We did not find a correlation between host adiposity and gut microbial diversity during prehibernation fattening, likely due to a high level of variability among squirrels.
INTRODUCTION
Hibernation is a behavioral and physiological adaptation expressed primarily by small mammals (<5 kg) to survive seasonal periods of high energy demand and reduced forage availability (1, 2). Of hibernating species, the arctic ground squirrel (Urocitellus parryii) exhibits the most extreme physiology during their annual cycle (3, 4). Depending on sex and age, arctic ground squirrels spend 7 to 9 months in hibernation and are active for a scant 3 to 5 months of the year, during which they compete for mates, reproduce, and fatten in preparation for hibernation (5, 6). Following weaning, juvenile arctic ground squirrels have two months in which to grow and acquire sufficient fat to survive their first hibernation season (5). For arctic ground squirrels to survive the long fast of hibernation, it is essential that they accumulate significant endogenous energy reserves. Within the short arctic summer, accretion of reserves is confined to a 3-week-long period preceding hibernation when animals increase from ∼5% to >45% body fat (5).
Few studies have investigated the gut microbiota of hibernators (7–9), and even fewer have done so using modern techniques (i.e., 454 pyrosequencing) (10, 11). Hibernation alters microbial diversity, dominant taxa, and metabolic production in thirteen-lined ground squirrels (Ictidomys tridecemlineatus) (10) and arctic ground squirrels (11) compared to summer squirrels. However, to our knowledge, no studies have described the gut microbiota of a hibernator across the active season or development.
Maternal microbial communities (skin, vaginal, and gut) provide the initial inoculum for the gut microbiota in mammalian newborns (12), and subsequent exposures to microbes and stochastic factors continue to shape the gut microbial community throughout an individual's lifetime (13, 14). The neonatal gut microbiota is unstable, characterized by fluctuations in dominant taxa (14). Variation decreases over time, and once an infant is weaned, the gut microbiota transitions to resemble the adult microbial community (13, 14), stabilizing at approximately 2 to 3 weeks postweaning (15).
Numerous factors affect the variability in adult microbiota between individuals. Intraspecies gut microbial structure is more similar than interspecies gut microbial structure (16), yet the level of variation among individuals within species is high (17). In general, related individuals have more similar gut microbiotas than unrelated individuals (18). Litter effects, the greater similarities in gut microbiota among littermates than among unrelated individuals, are due primarily to maternal effects (initial exposure to the mother's microbiota) (19–21). Other factors that affect variability include host genotype (18, 19), immunity (19, 21), diet (20, 22), environmental and stochastic factors (19, 23), age, and sex (19).
Given the rate and degree of fattening of arctic ground squirrels prior to hibernation, it is plausible that juvenile ground squirrels develop a gut microbiota that facilitates fattening. In mice and humans, taxonomic changes and increased metabolic activity of gut microbiota are associated with diet-induced obesity (20, 24–26). In addition, the obesity-associated gut microbiota of mice is more efficient at liberating energy from the diet and promotes the storage of triglycerides in adipose tissue (25, 27).
The mechanism and timing of the alterations in gut microbiota that occur during hibernation (11) remain unknown. In the weeks prior to the onset of hibernation, obligate hibernators decrease rates of feeding and activity (28–30). Reduced feeding correlates with changes in gastrointestinal tract (GIT) physiology (29) that occur prior to hibernation in alpine marmots (Marmota marmota) and thirteen-lined ground squirrels (31, 32). It is possible that the decreased metabolic rate (33) and decreased body temperature (Tb) (34) in arctic ground squirrels are reflective of reduced feeding and changes in the gut and gut microbiota in preparation for the onset of hibernation.
To characterize the development of the gut microbiota of captive-born juvenile arctic ground squirrels, we assessed the microbial diversity, density, viability, and metabolic activity of the cecal microbial community across their first active season. Our sample design emphasized examination of the gut microbiota during prehibernation fattening and the period immediately prior to the onset of hibernation of squirrels in order to elucidate correlations between prehibernation fattening and characteristics of their gut microbiota.
MATERIALS AND METHODS
Animal husbandry.
We trapped free-living pregnant arctic ground squirrels (Urocitellus parryii) in the northern foothills of the Brooks Range, AK (68°38′N, 149°38′W), and transported them to the University of Alaska Anchorage (UAA). During gestation and lactation, squirrels were housed in individual tubs (38 by 56 by 20 cm; Nalgene, Rochester, NY, USA) at 18°C with 2 h of light per day, provided sufficient material to build nests, and fed Mazuri rodent chow (Mazuri, Brentwood, MO, USA) supplemented with fruit and sunflower seeds ad libitum. Once pups showed an interest in solid food and were >150 g (∼4 weeks after birth), they were separated from their mothers and housed individually in metal cages (46 by 30 by 30 cm) at 25°C with a 10-h–14-h light-dark cycle for the remainder of the study. For the first week following weaning, we fed pups sunflower seeds, fruit, rodent chow, and water; thereafter, in order to control for diet, pups were provided only rodent chow and water ad libitum. All procedures were approved by the UAA Institutional Animal Care and Use Committee (approval numbers 156096, 156099, and 156098).
Sample design and collection.
We distributed 25 squirrels from five litters (of equal size; n = 5) across five sample periods (at weaning and 4, 6, 8, and 10 weeks postweaning), such that no sample period contained related individuals (i.e., littermates). At each sample period, squirrels were euthanized and immediately weighed (±0.01 g) and measured (length from nose to anus) (±0.1 cm). Abdominal white adipose tissue (WAT) was excised and weighed (±0.01 g), and ceca were ligated at both ends to prevent loss of contents, excised, and weighed (±0.01 g). We massaged cecal contents into a sterile petri dish, reweighed the emptied ceca, and determined the wet weight of cecal contents by subtraction. Cecal contents were subsampled for pyrosequencing (1 to 2 g) and short-chain fatty acid (SCFA) (1 to 2 g) analyses and stored at −80°C for no more than 6 months. Samples for flow cytometry analysis were immediately transferred into to an anaerobic chamber (80% N2, 10% CO2, and 5 to 10% H2; Plas Labs, Lansing, MI, USA) and processed, whereas those used for analysis of DNA and SCFAs were stored at −80°C.
Flow cytometry.
We determined bacterial density and viability by flow cytometry as described previously by Ben-Amor et al. (35), with modifications described previously by Sonoyama et al. (9). Cecal contents (0.01 g) were suspended in anaerobic phosphate-buffered saline (PBS) containing 1 mM dithiothreitol, 5 mM EDTA, and 0.01% (wt/vol) Tween 20 for 15 min and vortexed for 3 min. After centrifugation (700 × g for 1 min), we decanted the supernatant and centrifuged it at 6,000 × g for 3 min. The resulting pellet was washed twice with anaerobic PBS, resuspended, and serially diluted. Samples for bacterial viability were incubated with 5 mM SYTO BC and 14.5 μmol/ml propidium iodide (PI) for 15 min at room temperature in the dark. Controls for bacterial viability included an unstained sample, a live-stained sample (SYTO BC only), and a heat-killed sample with dead stain (PI only). To determine microbial density, we incubated samples (10 μl) with 1,000× SYTO BC for 10 min at room temperature in the dark. Beads (6 μm; 1 × 10⁶ beads/ml) were added to the tubes, and bacterial densities were determined as the ratio of cells to beads. Controls contained beads and unstained cells.
Samples were vortexed just prior to analysis on a FACScalibur flow cytometer (Becton, Dickinson [BD], San Jose, CA, USA) that was calibrated daily with Calibrite3 beads (BD). Data were analyzed by using CellQuest software (BD). We measured all parameters using logarithmic amplification, and forward scatter (FSC) was set at E01 (i.e., multiplied by a power of 10). Background noise was eliminated by using a double threshold (FSC and side scatter [SSC]). Samples were run on a low-flow-rate setting with a goal of 200 to 600 events/s.
Roche 454 pyrosequencing of microbial 16S rRNA genes.
We extracted microbial DNA from 0.25 g of cecal contents using MoBio PowerSoil kits (MoBio, Carlsbad, CA, USA) according to the manufacturer's protocols, with the following modifications: (i) the power bead tube was incubated at 60°C for 12 min prior to the 15-min vortexing step, and (ii) an additional 100% ethanol wash was performed prior to the 70% ethanol wash. We determined DNA concentrations and purity by using a Nanodrop ND-1000 spectrophotometer (Thermo-Scientific, Wilmington, DE, USA).
The V4-V5 region of the bacterial 16S rRNA gene was amplified by using universal eubacterial primers (530F and 1100R; Molecular Research, Shallowater, TX, USA). A single-step 30-cycle PCR using a HotStarTaq Plus master mix kit (Qiagen, Valencia, CA, USA) was performed under the following conditions: 94°C for 3 min followed by 28 cycles of 94°C for 30 s, 53°C for 40 s, and 72°C for 1 min and a final elongation step at 72°C for 5 min. Following PCR, all amplicons from individual squirrel cecal samples were barcoded (5′ end), mixed in equal concentrations, and purified by using Agencourt Ampure beads (Agencourt Bioscience Corporation, MA, USA). Samples were sequenced by utilizing Roche 454 FLX titanium instruments and reagents according to the manufacturer's guidelines (Molecular Research LP, Shallowater, TX, USA).
We used QIIME 1.6.0 (36) to process the pyrosequencing data. Sequences were demultiplexed, and primers (both forward and reverse), short sequences (<200 bp), sequences with >6 ambiguous base calls, and sequences with homopolymeric runs exceeding 6 bp were removed. Sequences were preclustered, denoised by using Denoiser (37), and subsequently assessed for reverse primers (which were removed if detected). We clustered sequences into operational taxonomic units (OTUs) at 97% similarity and removed chimeras (both de novo-based and reference-based checks) using USEARCH 5.2.32 (38). Taxonomy was assigned to the representative OTUs by using Ribosomal Database Project Classifier 2.2 retrained on the Greengenes reference sequence data set (39, 40). We removed singleton sequences from the OTU table, aligned representative OTUs using PyNAST (41), and filtered them using the Greengenes lane mask. Finally, we used the filtered and aligned OTUs to construct a phylogenetic tree using FastTree 2.1.3 (42).
Short-chain fatty acid analysis.
We centrifuged cecal contents (1.0 g) at 10,000 × g for 10 min and kept the supernatant. We repeated the centrifugation step and combined supernatants until no supernatant formed. The combined supernatant was acidified (36 N H2SO4; 0.2× supernatant volume), vortexed, centrifuged at 15,000 × g for 10 min, and assayed via gas chromatography at the U.S. Department of Agriculture Dairy Forage Research Center, Madison, WI, USA. Samples were passed through a glass precolumn (30 mg of glass wool) and analyzed by using a Shimadzu GC17A instrument (Shimadzu, Kyoto, Japan) equipped with a flame ionization detector (250°C) connected to a Phenomenex Zebron ZB-FFAP column (Torrance, CA, USA; 30- by 0.53-mm internal diameter [i.d.] by 1.0 μm) (100°C for 1 min, ramped [10°C m−1] to 130°C for 3 min, and then 135°C for 1 min) with splitless injection (230°C). We created individual standard curves for each analyte (acetate, propionate, butyrate, valerate, iso-butyrate, and iso-valerate) using a multipoint calibration (0, 15, 25, and 45 mM) with 2-ethylbutyrate as the internal standard.
Statistical analysis.
The change in body mass for individual squirrels (except at weaning) was calculated as the difference between body mass at sampling and body mass 2 weeks earlier. We determined differences in body mass, percent abdominal WAT mass, and change in body mass among sample periods using one-way analysis of variance followed by Tukey's honestly significant difference (HSD) test.
We determined alpha diversity using three metrics: (i) observed species, (ii) whole-tree phylogenetic diversity, and (iii) Chao1. We calculated bacterial alpha diversity by rarefying the OTU table from 1 up to 9,000 sequences/sample at increasing steps of 1,000 sequences/sample for a total of 9 sample points per curve. At each step, the rarefied OTU tables underwent 25 repetitions, and a maximum value of 9,000 sequences/sample was chosen to ensure that all curves were continuous. For the Chao1 rarefaction curves, we constructed a unique OTU table that included singleton sequences. We tested for pairwise statistical differences among sample periods and litters for all three metrics using nonparametric t tests with Monte Carlo permutations (n = 999) on the rarified OTU table for the 9,000 sequences/sample.
For analysis of beta diversity, we used an OTU table standardized to the minimum number of sequences/sample (10,634 sequences) to decrease the weight of more abundant OTUs. We calculated beta diversity using the unweighted and weighted UniFrac distance metrics (43). A principal coordinates analysis (PCoA) using both distance metrics was performed and visualized by using two-dimensional ordination plots. Additionally, we performed a cluster analysis (using an average linkage, visualized by using FigTree 1.3 [2007; A. Rambaut {http://tree.bio.ed.ac.uk/software/figtree}]) from the unweighted UniFrac distance metric. We tested for statistical differences in beta diversity among sample periods and litters using a pairwise one-way permutational multivariate analysis of variance in PRIMER 6 (44). Dispersion was determined for sample groups and comparisons were made between sample groups within a sample period by using a pairwise permutational analysis of multivariate dispersion with PRIMER 6 software.
We summarized bacterial taxonomies at the phylum, class, order, family, and genus levels from the same standardized OTU table as that used for the beta diversity analysis. Taxonomies at each level were grouped by sample period as well as by litter and tested for significant differences by using a Kruskal-Wallis rank-sum test in R (version 2.13.1). For bacterial densities, viabilities, and SCFA concentrations and molar proportions, we determined statistical differences among sample periods using a Kruskal-Wallis rank-sum test. For all tests, differences were considered significant at a P value of <0.05.
Nucleotide sequence accession number.
All 16S rRNA gene sequences have been submitted to the DDBJ/EMBL/GenBank databases under accession number SRP033572.
RESULTS
Animal characteristics.
Squirrels grew in length and mass across the active season, with significant differences among sample periods. The mean squirrel length at 6 weeks postweaning was significantly greater than that at 4 weeks postweaning; lengths between 6 and 10 weeks postweaning were similar (range, <0.5 cm). Body mass and percent abdominal fat were significantly higher in squirrels at 10 weeks postweaning than at all other sample periods except 8 weeks postweaning. Body mass normalized to length was significantly higher in squirrels at 10 weeks postweaning than in squirrels at 4 weeks and 6 weeks postweaning, and there were no significant differences between squirrels at 4 weeks and 6 weeks postweaning. Likewise, percent fat mass normalized to body length was significantly higher at 10 weeks postweaning than at 4 weeks and 6 weeks postweaning. The change in body mass between 8 weeks and 10 weeks postweaning was significantly less than that observed among all other sampling periods (Table 1). The mean mass of cecal contents peaked at 6 weeks postweaning and was significantly higher than that at weaning (Table 1).
TABLE 1.
Physiological characteristics of juvenile arctic ground squirrels
| Parameter | Mean value ± SE for sample perioda |
||||
|---|---|---|---|---|---|
| Weaning (n = 5) | 4 wk postweaning (n = 5) | 6 wk postweaning (n = 5) | 8 wk postweaning (n = 5) | 10 wk postweaning (n = 5) | |
| Age (days) | 33.6 ± 0.9A | 63.6 ± 0.9B | 78.0 ± 1.0C | 93.0 ± 0.9D | 109 ± 1.2E |
| Length (cm) | ND | 25.0 ± 0.4A | 27.4 ± 0.3B | 27.3 ± 0.4B | 27.3 ± 0.4B |
| Mass (g) | 166 ± 9.6A | 438 ± 19.0B | 575 ± 24.0C | 643 ± 33.6D | 714 ± 43.5D |
| Mass (normalized)b (g) | ND | 17.1 ± 0.57A | 19.5 ± 0.8A | 23.7 ± 1.0B | 26.4 ± 1.3B |
| Δ massc (g) | ND | 92.4 ± 14.7Ad | 131 ± 14.6A | 74.0 ± 20.4A | 26.6 ± 7.9B |
| % abdominal WAT mass | ND | 3.34 ± 0.2A | 5.75 ± 0.5B | 7.80 ± 0.6C | 9.30 ± 0.7C |
| % abdominal WAT mass (normalized)b | ND | 0.13 ± 0.01A | 0.21 ± 0.02B | 0.29 ± 0.02B,C | 0.33 ± 0.02C |
| Cecal content (g) | 5.94 ± 1.0A | 11.9 ± 3.0A,B | 13.59 ± 2.2B | 10.91 ± 1.4A,B | 8.08 ± 2.3A,B |
Different superscript letters indicate significant differences among sample periods. ND, not determined.
Normalized to squirrel length.
Mean change in mass from 2 weeks prior to sampling.
For the squirrels at 4 weeks postweaning, the mass from 2 weeks postweaning was used to calculate the change in mass.
Microbial taxonomic summary.
A total of 403,426 16S rRNA gene reads were sequenced from 23 squirrel ceca. Two samples were eliminated from the diversity analysis due to poor sequencing read quality. After quality processing, 318,147 sequences remained, with an average of 13,832 sequences/sample. Additionally, 6,220 OTUs were identified from the processed sequence reads, and rarefaction curve analysis indicated that pyrosequencing captured the majority of microbial diversity in our samples (see Fig. S1 in the supplemental material).
Ten bacterial phyla were identified across all sample periods. Over 95% of the classified OTUs belonged to the phyla Bacteroidetes and Firmicutes, and the remaining OTUs belonged primarily to the phyla Verrucomicrobia and Proteobacteria (see Fig. S1 and Table S1 in the supplemental material). Of the OTUs assigned to Bacteroidetes, >99% were matched to the class Bacteroidia and the order Bacteroidales. At the family level, OTUs were classified primarily into the S24-7 family (highest relative abundance), Bacteroidaceae, Rikenellaceae, Prevotellaceae, and an unclassified family of Bacteroidales. The dominant genera included Bacteroides, Prevotella, Alistipes, and an unclassified genus of the S24-7 family (see Fig. S2 and Table S1 in the supplemental material).
The OTUs assigned to Firmicutes were matched to the classes Clostridia (highest relative abundance) and Bacilli as well as the orders Clostridiales and Lactobacilliales. The OTUs assigned to Clostridiales were further classified into the families Lachnospiraceae and Ruminococcaceae, while the OTUs assigned to the Lactobacilliales were classified solely into the family Lactobacillaceae. At the genus level, Ruminococcus and Oscillospira were present in low relative abundances; however, the majority of the OTUs were assigned to unclassified genera of the Lachnospiraceae, Ruminococcaceae, and Lactobacillaceae families (see Fig. S2 and Table S1 in the supplemental material).
All OTUs belonging to Verrucomicrobia were assigned to the genus Akkermansia. The majority of OTUs assigned to Proteobacteria were matched to the class Alphaproteobacteria; however, no family or genus of OTUs belonging to Proteobacteria exceeded 1% relative abundance.
Alpha and beta diversities by sample period and litter.
There were no significant differences in alpha or beta diversity of gut microbial communities among sample periods (see Fig. S1 in the supplemental material). In addition, there were neither significant differences nor tendencies in relative abundances of individual taxa at any level when samples were grouped by sample period or by litter (see Fig. S2 and Tables S1 and S2 in the supplemental material). The level of variance in gut microbial composition was high within sample periods.
Cluster analysis and PCoAs derived from the unweighted UniFrac metric revealed that, with the exception of the weaning period, gut microbiotas of squirrels clustered more closely with those of their littermates than with those of squirrels within their sample period (Fig. 1 and 2A). There was a significant separation along the 1st principal coordinate (PC1) axis of the gut microbial communities of two litters of squirrels (litters 11-21 and 11-13) from those of the three other litters of squirrels (litters 11-05, 11-12, and 11-19) (Fig. 2A). This separation explained 21.58% of the variation in gut microbiotas among squirrels (P = 0.013 to 0.0244). Grouping of the alpha diversity rarefaction plots by litter revealed that the gut microbiotas belonging to the squirrels from litters 11-21 and 11-13 were significantly less diverse in all three metrics than those of squirrels from litters 11-05, 11-12, and 11-19 (Fig. 3) and that none of the gut microbiotas of litters that separated together along the PC1 axis significantly differed from each other.
FIG 1.
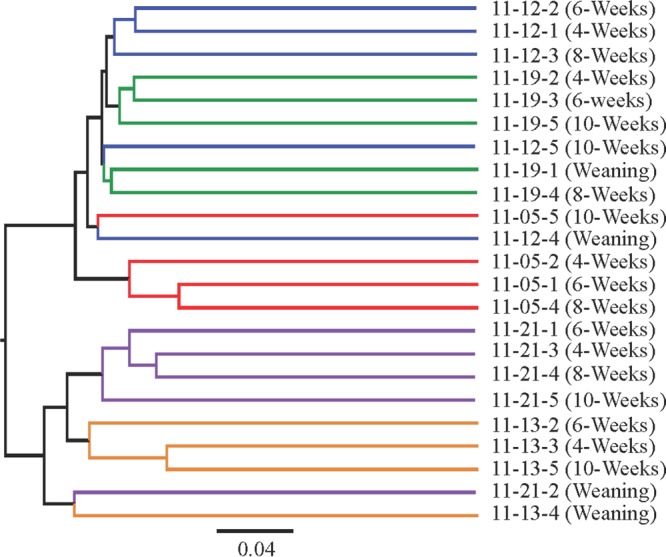
Cluster analysis of gut microbial communities. Each line represents an individual squirrel (indicated by its identification number, i.e., squirrel 11-012-2). The cluster analysis was created by using an average linkage from the unweighted UniFrac distance matrix. Branch colors are representative of litters 11-05 (red), 11-12 (blue), 11-13 (gold), 11-19 (green), and 11-21 (purple). This figure was created with FigTree 2.1.3.
FIG 2.
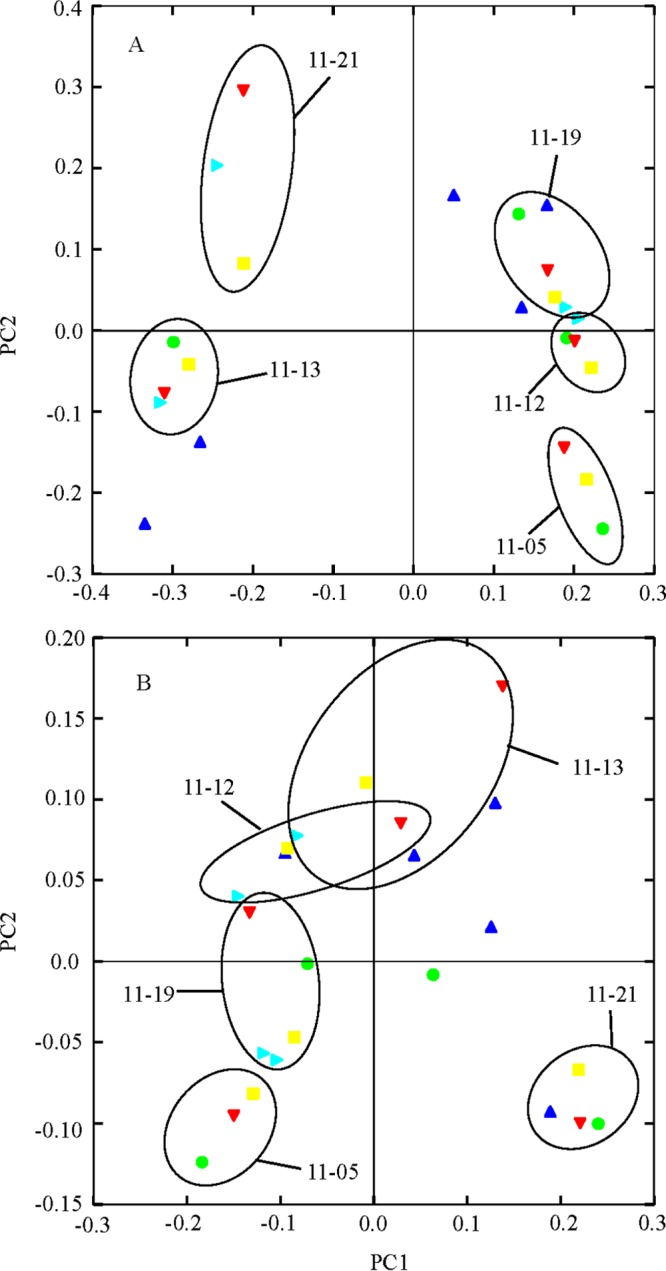
Principal coordinate analysis plots (PC1 versus PC2) of the unweighted UniFrac (A) and weighted UniFrac (B) distance metrics colored by sample period. Each point (symbol) represents the gut microbial community of an individual arctic ground squirrel. Circles encompass littermates distributed across the active season. Symbols: blue triangles, weaning; red triangles, 4 weeks postweaning; green circles, 6 weeks postweaning; yellow circles, 8 weeks postweaning; teal triangles, 10 weeks postweaning.
FIG 3.
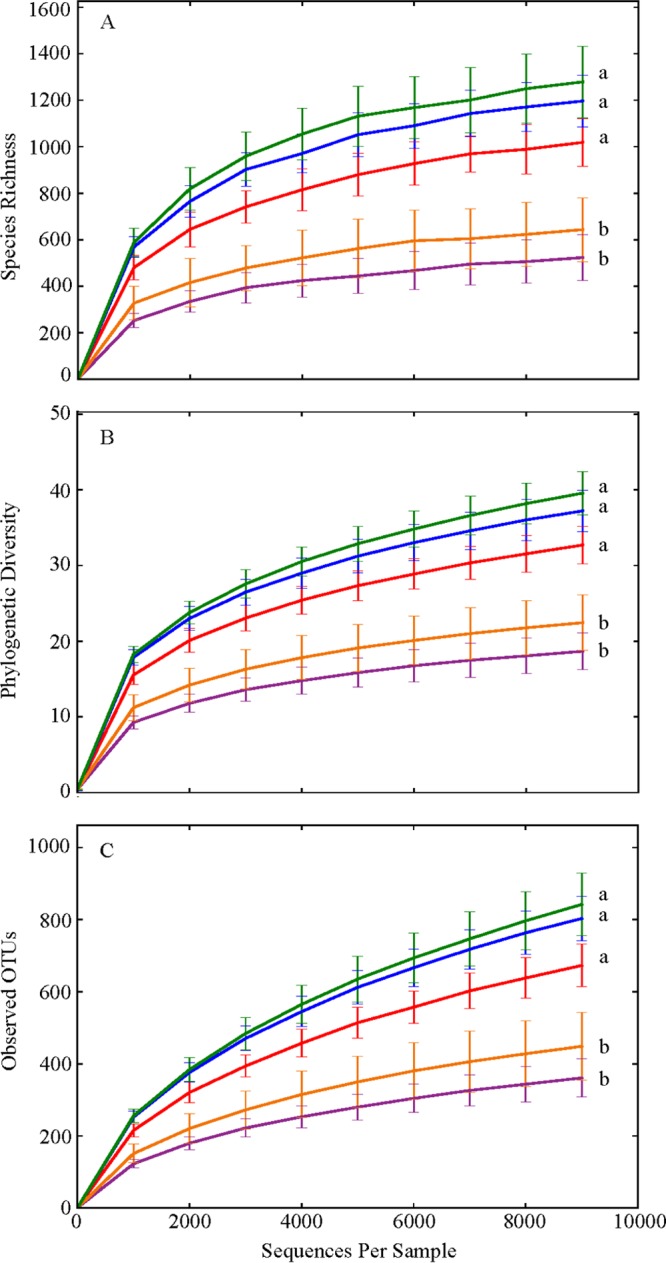
Alpha diversity rarefaction plots sorted by litter. (A) Chao1; (B) whole-tree phylogenetic diversity; (C) observed OTUs. Each line represents the alpha diversity within a litter sampled across the active season. Each point in the curve represents the mean value ± the standard error. Red, litter 11-05; green, litter 11-12; gold, litter 11-13; blue, litter 11-19; purple, litter 11-21. Letters indicate statistical differences among litters. Rarefaction plots were produced with QIIME 1.6.0.
Cluster analysis (data not shown) and PCoA derived from the weighted UniFrac analysis (Fig. 3B) indicated clustering among littermates similar to, albeit looser than, that seen with the unweighted UniFrac analysis. Separations among all litters, except between litters 11-12 and 11-13, were significant (P values ranged from 0.029 to 0.0488). Litter 11-13 did not separate from litters 11-05, 11-12, and 11-13 along the PC1 axis, as observed in the unweighted UniFrac PC1-versus-PC2 PCoA plot. However, four members of the 11-21 litter showed a greater separation from all other litters. None of the litters compared to each other had a significantly greater dispersion (Fig. 2B).
Short-chain fatty acid analysis.
There were no significant differences in concentrations or molar proportions of SCFAs across the active season (Table 2). Mean SCFA concentrations tended to be lowest at weaning (103.88 ± 9.7 mM) and 4 weeks postweaning (106.97 ± 17.1 mM) and highest at 6 weeks postweaning (161.99 ± 18.7 mM). Also, mean SCFA concentrations tended to be lower at both 8 and 10 weeks postweaning (134.60 ± 18.6 mM and 134.60 ± 18.6 mM, respectively) than at 6 weeks postweaning (Table 2).
TABLE 2.
Short-chain fatty acid concentrations and molar proportionsa
| Parameter | Mean value ± SE for sample period |
||||
|---|---|---|---|---|---|
| Weaning (n = 5) | 4 wk postweaning (n = 5) | 6 wk postweaning (n = 5) | 8 wk postweaning (n = 5) | 10 wk postweaning (n = 5) | |
| Total SCFA concn (mM) | 103 ± 9.7 | 106 ± 17.1 | 161 ± 18.7 | 134 ± 18.8 | 117 ± 5.0 |
| Individual SCFA concn (mM) | |||||
| Acetate | 68.2 ± 1.3 | 68.5 ± 12.9 | 111 ± 14.7 | 75.1 ± 11.1 | 89.3 ± 5.1 |
| Propionate | 10.3 ± 1.2 | 12.0 ± 21.3 | 21.3 ± 3.6 | 12.0 ± 10.3 | 10.3 ± 0.9 |
| Butyrate | 23.7 ± 5.9 | 23.6 ± 7.5 | 27.2 ± 5.1 | 33.5 ± 9.5 | 16.3 ± 5.6 |
| Molar proportion (%) | |||||
| Acetate | 67.0 ± 3.2 | 65.2 ± 2.5 | 68.3 ± 2.7 | 62.4 ± 2.3 | 76.6 ± 8.9 |
| Propionate | 10.0 ± 0.8 | 12.2 ± 1.5 | 12.9 ± 1.6 | 10.8 ± 2.1 | 8.94 ± 1.0 |
| Butyrate | 21.5 ± 3.2 | 19.8 ± 1.1 | 17.3 ± 3.5 | 25.2 ± 4.7 | 13.5 ± 4.3 |
Values for iso-butyrate, iso-valerate, and valerate are not included but are factored into the molar proportion values.
The mean acetate concentration and molar proportion (83.72 ± 5.12 mM and 68.09% ± 1.51%, respectively) tended to be higher than those of butyrate (24.49 ± 2.86 mM and 19.26% ± 1.73%, respectively) and propionate (13.45 ± 1.17 mM and 10.99% ± 0.62%, respectively) at all sample periods (Table 2). The mean molar proportion of acetate tended to be lower at 8 weeks postweaning (62.39% ± 2.79%) and highest at 10 weeks postweaning (76.61% ± 3.88%). Butyrate was inversely related to acetate; the highest levels occurred at 8 weeks postweaning (25.17% ± 4.70%), while the lowest levels were found at 10 weeks postweaning (13.50% ± 4.27%). Molar proportions and concentrations of propionate remained relatively stable across the active season (Table 2). Concentrations of valerate, iso-butyrate, and iso-valerate were <2 mM, or a <1% molar proportion, and were not included in any downstream analyses.
Exploration of the SCFA data for associations with the dominant bacterial phyla revealed that butyrate concentrations and molar proportions were positively correlated with the relative abundance of Firmicutes (P = 0.0242 for both, determined by Pearson correlation) and that the relative abundance of Firmicutes explained 45.5% of the variation in butyrate levels. Conversely, the Bacteroidetes relative abundance was negatively correlated with butyrate concentrations (P = 0.04219). There were no significant correlations between the abundance of Firmicutes or Bacteroidetes and the concentration or molar proportion of acetate.
Bacterial cell density and viability.
Bacterial densities ranged from 10.24 ± 0.05 log cells/g at weaning to 10.53 ± 0.05 log cells/g at 8 weeks postweaning (Table 3). The only significant difference between sample periods occurred between weaning and 8 weeks postweaning. Although not significant, bacterial densities at 8 weeks postweaning tended to be higher than at all other sample periods (Table 3).
TABLE 3.
Bacterial densities and viabilities from squirrel cecal contentsa
| Parameter | Mean value for sample period ± SE |
||||
|---|---|---|---|---|---|
| Weaning (n = 5) | 4 wk postweaning (n = 5) | 6 wk postweaning (n = 5) | 8 wk postweaning (n = 5) | 10 wk postweaning (n = 5) | |
| Density (log cells/g) | 10.24 ± 0.05A | 10.31 ± 0.06A,B | 10.33 ± 0.08A,B | 10.53 ± 0.05B | 10.45 ± 0.06A,B |
| Viability (%) | |||||
| Live cells | 61.68 ± 1.32A | 64.24 ± 1.83A | 77.89 ± 4.02A,B | 79.34 ± 2.40B | 71.61 ± 4.56A,B |
| Dead cells | 29.44 ± 2.18A | 28.95 ± 1.82A | 16.06 ± 2.89A,B | 16.31 ± 2.31B | 20.27 ± 3.18A,B |
| Injured cells | 8.79 ± 1.11 | 6.80 ± 1.01 | 6.05 ± 1.48 | 9.02 ± 4.46 | 8.12 ± 1.55 |
Different letters indicate significant differences among sample periods.
The percentage of injured bacterial cells remained constant across the active season, while the percentage of live cells was inversely related to that of dead cells (Table 3). The highest mean percentage of live cells occurred at 8 weeks postweaning (79.34% ± 2.40%) and was significantly higher than those at both weaning (61.68% ± 1.32%) and 4 weeks postweaning (64.24% ± 1.83%). The mean percentage at 6 weeks postweaning (77.89% ± 4.02%) was only slightly lower than that at 8 weeks postweaning; however, levels were not significantly different from those at any other sample period. The percentage of live cells at 10 weeks postweaning (71.61% ± 4.56%) tended to be lower than those at both 6 and 8 weeks postweaning (Table 3). The highest percentage of dead bacterial cells occurred at weaning (29.43% ± 2.18%), and the lowest occurred at 6 weeks postweaning (16.06% ± 2.06%) (Table 3). Dead cell percentages at weaning and 4 weeks postweaning (28.95% ± 1.81%) differed only slightly, but both were significantly higher than those at 6 and 8 weeks postweaning (16.31% ± 2.13%). Dead cell percentages at 10 weeks postweaning (20.27% ± 3.18%) tended to be lower than those at 6 and 8 weeks postweaning (Table 3).
DISCUSSION
The gut microbiota of arctic ground squirrels during the active season was characterized by high levels of variation in SCFA concentrations, densities, viabilities, and relative abundances of dominant taxa. A high level of variation likely contributed to the failure to detect significant differences in microbial diversity and SCFA concentrations between gut microbiotas within sample periods. The positive correlation between the butyrate concentration and Firmicutes relative abundance is not surprising, given that taxa within the Firmicutes are the primary butyrate producers in the gut (45). A similar correlation was found previously for active and hibernating thirteen-lined ground squirrels (10). Firmicutes relative abundance is correlated with diet-induced obesity in mice (20, 24, 25); however, no correlations between body condition and butyrate concentration or Firmicutes relative abundance were detected in this study. Consequently, these data provide no robust evidence of development of a gut microbiota in arctic ground squirrels to facilitate fat deposition during the prehibernation fattening period.
We found no robust evidence that alterations in the gut microbiota characteristic of those observed in hibernating arctic ground squirrels (11) occur prior to the onset of hibernation. Physiological parameters (lethargy, reduced food intake, and loss of body mass) of squirrels observed at 10 weeks postweaning indicated that the squirrels were preparing to hibernate. The timing of this sample period (early to mid-September) coincides with the period of reduced metabolism and Tb observed prior to hibernation (33, 34) and with the immergence of free-living juvenile arctic ground squirrels into hibernation (5). While the mean bacterial density, percentages of live and dead bacteria, SCFA concentration, and molar proportions of butyrate and acetate at 10 weeks postweaning tended to resemble the hibernation phenotype of arctic ground squirrels (11) compared to those at 6 and 8 weeks postweaning, no conclusions can be made given the lack of significant differences. Additionally, the ratio of Firmicutes to Bacteroidetes at 10 weeks postweaning was unlike the low ratio observed for hibernating arctic ground squirrels (11).
The litter effect persists across the active season.
Our results suggest a strong litter effect on the gut microbiota of arctic ground squirrels across the first active season. Similarities in the gut microbiotas of littermates persisted across all sample periods except at weaning, and the high level of variation among individuals within sample periods is likely attributable to this, a factor to be considered in future study designs. Litter effects are primarily the result of maternal influences. Although we did not examine the gut microbial communities of the mothers and cannot compare them to those of their offspring, maternal influences are well documented, influence both beta diversity and bacterial phylotypes, and are known to exert an effect on gut microbiotas for up to four generations (19–21) in isogenic mice.
In our study, a litter effect was observed whether or not the relative abundance of community members was taken into account; however, the effect was less robust in the latter case. Although maternal influences have been shown to affect relative abundances of bacterial phylotypes in the gut of mice (19), differences in relative abundances among littermates are not uncommon even where litter effects are observed (20, 21). Mice reared in individual cages, and thus exposed to different microenvironments and stochastic factors, have significantly different gut microbial compositions among littermates (23). Host genotype is also known to affect the relative abundance of gut microbes and may further explain the variation seen among squirrels and the less robust effect of litter when relative abundance was taken into account. Given that the majority of litters of arctic ground squirrels are sired by more than one male (46) and that in our study we captured free-living pregnant females that gave birth in the laboratory, there is a high likelihood that some of the variance that we measured in the microbiotas of the litters is due to variance in host genotype. Interestingly, the arctic ground squirrel's gut microbial community diversity drastically changes and shows decreased variation among animals during the hibernation season compared to squirrels during the active season (11). It would be of interest to determine if the litter effect on gut microbial diversity persists into the second active season.
The gut microbiotas of squirrels sampled at weaning were idiosyncratic and not similar to those of their littermates or each other. Prior to weaning, the neonatal gut microbial community composition is known to be unstable, changing temporally with exposure to environmental microbes and perturbations such as disease (13). The instability of the gut microbial community of mice continues at weaning as they are exposed to new food and their immune systems continue to mature (15). In our study, weaning arctic ground squirrels had access to and were observed eating sunflower seeds and fruit (provided to supplement mothers) in addition to rodent chow and mother's milk. The cecal contents of weaning squirrels reflected their varied diet.
Our observation of a litter effect in littermates sampled during 4 weeks postweaning through 10 weeks postweaning but not at weaning is likely due to the development of a stable adult gut microbiota and a standardized diet. In humans and mice, an adult-like gut microbiota begins to take shape only after the introduction of solid food but does not reach a stable adult-like community until many weeks postweaning (14, 15). The month separating the weaning and 4-weeks-postweaning sampling periods likely provided sufficient time for the gut microbiotas of littermates to converge to form stabilized, adult-like communities. The standardization of the diet to only rodent chow during that time period likely contributed as well, as long-term dietary patterns have been shown to stabilize the gut microbial communities of humans (47).
Differences in microbial diversity among litters.
No variable measured in this study explained the reduced alpha diversity and distinct separation observed in the unweighted UniFrac PCoA for squirrels from litters 11-21 and 11-13 compared to those from litters 11-05, 11-12, and 11-19. We conclude from the alpha diversity analyses, which compared diversity within litters in this case, that litters 11-13 and 11-21 harbored gut microbiotas with fewer overall OTUs, likely devoid of less abundant taxa (as determined by Chao1 analysis) and more phylogenetically similar to each other than to those of litters 11-05, 11-12, and 11-19. The separation among litters along the PC1 axis of the unweighted UniFrac metric, which does not take into account relative abundance (43), indicates that the gut microbial communities did not share a similar phylogenetic divergence. When relative abundance is accounted for in the weighted UniFrac analysis, a strong separation remained only between litter 11-21 and the other four. Squirrels from litter 11-21 had a mean relative abundance of S24-7 that was twice the mean of the next closest litter (11–19) and contained a higher mean relative abundance of Bacteroidetes than those from any other litter. High relative abundances of a particular organism or closely related taxa could also explain the lower alpha diversity observed for litter 11-21.
Other factors that we did not measure or account for might explain the observed differences in alpha and beta diversities among the litters. For example, host disease has been shown to decrease gut microbial diversity in mice (22), although none of our squirrels exhibited obvious health problems. Additionally, mutations in genes that control adaptive and innate immune functions in the gut (secretory IgA, cytokines, and communication with gut epithelial receptors) are known to decrease diversity and increase the relative abundances of particular microbes (48–50). Unfortunately, we did not collect cecal material or squirrel tissues with the purpose of testing immune system characteristics and therefore cannot make any assumptions regarding immune system functionality in the squirrel pups. Similarly, although we do not have access to the cecal contents of the mothers, it would be of interest to determine if mothers of the litters also had a decreased diversity that may have been inherited by their offspring.
Conclusion.
To our knowledge, this is the first study to examine the gut microbiota of a hibernating species across the active season and development. Our results indicate that the large variation in gut microbial diversity within sample periods is likely explained by a strong litter effect, assumed to be caused primarily by maternal and genetic influences, and suggest that maternal and genetic influences profoundly shape the gut microbiota of arctic ground squirrels. We did not find evidence of development of a gut microbiota which facilitates fat deposition during the prehibernation fattening phase in captive arctic ground squirrels. Moreover, we did not detect significant alterations in the gut microbial community or its metabolic activity across the first active season, likely due to the high level of variation within sample periods combined with the small sample size and not because the community remained static over postweaning development. Determination of whether there is a more subtle relationship between prehibernation fattening and the gut microbiota requires studies using larger sample sizes of squirrels to overcome the high levels of variation in microbial characteristics, a precise determination of body composition (e.g., proximate chemical analysis), experimental manipulations (e.g., antibiotic treatments and host diet), and a more sophisticated analysis of microbial community activity (e.g., community transcriptomics).
Supplementary Material
ACKNOWLEDGMENTS
Funding for this project was provided by the NIH NIGMS (1R15GM098938-01 [K.N.D. and C.L.B.]), Alaska INBRE (NIH NIGMS grant P20GM103395 [T.J.S. and K.N.D.]), the UAF Center for Global Change (T.J.S.), UAA Innovate and EPSCoR (K.N.D. and C.L.B.), and UAA ENRI and the NSF (NSF-EF-0732763 and NSF-IOS 1147187 [C.L.B.]).
We thank an anonymous reviewer of a previous version of the manuscript. We also thank H. V. Carey for invaluable input during discussions of our findings and providing the SCFA extraction protocol utilized; W. J. Radloff and G. A. Brodrick of the U.S. Dairy Forage Research Center for technical assistance and use of instrumentation for SCFA analysis; M. D. Dillon and W. A. Walters for assistance with QIIME 1.6.0 software; and B. A. Quinlan, M. M. Richter, and B. M. Salli for assistance with animal care and sampling.
The content is solely the responsibility of the authors and does not necessarily represent the official views of the NSF or NIH. We declare no conflicts of interest.
Footnotes
Published ahead of print 2 May 2014
Supplemental material for this article may be found at http://dx.doi.org/10.1128/AEM.00737-14.
REFERENCES
- 1.Lyman CP, Willis JS, Malan A, Wang LCH. (ed). 1982. Hibernation and torpor in mammals and birds. Academic Press, New York, NY [Google Scholar]
- 2.Geiser F, Ruf T. 1995. Hibernation versus daily torpor in mammals and birds: physiological variables and classification of torpor patterns. Physiol. Zool. 68:935–966 [Google Scholar]
- 3.Barnes BM. 1989. Freeze avoidance in a mammal: body temperatures below 0°C in an arctic hibernator. Science 244:1593–1595. 10.1126/science.2740905 [DOI] [PubMed] [Google Scholar]
- 4.Buck CL, Barnes BM. 2000. Effects of ambient temperature on metabolic rate, respiratory quotient, and torpor in an arctic hibernator. Am. J. Physiol. Regul. Integr. Comp. Physiol. 279:R255–R262 http://ajpregu.physiology.org/content/279/1/R255 [DOI] [PubMed] [Google Scholar]
- 5.Buck CL, Barnes BM. 1999. Annual cycle of body composition and hibernation in free-living arctic ground squirrels. J. Mammal. 80:430–442 [Google Scholar]
- 6.Buck CL, Brenton A, Kohl F, Tøien Ø, Barnes BM. 2008. Overwinter body temperature patterns of free-living arctic ground squirrels (Spermophilis parryii). Torpor, hibernation and cryobiology, p 317–326 In Lovegrove BG, McKenchie AE. (ed), Hypometabolism in animals: torpor, hibernation and cryobiology. University of KwaZulu-Natal, Pietermaritzburg, South Africa [Google Scholar]
- 7.Schmidt JP. 1963. Microbiological aspects of hibernation in ground squirrels, p 399–421 In Viereck EG. (ed), Influence of cold on host-parasite interactions. Arctic Aeromedical Labortory, Fort Wainwright, AK [Google Scholar]
- 8.Barnes EM, Burton GC. 1970. The effect of hibernation on the caecal flora of the thirteen-lined ground squirrel. J. Appl. Microbiol. 33:505–514 [DOI] [PubMed] [Google Scholar]
- 9.Sonoyama K, Fujiwara R, Takemura N, Ogasawara T, Watanbe J, Ito H, Morita T. 2009. Response of gut microbiota to fasting and hibernation in Syrian hamsters. Appl. Environ. Microbiol. 75:6451–6456. 10.1128/AEM.00692-09 [DOI] [PMC free article] [PubMed] [Google Scholar]
- 10.Carey HV, Walters WA, Knight R. 2013. Seasonal restructuring of the ground squirrel gut microbiota over the annual hibernation cycle. Am. J. Physiol. Regul. Integr. Comp. Physiol. 304:R33–R42. 10.1152/ajpregu.00387.2012 [DOI] [PMC free article] [PubMed] [Google Scholar]
- 11.Stevenson TJ. 2014. The cecal microbial community of the arctic ground squirrel: shifts in diversity, activity and numbers across hibernation. M.S. thesis University of Alaska Anchorage, Anchorage, AK [Google Scholar]
- 12.Dominguez-Bello MG, Costello EK, Contreras M, Magris M, Hidalgo G, Fierer N, Knight R. 2010. Delivery mode shapes the acquisition and structure of the initial microbiota across multiple body habitats in newborns. Proc. Natl. Acad. Sci. U. S. A. 107:11971–11975. 10.1073/pnas.1002601107 [DOI] [PMC free article] [PubMed] [Google Scholar]
- 13.Palmer C, Bik EM, DiGiulio DB, Relman DA, Brown PO. 2007. Development of the human infant microbiota. PLoS Biol. 5:e177. 10.1371/journal.pbio.0050177 [DOI] [PMC free article] [PubMed] [Google Scholar]
- 14.Koenig JE, Spor A, Scalfone N, Fricker AD, Stombaugh J, Knight R, Angenant LT, Ley RE. 2011. Succession of microbial consortia in the developing infant gut microbiome. Proc. Natl. Acad. Sci. U. S. A. 108:4578–4585. 10.1073/pnas.1000081107 [DOI] [PMC free article] [PubMed] [Google Scholar]
- 15.Schloss PD, Schubert AM, Zackular JP, Iverson KD, Young VB, Petrosino JF. 2012. Stabilization of the murine gut microbiome following weaning. Gut Microbes 3:383–393. 10.4161/gmic.21008 [DOI] [PMC free article] [PubMed] [Google Scholar]
- 16.Ley RE, Hamady M, Lozupone C, Turnbaugh PJ, Ramey RR, Bircher JS, Schlegel ML, Tucker TA, Schrenzel MD, Knight R, Gordon JI. 2008. Evolution of mammals and their gut microbiota. Science 320:1647–1651. 10.1126/science.1155725 [DOI] [PMC free article] [PubMed] [Google Scholar]
- 17.Durso LM, Harhay GP, Smith TPL, Bono JL, DeSantis TZ, Harhay DM, Andersen GL, Keen JE, Laegried WW, Clawson ML. 2010. Animal-to-animal variation in fecal microbial diversity among beef cattle. Appl. Environ. Microbiol. 76:4858–4862. 10.1128/AEM.00207-10 [DOI] [PMC free article] [PubMed] [Google Scholar]
- 18.Turnbaugh PJ, Hamady M, Yatsunenko T, Cantarel B, Duncan A, Ley RE, Sogin ML, Jones WJ, Roe BA, Affourtit JP, Egholm M, Henrissat B, Heath AC, Knight R, Gordon JI. 2009. A core gut microbiome in obese and lean twins. Nature 457:480–484. 10.1038/nature07540 [DOI] [PMC free article] [PubMed] [Google Scholar]
- 19.Benson AK, Kelly SA, Legge R, Ma F, Low SJ, Kim J, Zhang M, Oh PL, Nehrenberg D, Hua K, Kachman SD, Moriyama EN, Walter J, Peterson DA, Pomp D. 2010. Individuality in the gut microbiota composition is a complex polygenic trait shaped by multiple environmental and host genetic factors. Proc. Natl. Acad. Sci. U. S. A. 107:18933–18938. 10.1073/pnas.1007028107 [DOI] [PMC free article] [PubMed] [Google Scholar]
- 20.Ley RE, Bäckhed F, Turnbaugh PJ, Lozupone CA, Knight RD, Gordon JI. 2005. Obesity alters gut microbial ecology. Proc. Natl. Acad. Sci. U. S. A. 102:11070–11075. 10.1073/pnas.0504978102 [DOI] [PMC free article] [PubMed] [Google Scholar]
- 21.Wen L, Ley RE, Volchkov PY, Stranges PB, Avanesyan L, Stonebraker AC, Hu C, Wong FS, Szot GL, Bluestone JA, Gordon JI, Chervonsky AV. 2008. Innate immunity and intestinal microbiota in the development of type 1 diabetes. Nature 455:1109–1113. 10.1038/nature07336 [DOI] [PMC free article] [PubMed] [Google Scholar]
- 22.Turnbaugh PJ, Ridaura VK, Faith JJ, Ley RE, Knight R, Gordon JI. 2009. The effect of diet on the human gut microbiome: a metagenomic analysis in humanized gnotobiotic mice. Sci. Transl. Med. 1:6ra14. 10.1126/scitranslmed.3000322 [DOI] [PMC free article] [PubMed] [Google Scholar]
- 23.Alexander AD, Orcutt RP, Henry JC, Baker J, Jr, Bissahoyo AC, Threadgill DW. 2006. Quantitative PCR assays for mouse enteric flora reveal strain-dependent differences in composition that are influenced by the microenvironment. Mamm. Genome 17:1093–1104. 10.1007/s00335-006-0063-1 [DOI] [PubMed] [Google Scholar]
- 24.Ley RE, Turnbaugh PJ, Klein S, Gordon JI. 2006. Human gut microbes associated with obesity. Nature 444:1022–1023. 10.1038/4441022a [DOI] [PubMed] [Google Scholar]
- 25.Turnbaugh PJ, Ley RE, Mahowald MA, Magrini V, Mardis ER, Gordon JI. 2006. An obesity-associated gut microbiome with increased capacity for energy harvest. Nature 444:1027–1031. 10.1038/nature05414 [DOI] [PubMed] [Google Scholar]
- 26.Schwiertz A, Taras D, Schäfer K, Beijer S, Bos NA, Donus C, Hardt PD. 2010. Microbiota and SCFA in lean and obese healthy subjects. Obesity 18:190–195. 10.1038/oby.2009.167 [DOI] [PubMed] [Google Scholar]
- 27.Bäckhed F, Ding H, Wang T, Hooper LV, Koh GY, Nagy A, Semenkovich CF, Gordon JI. 2004. The gut microbiota as an environmental factor regulates fat storage. Proc. Natl. Acad. Sci. U. S. A. 101:15718–15723. 10.1073/pnas.0407076101 [DOI] [PMC free article] [PubMed] [Google Scholar]
- 28.Ward JM, Armitage KB. 1981. Cirannual rhythms of food consumption, body mass, and metabolism in yellow-bellied marmots. Comp. Biochem. Physiol. 69A:621–626 [Google Scholar]
- 29.Davis DE. 1976. Hibernation and circannual rhythms of food consumption in marmots and ground squirrels. Q. Rev. Biol. 51:477–514. 10.1086/409594 [DOI] [PubMed] [Google Scholar]
- 30.Frank CL. 1992. The influence of dietary fatty acids on hibernation by golden-mantled ground squirrels (Spermophillus lateralis). Physiol. Zool. 65:906–920 [Google Scholar]
- 31.Carey HV. 1990. Seasonal changes in mucosal structure and function in ground squirrel intestine. Am. J. Physiol. 259:R385–R392 [DOI] [PubMed] [Google Scholar]
- 32.Hume D, Beiglbock C, Ruf T, Bruns FRU, Arnold W. 2002. Seasonal changes in morphology and function of the gastrointestinal tract of free-living alpine marmots. J. Comp. Physiol. B 172:197–207. 10.1007/s00360-001-0240-1 [DOI] [PubMed] [Google Scholar]
- 33.Sheriff MJ, Fridinger RW, Tøien O, Barnes BM, Buck CL. 2013. Metabolic rate and pre-hibernation fattening in free-living arctic ground squirrels. Physiol. Biochem. Zool. 86:515–527. 10.1086/673092 [DOI] [PubMed] [Google Scholar]
- 34.Sheriff MJ, William CT, Kenagy GJ, Buck CL, Barnes BM. 2012. Thermoregulatory changes anticipate hibernation by 45 days: data from free-living arctic ground squirrels. J. Comp. Physiol. B 182:841–847. 10.1007/s00360-012-0661-z [DOI] [PubMed] [Google Scholar]
- 35.Ben-Amor K, Heilig H, Smidt H, Vaughan EE, Abee T, De Vos WM. 2005. Genetic diversity of viable, injured, and dead fecal bacteria assessed by fluorescence-activated cell sorting and 16S rRNA gene analysis. Appl. Environ. Microbiol. 71:4679–4789. 10.1128/AEM.71.8.4679-4689.2005 [DOI] [PMC free article] [PubMed] [Google Scholar]
- 36.Caporaso JG, Kuczynski J, Stombaugh J, Bittinger K, Bushman FD, Costello EK, Fierer N, Gonzalez Peña A, Goodrich JK, Gordon JI, Huttley GA, Kelley ST, Knights D, Koenig JE, Ley RE, Lozupone CA, McDonald D, Muegge BD, Pirrung M, Reeder J, Sevinsky JR, Turnbaugh PJ, Walters WA, Widemann J, Yatsunenko T, Zaneveld J, Knight R. 2010. QIIME allows analysis of high-throughput community sequencing data. Nat. Methods 7:335–336. 10.1038/nmeth.f.303 [DOI] [PMC free article] [PubMed] [Google Scholar]
- 37.Reeder J, Knight R. 2010. Rapidly denoising pyrosequencing amplicon reads by exploiting rank-abundance distributions. Nat. Methods 7:668–669. 10.1038/nmeth0910-668b [DOI] [PMC free article] [PubMed] [Google Scholar]
- 38.Edgar RC. 2010. Search and clustering orders of magnitude faster than BLAST. Bioinformatics 26:2460–2461. 10.1093/bioinformatics/btq461 [DOI] [PubMed] [Google Scholar]
- 39.DeSantis TZ, Hugenholtz P, Larsen N, Rojas M, Brodie EL, Keller K, Huber T, Dalevi D, Hu P, Andersen GL. 2006. Greengenes, a chimera-checked 16S rRNA gene database and workbench compatible with ARB. Appl. Environ. Microbiol. 72:5069–5072. 10.1128/AEM.03006-05 [DOI] [PMC free article] [PubMed] [Google Scholar]
- 40.Wang Q, Garrity GM, Tiedje GM, Cole JR. 2007. Naive Bayesian classifier for rapid assignment of rRNA sequences into the new bacterial taxonomy. Appl. Environ. Microbiol. 73:5261–5267. 10.1128/AEM.00062-07 [DOI] [PMC free article] [PubMed] [Google Scholar]
- 41.Caporaso JG, Bittinger K, Bushman FD, DeSantis TZ, Andersen GL, Knight R. 2010. PyNAST: a flexible tool for aligning sequences to a template alignment. Bioinformatics 26:266–267. 10.1093/bioinformatics/btp636 [DOI] [PMC free article] [PubMed] [Google Scholar]
- 42.Price MN, Dehal PS, Arkin AP. 2010. FastTree 2—approximately maximum-likelihood trees for large alignments. PLoS One 5:e9490. 10.1371/journal.pone.0009490 [DOI] [PMC free article] [PubMed] [Google Scholar]
- 43.Lozupone C, Knight R. 2005. UniFrac: a new phylogenetic method for comparing microbial communities. Appl. Environ. Microbiol. 71:8228–8235. 10.1128/AEM.71.12.8228-8235.2005 [DOI] [PMC free article] [PubMed] [Google Scholar]
- 44.Clarke KR, Gorley RN. 2006. Primer 6 user manual. Plymouth Marine Laboratory, Plymouth, United Kingdom [Google Scholar]
- 45.Louis P, Flint HJ. 2009. Diversity, metabolism and microbial ecology of butyrate-producing bacteria from the human large intestine. FEMS Microbiol. Lett. 294:1–8. 10.1111/j.1574-6968.2009.01514.x [DOI] [PubMed] [Google Scholar]
- 46.Lacey E, Wieczorek JR. 2001. Territoriality and male reproductive success in arctic ground squirrels. Behav. Ecol. 12:626–632. 10.1093/beheco/12.5.626 [DOI] [Google Scholar]
- 47.Wu GD, Chen J, Hoffmann C, Bittinger K, Chen Y, Keilbaugh SA, Bewstra M, Knights D, Walters WA, Knight R, Sinha R, Gilroy E, Gupta K, Baldassano R, Nessel L, Li H, Bushman FD, Lewis JD. 2011. Linking long-term dietary patterns with gut microbial enterotypes. Science 334:105–108. 10.1126/science.1208344 [DOI] [PMC free article] [PubMed] [Google Scholar]
- 48.Suzuki K, Meek B, Doi Y, Muramatsu M, Chiba T, Honjo T, Fagarasan S. 2004. Aberrant expansion of segmented filamentous bacteria in IgA-deficient gut. Proc. Natl. Acad. Sci. U. S. A. 101:1981-1986. 10.1073/pnas.0307317101 [DOI] [PMC free article] [PubMed] [Google Scholar]
- 49.Khachatryan ZA, Ktsoyan ZA, Manukyan GP, Kelly D, Ghazaryan KA, Aminov RI. 2008. Predominant role of host genetics in controlling the composition of gut microbiota. PLoS One 3:e3064. 10.1371/journal.pone.0003064 [DOI] [PMC free article] [PubMed] [Google Scholar]
- 50.Dimitriu PA, Boyce G, Samarakoon A, Hartmann M, Johnson P, Mohn WW. 2013. Temporal stability of the mouse gut microbiota in relation to innate and adaptive immunity. Enivron. Microbiol. Rep. 5:200–210. 10.1111/j.1758-2229.2012.00393.x [DOI] [PubMed] [Google Scholar]
Associated Data
This section collects any data citations, data availability statements, or supplementary materials included in this article.