

Abstract
Kilohertz Frequency Alternating Current (KHFAC) waveforms are being evaluated in a variety of physiological settings because of their potential to modulate neural activity uniquely when compared to frequencies in the sub-kilohertz range. However, the use of waveforms in this frequency range presents some unique challenges regarding the generator output. In this study we explored the possibility of undesirable contamination of the KHFAC waveforms by direct current (DC). We evaluated current- and voltage-controlled KHFAC waveform generators in configurations that included a capacitive coupling between generator and electrode, a resistive coupling and combinations of capacitive with inductive coupling. Our results demonstrate that both voltage- and current-controlled signal generators can unintentionally add DC-contamination to a KHFAC signal, and that capacitive coupling is not always sufficient to eliminate this contamination. We furthermore demonstrated that high value inductors, placed in parallel with the electrode, can be effective in eliminating DC-contamination irrespective of the type of stimulator, reducing the DC contamination to less than 1 μA. This study highlights the importance of carefully designing the electronic setup used in KHFAC studies and suggests specific testing that should be performed and reported in all studies that assess the neural response to KHFAC waveforms.
Keywords: Kilohertz High Frequency Alternating Current, Nerve Block, KHFAC, HFAC, Direct Current, DC in KHFAC
Introduction
The use of charge-balancing in electrical stimulation has been well-established as a means of significantly increasing the charge per phase that can safely be delivered to living tissue (Agnew 1989; Shannon 1992; Shepherd 1999). Typical off-the-shelf neural stimulators generate charge-balanced waveforms and often rely on capacitors in series with the electrode to filter out DC components (Huang 1999). Any current passing to the capacitors passes as a displacement current causing the build-up of an electric field inside the capacitor. Ideally, in order for signals to be charge balanced, every electric pulse in one direction (e.g. cathodic) through the load (e.g. electrode) is followed by a pulse of equal amplitude and opposite charge (e.g. anodic). The second pulse is often referred to as the “recharge pulse” and is only used to establish safety of the stimulation. However, capacitors are not perfect charge storage elements, and this can produce a slight imbalance in charge between the two phases of the stimulus. The resulting differential charge causes small residual electric fields after each pulse pair inside the dielectric of the DC-blocking capacitors (Maxwell 1881; Huang 1999). In conventional neural stimulation, these fields remain practically unnoticed as the residual charge can dissipate through the capacitor’s internal impedance or is shorted out by the signal generator during the interval following the current pulses. This is because stimulation waveforms typically have a relatively long “off” period between each stimulus pulse. For example, a motor neuroprosthesis using a 200 μs balanced biphasic pulse delivered at 20 Hz (typical parameters) will have a 400 μs “on” period (two balanced 200 μs phases) followed by 49.8 ms of “off” time, for an on:off ration of 0.008 (Chae 2000). The “off” period allows time for any small charge imbalance between the two stimulus phases to dissipate before the next stimulus pulse is delivered, preventing any significant accumulation of charge. In general, the use of a capacitively-coupled stimulus output stage reduces the charge imbalance to negligible levels (Huang 1999). However, recent discoveries in the field of neuromodulation have resulted in the use of progressively higher frequencies of stimulation, such as deep brain stimulation (~130 to 300 Hz) (Jensen 2009), spinal cord stimulation (600 Hz – 10k Hz) (Tiede), and peripheral nerve block (1 kHz-50 kHz)(Joseph; Bowman 1986; Boger 2008; Kilgore 2013). Of particular interest is the kilohertz frequency range, where the biphasic pulses are often delivered continuously, i.e. there is no “off” time during delivery of the stimulus. In this manuscript, we evaluate whether a small charge imbalance in the output of these continuous waveforms might accumulate on the electrode (or charge-balancing capacitors) and possibly result in unintended electrical, electrochemical, and physiological effects.
Most reports in the literature regarding the use of continuous waveforms in the kilohertz range do not provide a detailed description of the hardware used to produce the waveform (Joseph; Tiede; Tai 2004; Dowden 2010; Waataja 2011). In particular, there have been no reports of direct measures of the magnitude of the DC offset during delivery of these waveforms, except when used in cochlear stimulator applications (Huang 1999). A significant DC offset in the signal could produce unexpected or unwanted effects in neural tissue, including nerve conduction block (Bhadra 2004), and neural damage (Huang 1999), both of which can occur below 10 μA. Therefore, it is important to make direct and accurate measurements of the magnitude of the DC offset during continuous waveforms at kilohertz frequencies. In this manuscript we present methods for measuring the DC offset and demonstrate that any offset can be significantly reduced in an experimental setting with the use of high value inductors.
Methods
Calibration and verification of the output of electrical stimulation generators is generally accomplished by substituting a fixed value resistor (commonly 1 or 10 kΩ) for the electrode and measuring the voltage across the resistor. However, in the case of continuous waveforms, we considered that it was important to evaluate the effect of charge imbalance using real electrodes in saline. Our evaluation proceeded in two stages, using two different experimental configurations, as detailed below. The first stage involved measuring the voltage directly across the electrode during delivery of 1 kHz continuous waveforms. This stage utilized a relatively simple measurement technique, and could be used for screening a variety of waveform generators, including those with voltage-controlled and current-controlled outputs. We also used this measurement technique to evaluate one current-controlled generator at 10 kHz and 40 kHz (both continuous waveforms) to determine if there were significant differences in the electrode voltage and voltage offset as a function of frequency. The second stage involved measuring the electrode potential of each contact against a standard reference electrode (Ag/AgCl) to evaluate whether the voltage offsets observed in the first stage were sufficient to reach or exceed the water electrolysis window for the electrode under test. Current flow through the electrodes during, and immediately after, delivery of the continuous high frequency waveforms was also measured in this second stage. The electrode contact potential and current flow through the electrode were measured using one representative current-controlled and one voltage-controlled waveform generator, first testing the generator directly connected to the electrode and then testing the generator with additional capacitive coupling to the electrode.
In both stages of our assessment, high value inductors, placed in parallel with the electrodes and/or the stimulator, were used as a final comparison to the results obtained with standard high frequency generator configurations. High value inductors serve to shunt direct current (DC) in parallel to the electrode, thereby preventing the accumulation of any significant charge-imbalance across the electrodes, while simultaneously providing a large impedance (>200 kΩ) to alternating currents in the kilohertz range, essentially forcing the kilohertz-waveform through the electrode. To our knowledge, inductors have not been commonly utilized in this manner with high frequency waveform generators when used for physiological purposes. We evaluated whether our circuit configuration with inductors included could be used to accurately assess essentially “DC-free” high frequency waveforms for future physiological experimentation.
(1.a) Stage 1 - Determining unintentional DC voltage offset: Experimental setup
Two current- and two voltage-controlled waveform generator configurations, listed in Table 1, were tested using the experimental setup shown in Figure 1. A 1 kHz sinusoidal signal, generated by the stimulator being tested, was applied across a bipolar spiral cuff electrode (Naples 1988) suspended in 0.9% NaCl saline. The platinum contacts each had a 1mm2 surface area. The impedance of the electrode (ZE) was 1.28kΩ at 1 kHz for sinusoidal signals, measured with an impedance meter (Protek Z580; Protek Test, Englewood, NJ). Two inline-capacitors C1 and C2 of 1μF each were placed between the generator and the electrode. Two inductors (with switches) of 8.2 H at 1kHz were placed on both the stimulator and the electrode side of the capacitors. The high value inductors were achieved using the primary side of signal transformers with an open secondary side. These offered a frequency dependent impedance of Z1kHz=241kΩ for KHFAC signals and a low DC-impedance (ZDC=418Ω), effectively acting as a shunt for DC-currents. Four capacitor/inductor combinations were evaluated for their ability to minimize offset voltages across the electrodes. Data were sampled at 20 kHz. On the electrode side, a Solartron SI1280B (input impedance Zin>10 GΩ) was used to measure the voltage between the two electrodes in saline, and on the stimulator side one channel of a USB DAQ-6258 (National Instruments, Austin, TX), captured the Solartron output on a second channel with both channels set as floating vs. earth ground. These measurements were further independently confirmed using two oscilloscopes (Agilent TDS2004c, Agilent Technologies, Santa Clara, CA) with 100 MΩ probes, both on battery-powered floating power supplies and used to monitor the potential on the stimulator output (scope 1 in Fig. 1) before the two inline-capacitors C1 and C2 as well as between the capacitors and across the electrodes in saline (scope 2 in Fig. 1). Each element of the signal generation and the measuring setup was checked for impedance loops to other elements and to earth ground with DC, 1 kHz and 10kHz signals (Fluke 87V, Protek Z580) to ensure the absence of unwanted DC or AC crosstalk.
Table 1.
Voltage- and Current-controlled Waveform Generator Configurations Tested.
| Generator | Digitimer DS-5 | Keithley 6221 | Wavetek 395 | Wavetek 395 |
|---|---|---|---|---|
| Manufacturer | Digitimer Ltd. Hertfordshire, England |
Keithley Instruments Cleveland, OH |
Aeroflex Inc. Plainview, NY | |
| Current contr. settings | 1 kHz, 2 mApp | 1 kHz, 2 mApp | - | |
| Voltage contr. settings | - | - | 1kHz, 2Vpp | |
| Offset | 0 V | 0 V | 4 V | 0 V |
Figure 1.

Electronic setup for Stage 1, used to measure DC-offset voltages caused by KHFAC waveforms. Switches S1 and S2 allowed to selectively add DC-shunting inductors L1 and L2 to the filter circuit. Offset was first determined with electrically floating Agilent TDS2004c oscilloscopes 1 and 2, then acquired using a Solartron SI1280B (electrode side) and NI DAQ USB-6258 substituting the oscilloscopes.
(1.b) Stage 1 - Determining unintentional DC voltage offset:Signal definition and analysis
The initial test waveform for stage 1 was a 1 kHz sinusoidal signal at 2mApeak-peak (pp) for current-and 2Vpp for voltage-controlled stimulators. The current-controlled stimulators were both operated without any deliberate DC-offset. The voltage-controlled stimulator was tested in two configurations, one without an intentional voltage offset (0 V dc condition) and secondly with an intentional 4Vdc offset to allow demonstration of the ability of the inductors to shunt even intentional offsets. The calibration of each signal generator was measured before use following the manufacturer’s instructions and found to be within the specified limit. This procedure first involved measuring the average voltage across a test resistor (commonly 10 kΩ), while the output was set to “on” with an amplitude of zero mA/volts (Keithley, Wavetek) or a shorted input (Digitimer). Secondly, the procedure was repeated, while the device was providing a 1 kHz waveform with an amplitude of one mA/volt. The measured offset voltages were found to be of similar magnitude, given the background noise, and always below the limit set by the device’s specifications. The offset current limits according to the manufacturers for the current-controlled waveform generators were 6 μA (at 2 mApp AC) for the Keithley 6221 and 5 μA for the Digitimer DS-5. The offset voltage limit specified by the manufacturer for the voltage-controlled waveform generator for signals of 2 Vpp AC was 20 mV.
Each trial consisted of at least ten seconds of no waveform output to ensure a stable baseline measurement, 30 seconds of waveform output, followed by 60 seconds with the output off to allow any accumulated DC-offset on the stimulator and on the electrode side to dissipate before the end of the trial. To ensure that all capacitive charge storage in the circuit was completely depleted before initiating each new trial, electrodes and capacitors were shorted between trials. Twelve trials were recorded for each stimulator configuration: a) with capacitors only (both inductors disconnected), representing the typical situation that KHFAC waveforms are applied in literature; b) with only the inductor on the stimulator side connected; c) with only the inductor on the electrode side connected; and d) with both inductors connected. Data were analyzed using custom Matlab routines. The baseline voltage (VBase) was defined as the average voltage of the last second before KHFAC waveforms were initiated. The maximum offset voltage was defined as the maximum difference from VBase during the time of KHFAC application. The absolute value of the average change in potential, rounded to one millivolt, is reported here. A repeated measures ANOVA (F-value (DoF,n), p value) was done on the voltages measured across electrodes in saline to test the main and interaction effects of stimulator configuration and the presence of inductors in addition to capacitors in the filter circuit. Post-hoc testing was done using the Tukey-Kramer HSD test. An alpha value of 0.05 for used for all statistical tests.
(1.c) Stage 1 - Determining the unintentional DC voltage offset as a function of KHFAC frequency
To assess if the observed DC-offset voltages across the electrode were a function of the applied KHFAC frequency, we repeated the measurement with sinusoidal signals at 1, 10 and 40kHz, acquiring eight measurements for each frequency in randomized order. The effect of frequency was measured for one current-controlled waveform generator (Keithley 6221). The 10 kHz to 40 kHz range is often used for KHFAC nerve conduction block (Kilgore 2013). We used the capacitors-only configuration of the filter-circuit (Fig. 1 and Fig. 2) as we would expect the typical experimental setup investigating effects of KHFAC to include capacitors to block unwanted DC (Bowman 1986; Bhadra 2005; Bhadra 2005; Williamson 2005; Boger 2008). A Pt electrode was used for this experiment with an impedance of 1.57 kΩ @ 1kHz, 1.48 kΩ @ 10 kHz and 1.45 kΩ @ 40 kHz. Data were pre-processed as described above. A repeated measures ANOVA (F-value (DoF,n), p value) was done to test the effect of frequency on the absolute maximum voltage offset difference. Post-hoc testing was done using the Tukey-Kramer HSD test. Three specific measures were compared: 1) the maximum difference between the average voltage during KHFAC and the average baseline voltage, 2) the average voltage offset after 30 seconds of KHFAC application (right before stopping KHFAC), and 3) the voltage offset 30 seconds after having stopped KHFAC. Values measured for these three locations were averaged for a duration of 0.5 seconds to compensate for noise.
Figure 2.

Electronic setup used to measure unintended DC-current and resulting voltage offset vs. a Ag/AgCl reference electrode from one of the electrodes in saline. The filter circuit is the same as in figure 1.
(2.) Stage 2 - Measuring the amplitude of DC through the electrodes and the potential for irreversible reactions
The measurements made in Stage 1 provided an initial screening to identify voltage offsets across the electrode. However, in order to determine if these voltages are indicative of contact potentials that might result in irreversible chemical reactions (Cogan 2008) and result in actual current flow through the electrode, a second experimental stage was devised, as shown in Figure 2. The potential of each Pt-electrode was measured against a Ag/AgCl reference electrode using a Solartron SI1280B (input impedance >10GΩ). This potential was measured at each electrode contact independently. Following each measurement, any remaining charge between the electrodes was allowed to dissipate using the 8H inductors. Charge balance was verified by ensuring that the potential of each electrode had returned to the initial potential vs. Ag/AgCl that was acquired at the beginning of the previous trial. In addition to the potential measurements at each electrode contact, the DC current through the electrode was measured as a voltage across a resistor Rm=1kΩin series between one electrode and the filter-circuit (Fig. 1 and Fig. 2).
One current-controlled waveform generator (Keithley 6221) and one voltage-controlled waveform generator (Wavetek 395) were used to provide a 10 kHz sinusoidal waveform at 2 mApp and 2Vpp, respectively. With the current-controlled device it was possible to set the voltage compliance at different levels, and we tested two levels of voltage compliance (10 V and 100 V peak) to determine if this affected the electrode potential and current measurement. The voltage-controlled generator had a voltage compliance of 10V. The filter-circuit was used in three variations: (a) no filter circuit (device output directly connected to the electrodes), (b) two capacitors in series with the generator output, and (c) two capacitors with two inductors. Repeated application of KHFAC was tested by delivering the KHFAC waveform for 30 seconds, waiting 30 seconds (without shorting the electrodes) and then repeating another 30 second delivery of KHFAC. The saline was not nitrogen purged; the access resistance of the Pt electrode vs. reference was 544 Ω. To assess variability between trials, the coefficient of variation was calculated as the ratio of the standard deviation to the mean of the voltage measured at each electrode’s with reference to the Ag/AgCl reference electrode. The coefficient of variation was also calculated for the current passing through the two Pt electrodes.
Results
The results demonstrated that significant voltage offsets can be recorded across the stimulator’s output (measured before the capacitors, location of scope 1 in Fig. 1) and the electrodes in saline (location of scope 2) when using continuous sinusoidal waveforms, even when the electrodes are capacitively coupled. Figure 3 shows an example of the voltage drift as a function of time using a current-controlled generator (Keithley 6221) with two in-line capacitors, measured on the stimulator side of the in-line capacitors (scope 1, Fig. 1). A “charge-balanced” sinusoid at 1 kHz was delivered to a bipolar Pt electrode in saline. The average voltage drifts away from the zero-potential over the course of less than two seconds, indicating an increasing offset voltage. This offset voltage continued to drift until the sum of KHFAC signal amplitude and offset voltage reached the voltage compliance of the stimulator (10 V in this example, Fig. 3). In parallel, a voltage offset across the electrode was measured that was smaller in amplitude but of the same polarity as the voltage measured on the stimulator side of the capacitors, as long as the KHFAC waveform was delivered. This voltage offset on the electrode side could result in a net DC through the electrode during the application of KHFAC waveforms. Stage 1 and stage 2 of the experiment analyzed these findings more into detail.
Figure 3.
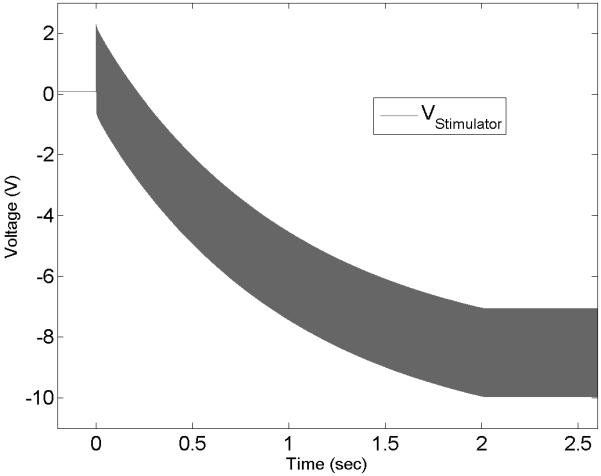
Voltage measurement at the output of a current-controlled KHFAC waveform generator connected through two inline-capacitors to a bipolar electrode in saline. Note the increasing DC-offset until the stimulator’s voltage compliance (10 V) is reached.
(1) Stage 1 Experimental Results - Inline-capacitors alone may not prevent an unintentional DC voltage build-up between the electrodes for KHFAC
The average voltages measured before and after the filter-circuit (Fig. 1) differed significantly when inductors were used in addition to the inline-capacitors, as shown inFigure 4). The average voltages measured for both of the current-controlled devices increased immediately after KHFAC signals were initiated when the capacitors only condition was used (Fig. 4, 1st row, left). The average voltage offset measured at the stimulator output VSout for the Keithley(K.) was 8,259±26mV and for the DS5 was 6,584±499mV, while the average offset voltages across the electrode were VEin(K.)=619±36mV and VEin(DS5)=912±58mV (Fig. 5). After adding one inductor to the stimulator side of the setup (fig. 4, 1st row, 2nd from left), VSout(K.) was 4±0mV and VEin(K.) at 34±7mV. The results for the DS5 (not shown in fig. 4) were similar: VSout(DS5) was 3±1mV and VEin(DS5) was 1±1mV. Inserting one the inductor on the electrode side of the setup affected primarily the voltages across the electrode (Fig. 4, 1st row, 2nd from right) with VSout(K.) at 8,367±19mV and VEin(K.) at 4±0mV. The results for the DS5 were similar with VSout(DS5) at 6,559±997mV and VEin(DS5) at 3±0mV. Voltage offsets were further reduced with the two inductor configuration. In this latter case, VSout(K.) averaged 4±0mV and VEin(K.) averaged 0±0mV (Fig. 4, 1st row, right). Comparable results were obtained for the two inductor configuration using the DS5 with VSout(DS5) =4±2mV and VEin(DS5) =0±0mV.
Figure 4.

Raw data examples for three different stimulator configurations (top to bottom) tested with capacitors only (left), additionally one DC-shunting inductor on the stimulator side (2nd from left), capacitors and one DC-shunting inductor on the electrode side (2nd from right), and DC-blocking capacitors with two DC-shunting inductor (right column). Light grey indicates voltages measured on the stimulator side of the DC-blocking capacitors, while dark grey shows voltages on the electrode side. Average DC-voltages are indicated with a white line in the middle of the waveform. Time scale in the lower left.
Figure 5.

Average offset voltages (mean±1sd) measured for each signal generator setup (I-contr.1 = Digitimer DS5, I-contr.2 = Keithley 6221, Wavetek 395 +4V offset, and 0V offset). Each waveform generator was tested with capacitors only (left bar), capacitors plus one inductor on the stimulator side (2nd bar from the left), capacitors plus one inductor on the electrode side (2nd from the right), and capacitors with two inductors (right bar).
The average voltages measured for the voltage-controlled configuration with no intentional offset (“0V” condition) increased only minimally after KHFAC waveforms were initiated when capacitors only were used to isolate electrode and stimulator (Fig. 4, 3rd row, left). The average stimulator output voltage VSout proximal to the capacitors was 7±31mV, while the average electrode input voltage at the electrodes VEin was at 3±19mV (Fig. 5). After adding the inductor on the stimulator side of the setup, VSout was 29±0mV with VEin at 17±0mV. The added inductor on the electrode side changed VSout to 33±2mV and kept VEin=0±0mV. Using the two inductor configuration, VSout averaged 28±1mV and VEin 0±0mV.
The average voltages measured for the voltage-controlled configuration with intentional 4V offset rose similarly after KHFAC waveforms were initiated when capacitors only were used to separate electrode and stimulator (Fig. 4, 2nd row, left). The average stimulator output voltage VSout(W.395_4V) proximal to the capacitors was 4,054±4mV, while the average electrode input voltage at the electrodes VEin(W.395_4V) was 774±24mV (fig. 5). After adding an inductor on the stimulator side of the setup, VSout fell to 3.826±1mV while VEin rose to 676±44mV. The added inductor on the electrode side of the setup again affected primarily the voltages on that side with VSout=4,107±0mV and VEin=2±0mV. When two inductors were part of the configuration, VSout averaged 3.875±1mV and VEin=2±0mV, demonstrating that even with a significant intentional offset, the inductors were able to nearly eliminate the offset.
Both the main effect of stimulator (F(3,176) = 2273.5, p<0.0001) and the presence or absence of inductors (F(3,176) = 7428.6, p<0.0001) and the interaction effect were significant (F(9,176) = 1565.6, p<0.0001). Post-hoc testing revealed that there was a significant difference in the offset voltage between stimulators. Furthermore, the offset voltage was the least when either two inductors were used or one inductor was placed on the electrode side; the measured offset voltage when one inductor was placed on the stimulator side was still significantly lower than when only capacitors were used in the filter circuit but it was greater than for the other two conditions. The interaction effects between stimulator type and the presence or absence of inductors is likely due to the fact that different types of stimulators (i.e. voltage and current) have different tendencies to generate unintended DC-currents, which are then proportionally shunted by the inductors placed in different locations of the filter circuit. In general, the least offset voltages were measured when two inductors were included in the filter circuit.
We further observed that immediately after the KHFAC waveforms were turned off following 30 seconds of continuous application, there was a slowly decaying offset voltage that took between a few seconds to tens of seconds until it reached the pre-KHFAC equilibrium voltage. This effect was especially observable in current-controlled configurations using capacitors only (top left tile in Fig. 4 and in Fig. 6). When we tested if disconnecting the KHFAC generator at the end of the 30 second delivery would make this effect disappear, the same slow decay of offset voltages was observed upon disconnection of the generator, indicating that the effect was not caused by a discharge of parasitic capacitance inside the generator.
Figure 6.

Average offset voltages (mean±1sd) at three different time points during and following current-controlled KHFAC application in a setup using only inline-capacitors to prevent DC, voltages were measured across electrodes in saline “behind” the inline caps (scope 2 in Fig. 1). The emergence of DC offset voltages was independent of the choice of frequency (1, 10 and 40 kHz). Arrow indicates voltage spike reversing the offset polarity at the end of KHFAC delivery.
The comparison of KHFAC waveforms for 1, 10 and 40 kHz showed similar voltage offsets for all tested frequencies (Fig. 6, upper section). In each case, the average voltage difference between electrodes rose until the stimulator indicated that the voltage compliance was reached (Fig. 6, left bars correspond with the maximum difference from baseline in the example voltage trace in the lower section). Once the voltage compliance had been reached, the voltage difference slowly declined until the end of KHFAC application to values of about half (middle bars in top section, corresponding with voltage offset measured at the end of KHFAC delivery) of the initial maximum voltage measured. Right after KHFAC delivery ended, the offset voltage polarity reversed with a voltage spike (arrow in Fig. 6) and began to decline from the opposite direction towards the initially measured baseline (Fig. 6, example in lower section and “30 sec post”).
All the absolute maximum voltage offset differences (see Fig. 6) were found be above 200 mV, irrespective of frequency. Frequency was found to significantly affect the measured absolute offset voltage (F(2,21) = 87.7, p < 0.0001). Post hoc testing revealed that the absolute offset voltage measured at 1 kHz was significantly lower than those at 10 and 40 kHz, with p < 0.0001 in both cases. However, the difference in offset voltage was very small, 0.097±0.012 V between 1 and 40 kHz and 0.097±0.018 V between 1 and 10 kHz for the absolute maximum offset voltages. Similar results were seen in the ANOVA and Tukey-Kramer test for the voltages at the end of KHFAC delivery (see Fig. 6) and 30 seconds post KHFAC end. The current corresponding to the voltage spike (arrow), measured in separate trials under the same conditions, was passing though the electrode as what appeared to be a capacitive discharge, with typical amplitudes in the milli-Ampere range and durations of 200 to 400 μs.
(2) Stage 2 Experimental Results - KHFAC offset voltages indicate current flow in micro-ampere range; offset voltages remain after KHFAC stops
The case where the output of the generator was connected directly to the electrodes (no capacitors and no inductors), a continuous DC of 4 to 5 μA was measured for the entire duration that KHFAC waveforms were applied (Fig. 7 C). The voltage potential for each contact compared to the Ag/AgCl reference electrode continued to drift further from the starting potential as long as the KHFAC was delivered. Further, 30 seconds of off time was not sufficient for the potentials to return to baseline levels and therefore the second session of 30 second KHFAC delivery resulting in even higher potential peaks relative to baseline. In this particular condition, the electrode potential was well outside of the water electrolysis window for Pt, and, during the second delivery of KHFAC was outside the water window for nearly the entire 30 second period of delivery.
Figure 7.

Electrode potentials measured against the Ag/AgCl reference in saline with current (A, B, C and D) and voltage (D) controlled stimulators. Shown is the low-pass filtered mean of the sinusoidal 10 kHz waveform (compare to lower tier of fig. 6). In each figure, the upper traces show the measured voltage of one of the electrodes for two times 30 sec. application of KHFAC followed by a 30 sec pause. The lower trace in each figure shows the direct current measured through a resistor Rm in series with the electrodes. Inline-capacitors without inductors as filter-circuit (figure 2) are used for acquisition of (A) and (B), difference there being the voltage compliance set at the current-controlled stimulator, 100 V for (A) and 10 V for (B). No inline-capacitors and no inductors were used to acquire (C) with a current-controlled setup and 10 V compliance. The combination of two inductors for a current-controlled setup is combined with a voltage-controlled setup only using capacitors in (D). Stimulators used were the Keithley 6221 for current and the Wavetek 395 for voltage-controlled experimentation. The saline was not nitrogen purged. Please note different voltage scales in A, B, C, and D chosen for visualization and how repeated application of KHFAC in A, B, and C increased the offset post application vs. Ag/AgCl. IR correction = 2.5mV = 4.5μA*544Ω.
For the capacitors only case, we observed that the majority of the unintentional DC was injected during the first few seconds after the initiation of the KHFAC waveform (Fig. 7 A and B, lower current traces), until the stimulator’s voltage compliance was reached (based on the compliance indicator on the device). We measured DC amplitudes in the range of 4 to 5μA for approximately two seconds when the voltage compliance was set to 10 V (Fig. 7 B). This same current level was delivered for up to ~12 seconds when the voltage compliance was set to 100V (Fig. 7 A). The relationship between higher voltage compliance and longer DC injection was direct but non-linear, whereas the DC amplitude remained at the same value with different compliance settings. Once the voltage compliance of the stimulator had been reached, current flow through the electrode dropped to <1μA for the duration of the KHFAC delivery.
The electrode potential against the Ag/AgCl reference climbed during the first few seconds of KHFAC application and reached its peak when the stimulator’s voltage compliance was reached (Fig. 7, upper voltage traces). The time between KHFAC start and reaching the maximum voltage against Ag/AgCl in Figure 7 corresponded with the time required for the initial rapid rise in voltage between electrodes in Figure 6. The open circuit potential (OCP) of the Pt electrode changed after the first application of 30 seconds of the KHFAC waveform. Repeated application of KHFAC further increased the OCP in a non-linear fashion (voltage traces in Fig. 7). In contrast to the cases where no capacitors and no inductors were used (Fig. 7 C) the offset voltage measured post KHFAC delivery was found to be of opposite polarity to the voltage measured during KHFAC application. A voltage spike, in polarity being the same direction as post-KHFAC offset, accompanied the end of KHFAC delivery, along with a small discharge current through the resistor in series with the electrodes (current trace in Fig. 7 A). The injected charge during the first few seconds of KHFAC delivery were orders of magnitude larger than the charge measured at the end of KHFAC delivery in the opposite polarity.
For the case with two capacitors with two inductors, we observed that the injected DC amplitude remained <1μA throughout the trials, even with repeated application (Fig. 7, D). The voltage traces for current-controlled KHFAC delivery did not increase when KHFAC delivery started or stopped; the trace for voltage-controlled KHFAC had an increase of less than 0.1 V. No large voltage or current spikes were observed, the only change being a constant change in OCP over time, and this happened regardless of whether the KHFAC was delivered or not. The stimulator did not reach the voltage compliance.
The coefficient of variation between trials (n=10 for each condition) was 3.5 % or less for all measurement variables across all generator and shunt conditions.
Discussion
Our results demonstrate the importance of careful and accurate measurement of the output of KHFAC generators to be used in physiological applications. In particular, we demonstrated that commonly used generators produce a DC offset in the output that could have measurable effects on the physiology and on the electrode itself. Given the paucity of detailed descriptions of the measurement of the output of KHFAC waveform generators in the literature, the primary contribution of this manuscript is to present the experimental evidence that these measurements are critical to any interpretation of the neural response to KHFAC waveforms. As we saw unintentional DC contamination with both, current- and voltage-controlled systems, we suggest measuring the output of the experimental setup to ensure the absence of DC components. Although we only investigated KHFAC amplitudes of 1 mA and 1 V respectively, we did not investigate how higher or lower amplitudes of the KHFAC waveform impact the presence of unintended DC. The chosen amplitudes (with electrode impedances of ~1kΩ for the tested frequencies) allow the qualitative assessment of developing DC contamination in both, current- and voltage-controlled systems. We suggest that researchers investigate their specific setup at the intended KHFAC amplitudes and frequencies used for nerve block (Kilgore 2013). At a minimum, measurements such as those described in Stage 1 should be reported, and preferably direct measures of electrode potential and current flow, such as those described in Stage 2, should be performed and reported whenever KHFAC waveforms are used.
The two current-controlled waveform generators produced KHFAC signals with a DC-contamination of <5μA, which was within their stated specification. However, this current was sufficient to produce voltage potentials at the electrode contacts that, when measured against an Ag/AgCl reference electrode, indicated levels that were outside the water electrolysis window and thus could potentially result in irreversible chemical reactions at one or both electrode contacts. Therefore we do not advise applying KHFAC waveforms without, at a minimum, capacitively de-coupling the electrodes from the waveform generator.
The addition of “charge-balancing” capacitors on the stimulator output limited the duration over which the electrode remained at these elevated potentials (Fig. 7 A and B). We observed that the direct current was delivered with a preferential polarity and resulted in changing open-circuit potentials, which escalated with repeated delivery of the KHFAC. This probably indicates the occurrence of faradic reactions during or at the end of KHFAC delivery (Cogan 2008).
The amount of the initial DC delivery was influenced by the stimulator’s voltage compliance and whether KHFAC waveforms were applied repeatedly. Generally speaking, the higher the voltage compliance, the longer direct current was measured going through the electrodes. The increase in voltage potential between Pt electrodes and Ag/AgCl reference that results from repeated KHFAC application could not be due to the reversible charging of the Pt-electrolyte interface, but instead indicates the repeated occurrence of irreversible chemical reactions.
The current amplitude of the discharge spike measured when KHFAC application ended was generally in the range of 1 to 5 mA for a duration of ~200 μs. The size of the discharge spike was directly related to the duration over which the DC offset had been injected, and indirectly related to the time between reaching the stimulator’s voltage compliance and the end of KHFAC delivery. The off-spike itself may cause irreversible chemical reactions and is worthy of further investigation.
With the application of two inductors, one on each side of the DC-blocking capacitors, the measured DC-offset at the electrode remained well below 2 mV, independent of the choice between voltage- or current-controlled generators and even with an additional +4V offset using the voltage-controlled generator. The two inductors effectively provided a shunt for DC in parallel with the electrode as well as in parallel with the stimulator, while offering a large enough HF-impedance to minimize the impact on the amplitude of the KHFAC waveform. The application of one inductor on either side of the DC-blocking capacitors had an intermediate effect between using two or no inductors, usually lowering the measured offset voltage on the side to which it was applied. The specific DC-contamination of the any specific signal generator can help to decide if one inductor in addition to capacitors is sufficient or if two inductors and two capacitors should be utilized.
The voltage-controlled KHFAC waveforms showed significantly smaller DC-contamination as long as the generator was properly calibrated so that the DC offset was set to 0 V. We tested the configuration with an intentional 4 V offset to demonstrate that the increasing DC-voltage offset observed over time across the electrode is caused by a DC-offset on the stimulator side. Adding one inductor on the electrode side can, in this case, help to mitigate the accumulation of DC-offset, as confirmed by the results of the ANOVA for these data (figure 5). This underscores the importance of careful testing of this equipment prior to use. Specifically, it should not be assumed that off-the-shelf voltage-controlled generators have a 0 V offset. Therefore, when these devices are used for KHFAC block, the calibration procedure and DC offset through a resistive load should also be reported in the experimental methods. We further advise the use of inline-capacitors to block unintentional DC. While inductors may not be required with voltage-controlled KHFAC generators, including inductors for testing purposes may offer a secondary level of safety by providing an additional passive DC shunt.
Inline-capacitors were unable to prevent rising DC-voltages between electrodes if an offset-voltage was present at the generator output. This effect was independent of the choice between voltage- or current-controlled stimulators and was observed at all tested frequencies. DC delivery occurred during the first few seconds following KHFAC initiation, and again with the opposite polarity at the end of KHFAC delivery when capacitors were used to de-couple the electrodes from the stimulators. Thus, most of the charge initially delivered was reversed fairly rapidly at the end of KHFAC delivery, and the entire period may be considered “charge-balanced”. However, if KHFAC is delivered continuously for many hours, this implies that the “recharge phase” is delayed for many hours. As we have demonstrated, even 30 seconds of KHFAC delivery resulted in reactions at the electrodes that could not be adequately reversed by the charge recovery, and, in fact, the charge recovery overcompensated for these effects, driving the electrode potential in the opposite direction (see Fig. 7). It may be that the kinetics for the reactions at the electrode could not support complete reversibility for tens of seconds. The rise in offset voltages post KHFAC delivery, measured against a reference electrode after repeated KHFAC deliveries, indicate the occurrence of faradaic reactions. Rising offset voltages across the inline-capacitors indicated that the capacitors did provide DC-block once the voltage compliance of the generator was reached and, secondly, that all KHFAC generators produced small offset currents as contamination to the KHFAC waveforms.
The delivery of continuous DC to neural tissue can result in damage. Common damage thresholds are 2 μA for the cochlea (Whitwam 1975; Shepherd 1991; Tykocinski 1997; Shepherd 1999; Tykocinski 2001), 3 μA for the central nervous system (Hurlbert 1993; Islam 1995), and <10 μA for damage in the peripheral nervous system (Agnew 1989; Bhadra 2004). These levels are primarily based on histological observation, which was not a part of this study. Given the offset potentials reached during and remaining after KHFAC delivery that are reported in this manuscript, there remains the possibility that this offset could produce neural damage. However, we cannot infer damage directly based on the in-vitro studies reported here and further chronic in vivo study would need to be conducted in order to determine any deleterious effects.
It is important to note that unintended DC offsets delivered during KHFAC testing may have an unexpected effect on neural structures even if the electrode potential stays within the water window. Specifically, DC can reversibly block nerve conduction at current levels as low as 6 μA in some experimental conditions (Bhadra 2004). The unintended use of mixed-signal waveforms (AC + DC), particularly in nerve conduction block research, make it difficult to assess the effects of KHFAC as reported in the literature (Kilgore 2013). To achieve more clarity about the specific waveforms used in this area of research, we recommend that future publications should specify the methods used to measure the output of the signal generator. At a minimum, measurement of the average offset voltage between the two electrodes in-vitro or in-vivo with a floating oscilloscope provides an initial assessment of the magnitude of the unintended DC. If this measurement indicates that there is no offset voltage forming between the electrodes over the time of KHFAC application, then the risk of unintended DC is limited to ground loops between the stimulator and outside connections, a problem easily addressed using a stimulus isolator. However, it should be noted that a stimulus isolator alone, providing a current-controlled signal with or without capacitive de-coupling of the output, is no guarantee that DC is eliminated from the KHFAC signals, as we have shown. Ultimately, a more pragmatic approach may be preferable: the comparison of the output of the KHFAC generator under test with and without a large value inductor placed across the electrodes. If the DC is negligible, there will be no difference in the neural response between these two conditions. Large value inductors for kHz AC signals can be obtained in a small package volume using iron-core transformers with an open secondary side. As the inductors used in our experiment came with a package volume of about 1 inch3, we are not proposing to use these for an implantable device, but a research tool. We are currently investigating the efficacy of inductors that provide about 1.3 Henry while needing a volume of about 1 cm3, in order to get closer to providing DC-free KHFAC waveforms with implantable waveform generators. A future publication will address if different inductance values and electrode impedances affect the efficacy of our approach to reduce unintended DC contamination with large value inductors that function as a DC-shunt.
Conclusion
Ensuring signal integrity is an essential step to evaluating the safety and efficacy of KHFAC waveforms used for neural stimulation or nerve block. We have demonstrated that unintentional DC-contamination is very likely for KHFAC signals generated by off-the-shelf stimulators and should be filtered accordingly to prevent unintended effects. The application of DC-blocking inline-capacitors alone is not always sufficient to prevent DC-contamination from delivery through electrodes and into neural tissue. DC-contamination can be virtually eliminated by adding two DC-shunting (high value) inductors to the DC-blocking capacitor circuit. This configuration was sufficient to reduce the voltage offset to less than 2 mV in all cases. This study highlights the importance of careful measurement of electrode potentials when using KHFAC. We recommend that specific measurement of DC-contamination be conducted and reported in all studies of the effect of KHFAC waveforms on neural structures. Such reporting will significantly improve the ability of the scientific community to assess the results that are being presented.
Highlights.
Unintentional DC contamination can be a problem in KHFAC waveforms used for nerve block applications.
Current- and voltage controlled systems cause different amounts of unintended DC.
DC-blocking inline-capacitors are not always sufficient to eliminate the resulting offset voltages.
Large value inductors as DC-shunts can reduce DC offset to less than 1μA.
Acknowledgements
This work was supported by the NIH NINDS R01-NS-074149 and DK077089, NIBIB R01-EB-002091, the Department of Veteran’s Affairs VA RR&D B6685R, the Case Coulter Translation & Innovation Partnership and the Fulbright Foundation G-1-00001 Scholar Grant. The authors would like to thank Tina Vrabec and JesseWainright for their assistance with the study.
This work was supported in part by NIH NINDS R01-NS-074149, NIBIB R01-EB-002091, the Department of Veteran’s Affairs VA RR&D B6685R, and the Fulbright Foundation G-1-00001 Scholar Grant.
Footnotes
Publisher's Disclaimer: This is a PDF file of an unedited manuscript that has been accepted for publication. As a service to our customers we are providing this early version of the manuscript. The manuscript will undergo copyediting, typesetting, and review of the resulting proof before it is published in its final citable form. Please note that during the production process errors may be discovered which could affect the content, and all legal disclaimers that apply to the journal pertain.
Contributor Information
Manfred Franke, Case Western Reserve University, Cleveland, OH, 44106 USA (Manfred.Franke@gmail.com).
Niloy Bhadra, Case Western Reserve University, Cleveland, OH, 44106 USA (nxb26@case.edu).
Narendra Bhadra, Case Western Reserve University, Cleveland, OH, 44106 USA (nxb11@case.edu).
Kevin Kilgore, MetroHealth Medical Center, Louis Stokes Cleveland Department of Veterans Affairs Medical Center, and Case Western Reserve University, Cleveland, OH, 44106 USA.
References
- Agnew WF, McCreery DB, et al. Histologic and physiologic evaluation of electrically stimulated peripheral nerve: considerations for the selection of parameters. Ann Biomed Eng. 1989;17(1):39–60. doi: 10.1007/BF02364272. [DOI] [PubMed] [Google Scholar]
- Bhadra N, Kilgore KL. Direct current electrical conduction block of peripheral nerve. IEEE Trans Neural Syst Rehabil Eng. 2004;12(3):313–24. doi: 10.1109/TNSRE.2004.834205. [DOI] [PubMed] [Google Scholar]
- Bhadra N, Kilgore KL. High-frequency electrical conduction block of mammalian peripheral motor nerve. Muscle Nerve. 2005;32(6):782–90. doi: 10.1002/mus.20428. [DOI] [PubMed] [Google Scholar]
- Bhadra N, Mortimer JT. Selective block of external anal sphincter activation during electrical stimulation of the sacral anterior roots in a canine model. Neurogastroenterol Motil. 2005;17(5):721–6. doi: 10.1111/j.1365-2982.2005.00678.x. [DOI] [PubMed] [Google Scholar]
- Boger A, Bhadra N, et al. Bladder voiding by combined high frequency electrical pudendal nerve block and sacral root stimulation. Neurourol Urodyn. 2008;27(5):435–9. doi: 10.1002/nau.20538. [DOI] [PubMed] [Google Scholar]
- Bowman BR, McNeal DR. Response of single alpha motoneurons to high-frequency pulse trains. Firing behavior and conduction block phenomenon. Applied Neurophysiology. 1986;49(3):121–38. doi: 10.1159/000100137. [DOI] [PubMed] [Google Scholar]
- Chae J, Kilgore K, et al. Functional neuromuscular stimulation in spinal cord injury. Phys Med Rehabil Clin N Am. 2000;11(1):209–26. x. [PubMed] [Google Scholar]
- Cogan SF. Neural stimulation and recording electrodes. Annu Rev Biomed Eng. 2008;10:275–309. doi: 10.1146/annurev.bioeng.10.061807.160518. [DOI] [PubMed] [Google Scholar]
- Douglas WW, Malcolm JL. The effect of localized cooling on conduction in cat nerves. J Physiol. 1955;130(1):53–71. doi: 10.1113/jphysiol.1955.sp005392. [DOI] [PMC free article] [PubMed] [Google Scholar]
- Dowden BR, Wark HA, et al. Muscle-selective block using intrafascicular high-frequency alternating current. Muscle Nerve. 2010;42(3):339–47. doi: 10.1002/mus.21678. [DOI] [PubMed] [Google Scholar]
- Huang CQ, Shepherd RK, et al. Electrical stimulation of the auditory nerve: direct current measurement in vivo. IEEE Trans Biomed Eng. 1999;46(4):461–70. doi: 10.1109/10.752943. [DOI] [PubMed] [Google Scholar]
- Hurlbert RJ, Tator CH, et al. Dose-response study of the pathological effects of chronically applied direct current stimulation on the normal rat spinal cord. J Neurosurg. 1993;79(6):905–16. doi: 10.3171/jns.1993.79.6.0905. [DOI] [PubMed] [Google Scholar]
- Islam N, Aftabuddin M, et al. Increase in the calcium level following anodal polarization in the rat brain. Brain Res. 1995;684(2):206–8. doi: 10.1016/0006-8993(95)00434-r. [DOI] [PubMed] [Google Scholar]
- Jensen AL, Durand DM. High frequency stimulation can block axonal conduction. Exp Neurol. 2009;220(1):57–70. doi: 10.1016/j.expneurol.2009.07.023. [DOI] [PMC free article] [PubMed] [Google Scholar]
- Joseph L, Butera RJ. High-frequency stimulation selectively blocks different types of fibers in frog sciatic nerve. IEEE Trans Neural Syst Rehabil Eng. 19(5):550–7. doi: 10.1109/TNSRE.2011.2163082. [DOI] [PMC free article] [PubMed] [Google Scholar]
- Kilgore KL, Bhadra N. Reversible Nerve Conduction Block Using Kilohertz Frequency Alternating Currents. Muscle Nerve. 2013 doi: 10.1111/ner.12100. [DOI] [PMC free article] [PubMed] [Google Scholar]
- Maxwell JC. A Treatise on Electricity and Magnetism. 1881. [Google Scholar]
- Naples GG, Mortimer JT, et al. A spiral nerve cuff electrode for peripheral nerve stimulation. IEEE Trans Biomed Eng. 1988;35(11):905–16. doi: 10.1109/10.8670. [DOI] [PubMed] [Google Scholar]
- Shannon RV. A model of safe levels for electrical stimulation. IEEE Trans Biomed Eng. 1992;39(4):424–6. doi: 10.1109/10.126616. [DOI] [PubMed] [Google Scholar]
- Shepherd RK, Linahan N, et al. Chronic electrical stimulation of the auditory nerve using non-charge-balanced stimuli. Acta Otolaryngol. 1999;119(6):674–84. doi: 10.1080/00016489950180621. [DOI] [PubMed] [Google Scholar]
- Shepherd RK, Matsushima J, et al. Cochlear pathology following chronic electrical stimulation using non charge balanced stimuli. Acta Otolaryngol. 1991;111(5):848–60. doi: 10.3109/00016489109138421. [DOI] [PubMed] [Google Scholar]
- Tai C, Roppolo JR, et al. Block of external urethral sphincter contraction by high frequency electrical stimulation of pudendal nerve. J Urol. 2004;172(5 Pt 1):2069–72. doi: 10.1097/01.ju.0000140709.71932.f0. [DOI] [PubMed] [Google Scholar]
- Tiede J, Brown L, et al. Novel spinal cord stimulation parameters in patients with predominant back pain. Neuromodulation. 16(4):370–5. doi: 10.1111/ner.12032. [DOI] [PubMed] [Google Scholar]
- Tykocinski M, Duan Y, et al. Chronic electrical stimulation of the auditory nerve using high surface area (HiQ) platinum electrodes. Hear Res. 2001;159(1-2):53–68. doi: 10.1016/s0378-5955(01)00320-3. [DOI] [PubMed] [Google Scholar]
- Tykocinski M, Shepherd RK, et al. Reduction in excitability of the auditory nerve following electrical stimulation at high stimulus rates. II. Comparison of fixed amplitude with amplitude modulated stimuli. Hear Res. 1997;112(1-2):147–57. doi: 10.1016/s0378-5955(97)00117-2. [DOI] [PubMed] [Google Scholar]
- Waataja JJ, Tweden KS, et al. Effects of high-frequency alternating current on axonal conduction through the vagus nerve. J Neural Eng. 2011;8(5):056013. doi: 10.1088/1741-2560/8/5/056013. [DOI] [PubMed] [Google Scholar]
- Whitwam JG, Kidd C. The use of direct current to cause selective block of large fibres in peripheral nerves. Br J Anaesth. 1975;47(11):1123–33. doi: 10.1093/bja/47.11.1123-b. [DOI] [PubMed] [Google Scholar]
- Williamson RP, Andrews BJ. Localized electrical nerve blocking. IEEE Trans Biomed Eng. 2005;52(3):362–70. doi: 10.1109/TBME.2004.842790. [DOI] [PubMed] [Google Scholar]