

Abstract
Subplate neurons (SPNs) form one of the earliest maturing circuits in the cerebral cortex and are crucial to cortical development. In addition to thalamic inputs, subsets of SPNs receive excitatory AMPAR-mediated inputs from the developing cortical plate in the second postnatal week. Functionally silent (non-AMPAR-mediated) excitatory synapses exist in several systems during development, and the existence of such inputs can precede the appearance of AMPAR-mediated synapses. Because SPNs receive inputs from presynaptic cells in different cortical layers, we investigated whether AMPAR-mediated and silent synapses might originate in different layers. We used laser-scanning photostimulation in acute thalamocortical slices of mouse auditory cortex during the first 2 postnatal weeks to study the spatial origin of silent synapses onto SPNs. We find that silent synapses from the cortical plate are present on SPNs and that they originate from different cortical locations than functional (AMPAR-mediated) synapses. Moreover, we find that SPNs can be categorized based on the spatial pattern of silent and AMPAR-mediated connections. Because SPNs can be activated at young ages by thalamic inputs, distinct populations of cortical neurons at young ages have the ability to signal to SPNs depending on the activation state of SPNs. Because during development intracortical circuits are spontaneously active, our results suggest that SPNs might integrate ascending input from the thalamus with spontaneously generated cortical activity patterns. Together, our results suggest that SPNs are an integral part of the developing intracortical circuitry and thereby can sculpt thalamocortical connections.
Keywords: auditory cortex, critical period, silent synapse, spontaneous, subplate, waves
Introduction
Subplate neurons (SPNs) are a key neuronal population that are present predominantly in the developing cerebral cortex (Kanold and Luhmann, 2010). SPNs play a critical role in establishing and refining the connections between the thalamus and cortex (Ghosh and Shatz, 1992; Kanold et al., 2003; Kanold and Luhmann, 2010; Tolner et al., 2012). Removal of SPNs abolishes intrinsic cortical oscillatory activity patterns and prevents the segregation and maturation of thalamocortical afferents (Ghosh and Shatz, 1992; Kanold et al., 2003; Kanold and Luhmann, 2010; Tolner et al., 2012). In primary sensory areas, SPNs relay thalamic inputs into the future thalamorecipient layer, layer 4 (Zhao et al., 2009). In addition to this feedforward role, SPNs also receive excitatory feedback input from the developing cortical plate (Viswanathan et al., 2012). Although these inputs are present at the earliest ages studied in some cells, the fraction of SPNs receiving excitatory feedback inputs increases with age (Viswanathan et al., 2012).
During development of glutamatergic synapses, there is a time window when synapses contain no AMPA receptors (AMPARs) but only NMDARs (Malenka and Nicoll, 1997; Hanse et al., 2013). Because such synapses do not signal at rest, they are called silent synapses. However, if a cell is depolarized, these synapses can become functionally active and potentially signal information. In the cerebral cortex, the majority of silent synapses mature along with cortical layers (Rumpel et al., 2004). Silent synapses generally decrease during development, but transient increases occur (Rumpel et al., 2004). Because SPNs are among the earliest born neurons in the cerebral cortex, we consider whether SPNs might contain silent synapses and whether presynaptic cells signaling via silent and AMPAR-mediated synapses were colocated. Furthermore, because SPNs receive cortical inputs, we hypothesized that those cells might receive silent synapses from the cortical plate and that such synapses might precede the establishment of AMPAR-mediated synapses.
We investigated in vitro whether SPNs have silent synapses by performing whole-cell patch-clamp recordings in thalamocortical slices from developing primary auditory cortex (A1) in mice. We activated presynaptic cells via laser-scanning photostimulation (LSPS) of caged glutamate, which allowed us to assay AMPAR-mediated and NMDAR-mediated synapses. We find that, even at very early postnatal stages, connections onto SPNs contain both AMPAR-mediated and silent synapses. Interestingly, although connections from presynaptic neurons in close proximity to the postsynaptic SPN tend to contain both AMPAR-mediated and silent synapses, connections originating from cells farther away contain exclusively silent synapses. Thus, the composition and maturation of synapses between cells might depend on the relative distance between connected cells.
The existence of silent synapses at early ages when few SPNs receive AMPAR-mediated inputs from the cortical plate also indicates that SPNs can integrate and coordinate endogenous cortical activity patterns with thalamic inputs. Thus, when an area of cortex becomes spontaneously active while thalamic inputs activate SPNs, silent synapses will be active. This interaction might contribute to the formation of topographic cortical organization. Together, these results highlight the key position of SPNs in the developing thalamocortical circuit.
Materials and Methods
Slice preparation and solutions.
Thalamocortical brain slices were prepared as described previously (Zhao et al., 2009; Viswanathan et al., 2012). All procedures were approved by the University of Maryland Institutional Animal Care and Use Committee. C57BL/6 mice of either sex from postnatal day 3 (P3) to P15 were used. Mice were deeply anesthetized with isoflurane before decapitation and removal of the brain. Acute thalamocortical slices (500 μm) were prepared using a vibrating microtome (Leica) in ice-cold artificial CSF (ACSF) consisting of the following (in mm): 130 NaCl, 3 KCl, 1.25 NaH2PO4, 20 NaHCO3, 10 glucose, 1.3 MgSO4, and 2.5 CaCl, pH 7.35–7.4 (equilibrated with 95% O2–5% CO2). The cutting angle was ∼15° from the horizontal plane (lateral raised) for older mice (older than P8) and steeper for younger ages to compensate for the lateral growth of cortex (Viswanathan et al., 2012). The slices were incubated in ACSF for 1 h at 30°C and then kept at room temperature.
Identification of the subplate.
A relatively cell-sparse area between the large layer 6 pyramidal cells and the ventricular zone was identified as the subplate zone (Viswanathan et al., 2012).
Electrophysiology.
Recordings were performed from 184 neurons with a patch-clamp amplifier (Multiclamp 700B; Molecular Devices). Electrodes were filled with the following (in mm): 115 cesium methanesulfonate, 5 NaF, 10 EGTA, 15 CsCl, 3.5 MgATP, and 3 QX-314, pH 7.25 (300 mOsm). Biocytin or Neurobiotin (0.5%) was added to the electrode solution as needed. To reduce the probability of multisynaptic events, all slices are perfused with a high Mg2+ ACSF solution during recording (in mm): 124 NaCl, 5 KCl, 1.23 NaH2PO4, 26 NaHCO3, 10 glucose, 4 MgCl2, and 4 CaCl2. The electrode resistance in the bath was 4–9 MΩ. Data were acquired with a National Instruments analog-to-digital board and the software EPHUS (Suter et al., 2010) (https://openwiki.janelia.org/wiki/display/ephus/Ephus). Membrane voltages were corrected for an estimated liquid junction potential of 10 mV.
LSPS.
LSPS was performed as described previously (Viswanathan et al., 2012). Caged glutamate [N-(6-nitro-7-coumarylmethyl-l-glutamate] at 0.5–1 mm (Kao, 2006) was added to the ACSF. We typically stimulated an array of up to 30 × 30 sites with 40–50 μm spacing to enable us to probe areas of ∼1 × 1 mm. Stimuli were applied at 1 Hz. Small clusters of neurons were excited at each site in an array of locations while recording from individual SPNs. Laser power (<25 mW) was adjusted to achieve reliable neuron activation and repeatable maps. The same settings were used through all experiments. To detect monosynaptically evoked EPSCs, we measured peak EPSC amplitudes in a 50 ms time window after the stimulation. AMPAR-mediated responses were recorded by holding cells at −70 mV, whereas NMDAR-mediated responses were recorded at a +40 mV holding potential. Traces containing a short-latency response (∼8 ms) were considered to reflect direct activation of receptors on the patched cell and were discarded from the analysis (Fig. 1B). We validated the direct responses window by adding tetrodotoxin (TTX) into the ACSF bath solution (Fig. 1C). Traces with latencies longer than 50 ms were discarded because of potential involvement of polysynaptic components. LSPS maps were very repeatable (95.6 ± 3% overlap as measured by percentage spatial differences between subsequent maps; n = 27 cells).
Figure 1.
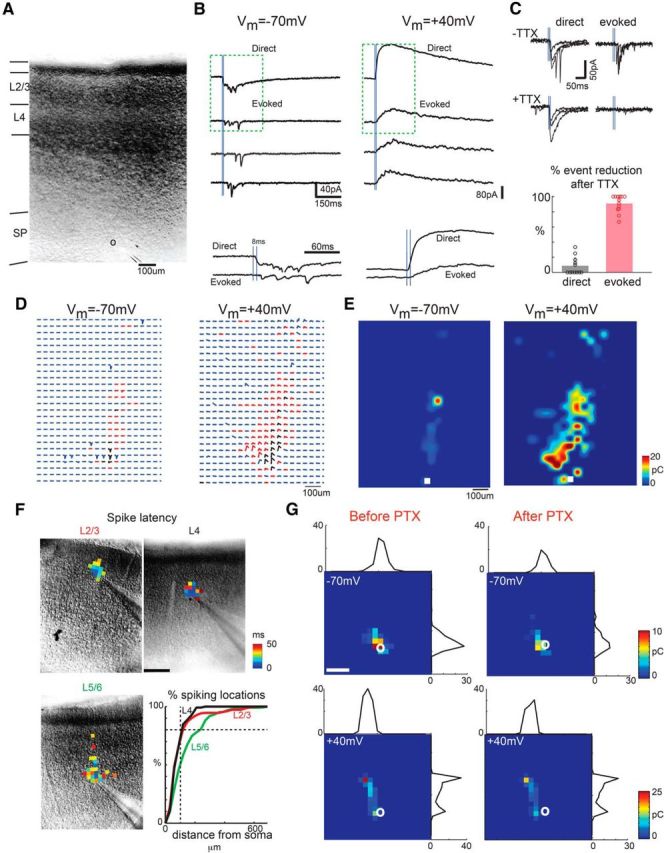
LSPS maps from A1 cells to SPNs. A, Infrared image of cortical field with patched SPN (pipette) that is being mapped. The borders between cortical layers are indicated by the black bars along the left edge of the image. B, To investigate the excitatory synaptic currents carried by AMPARs and NMDARs, LSPS maps are performed at −70 and +40 mV holding potential, respectively. The top panel shows example traces for one SPN. When the laser stimulation is close to the soma, it can directly activate the cell and produce short-latency large-amplitude direct responses (row 1, left for −70 mV, right for +40 mV). The evoked traces typically have longer latencies and graded peak (rows 2–4). Vertical blue lines: the first blue line indicates the time of laser pulse; the second blue line that is 8 ms after the first indicates the threshold for longer-latency responses. The magnifications of traces inside the dashed squares (200 ms) are plotted below. C, Top left, Traces with latency shorter than 8 ms still exist after TTX. Top right, Traces with latency longer than 8 ms disappeared after TTX. Bottom, Fraction of events that were blocked by TTX (red) or remained (black). Most (>85%) of the short-latency responses (≤8 ms) are TTX resistant, whereas most (>90%) of longer-latency ones (>8 ms) are TTX sensitive (n = 13 cells). A small fraction of long-latency events were TTX resistant, likely because of dendritic filtering of direct responses. D, Traces obtained by LSPS when holding one SPN at −70 and +40 mV, respectively. Traces showing large-amplitude direct responses are shown in black. The responses that have latencies between 8 and 50 ms are shown in red. Otherwise, the traces are shown in blue. E, Plotted is transferred charge at each stimulation site. Location of the soma is indicated by the white squares. Note that stimulation sites in the cortical plate gave rise to AMPA EPSCs but that the area from which responses could be evoked was much larger when the SPN was held at +40 mV. F, Cell-attached recording from layer 2/3 (left), layer 4 (middle), and layer 5/6 (right) cells, respectively, show areas that evoked APs. Maps show first spike latencies encoded by color overlaid on infrared images. Graph shows cumulative distributions of distances from locations that resulted in APs to the soma for layer 4 (black, n = 24), layer 2/3 (red, n = 16), and layer 5/6 (green, n = 22) cells. Approximately 80% of stimulation sites that evoke spikes are within 100 μm of the soma. Note that short-latency spikes for layer 5/6 neurons are evoked close to soma, whereas distant location could lead to long-latency spikes in a few cells. G, PTX does not change glutamatergic LSPS maps. LSPS maps for an SPN with holding potential at −70 and +40 mV before and after adding PTX (P3). The color indicates the charge of the PSCs with latencies <50 ms, and the white circle indicates the soma location. The marginal black traces show summed EPSCs along laminar and column directions. Adding PTX resulted in very similar maps. Scale bar, 200 μm.
Identification of silent synapses.
Stimulation sites mediated by NMDAR-only (silent) synapses were identified as sites at which responses were obtained at +40 mV but not at −70 mV. To quantify synaptic strength at either holding potential, we calculated the transferred charge by integrating the responses with baseline subtracted inside a 200 ms window and plotted the result as a function of laser position. To probe for different classes of SPNs, we used k-means clustering to minimize the total absolute distance (MATLAB 7.11, statistics toolbox 7.4). We clustered on both cortical and columnar extent. To test the validity of clustering and identify how many cell classes were present, we increased the numbers of clusters from 1 to 10 and calculated the fraction of variance that the clusters explained (R2) or the Dunn index.
Drugs.
Picrotoxin (PTX; 100 μm) was used to block GABAAR-mediated currents, TTX (1 μm) was used to block action potentials (APs), and (2R)-amino-5-phosphonovaleric acid (APV; 50 μm) was used to block NMDA currents. Typically, PTX was added to the external solution ∼10 min before starting recordings to ensure complete block of GABAA signaling.
Statistics.
Results are plotted as means ± SD compared with a rank-sum or Student's t test (based on Lilliefors test for normality) and deemed significant if p < 0.05.
Results
We investigated AMPAR-mediated and NMDAR-mediated excitatory inputs to SPNs by whole-cell voltage-clamp recordings from SPNs (P3–P15, n = 109 cells) in A1 coupled with LSPS activation of caged glutamate. We characterized the connections to SPNs over three age ranges (P3–P5, P6–P9, P10–P15), approximately according to distinct functional states of the auditory system: hair cells function after P5 and the mouse ear canal opens at P9 (Shnerson and Pujol, 1983).
We recorded SPNs in thalamocortical slices (Fig. 1A) with the holding potential at −70 and +40 mV, respectively. To block GABAAR-mediated responses, PTX was added to the bath. Thus, when holding cells at −70 mV, we observed AMPAR-mediated currents only, and both AMPAR- and NMDAR-mediated currents at +40 mV. If a connection is present between a stimulated neuron and the recorded neuron, a postsynaptic current (PSC) is visible. During voltage-clamp recording when the SPN was held at −70 mV, photostimulation could evoke two types of responses: (1) a large inward current with short onset latency (≤8 ms); and (2) a smaller amplitude inward current with longer latency (Fig. 1B). The short-latency response is attributable to direct activation of the recorded cell and remains after adding TTX (Fig. 1C). The long-latency response can be abolished by adding TTX and is thus dependent on synaptic release from presynaptic cells (Fig. 1C). In a few cases, evoked responses were present together with direct responses. Because these events occurred close to the cell body and are difficult to separate from direct responses, they were not analyzed here. Short-latency direct and long-latency indirect responses were also visible when holding cells at +40 mV (Fig. 1B). To investigate the spatial pattern of excitatory connections to SPNs from the A1 cortical plate, up to 900 photostimulation sites (spatial separation of 40–50 μm) were sequentially sampled in a pseudorandom pattern (Viswanathan et al., 2012) to cover the entire radial extent of the cortical column from pia to ventricle (Fig. 1D). We quantified the strength of the excitatory inputs to SPNs by calculating the charge of the evoked EPSC (Viswanathan et al., 2012) and plotted two-dimensional maps of connectivity (Fig. 1E).
To isolate NMDAR-mediated currents at depolarized voltages, we blocked GABAAR-mediated signaling with PTX, which might potentially have an influence on the spatial resolution of LSPS. To determine the spatial resolution of LSPS under these conditions, we performed cell-attached recordings from layer 2/3, layer 4, and layer 5/6 cells from P3 to P15 and measured the spatial distribution of stimulation sites that lead to APs in the recorded cell (Fig. 1F). Most photostimulation-evoked APs of layer 2/3 and layer 4 cells (latencies ≤50 ms) were evoked close to the soma (Fig. 1F, red and black in cumulative histogram plot). Similar to our previous results (Viswanathan et al., 2012), we could identify two classes of layer 5/6 cells based on their activation regions. Some layer 5/6 cells could be driven by stimulating layer 2/3, whereas others showed very restricted areas of activation (Fig. 1F, green). Comparing LSPS maps in SPNs (including both direct responses and monosynaptic events) obtained before and after PTX application showed that PTX had little influence on LSPS maps (Fig. 1G) and thus little influence on the spatial resolution of LSPS under our conditions.
SPNs have silent synapses
To investigate the spatial distribution of silent synapses, we recorded SPNs at holding potentials of −70 and +40 mV. When a synapse contains AMPARs, there will be responses recorded at both −70 and +40 mV. However, if a synapse contains only NMDARs, and thus is a silent synapse, there will only be responses at +40 mV but not at −70 mV. We find that silent synapses exist for most SPNs. Figure 2 shows an example cell for which PSCs were observed at −70 and +40 mV (Fig. 2A) and which showed PSCs from the subplate and the overlying cortical plate. Figure 2B shows several example responses [the numbers on top of the blue and green squares indicate the correspondingly marked locations in the slice (Fig. 2A) where those responses were evoked]. Traces marked with blue squares show responses at both −70 and +40 mV. In contrast, the traces marked with green squares only have responses at +40 mV but not at −70 mV, which indicates the presence of a silent synaptic connection. To validate that the responses at +40 mV were mediated by NMDARs, we applied APV, an NMDA antagonist, to the recording solution. The amplitudes of the currents at +40 mV dramatically decreased (n = 6 cells). Moreover, the peak responses in the cases that showed responses at both −70 and +40 mV (blue squares) became comparable at the two potentials, indicating that the remaining current at +40 mV was mediated by AMPARs. In contrast to the cases that showed only responses at +40 mV, APV abolished the responses (Fig. 2B, trace marked by green square). Thus, the spatial extent of the input maps and EPSC amplitudes at +40 mV are significantly decreased after APV application such that maps at −70 and +40 mV are of similar size (Fig. 2C,D). Similar effects were seen in the other six SPNs (Fig. 2E). Importantly, the responses could not be restored by increasing laser power, indicating that the spatial reduction in +40 mV components was not caused by decreased excitability. Together, our results show that intracortical inputs to SPNs are mediated by both AMPARs and NMDARs and that SPNs have silent synapses.
Figure 2.

SPNs have silent synapses. A, Responses activated with latencies <50 ms are numbered and superimposed on the infrared image of A1 (P4). Traces in stimulus locations that evoked responses at −70 and +40 mV are indicated in yellow. Locations that only showed responses at +40 mV but not at −70 mV are indicated in red. The numbers superimposed on the infrared image of the slice indicate stimulation sites in which a PSC has been observed. Scale bar, 100 μm. B, Example traces from the map in A. Left column shows the traces before adding APV. Traces marked with blue squares show responses at both −70 and +40 mV holding potential. Traces marked with green squares show responses at +40 mV but not −70mV. Scale bar, 100 ms. The blue dashed box shows a 50 ms window after laser onset. The dashed red line indicates 8 ms after photostimulation. Right columns show traces after APV. C, Entire LSPS maps for the same neuron shown in A before (left) and after (middle) adding APV, as well as reduction in map (right). Black areas show direct inputs. Note that APV reduced the extent of the map obtained at +40 mV to essentially the similar size seen at −70 mV. Scale bars, 100 μm. D, Reduction of evoked EPSC after APV. EPSCs measured at −70mV are unchanged (reduction of 13.9 ± 11.7%; p > 0.05), whereas there is a large reduction of EPSCs measured at +40 mV (reduction of 96.5 ± 7.2%; p < 0.000001). E, Plot of the percentage of the novel inputs observed when cells were held at +40 mV versus maps at −70 mV (red and black circles for individual cells from P4 to P12, n = 7).
Silent synapses on SPNs exist for spatially distant inputs and the spatial distribution of silent synapses changes over development
Because the spatial distribution of cortical cells that synapse onto SPNs changes over development (Viswanathan et al., 2012), we investigated whether the strength and spatial probability of a connection to be mediated by silent synapses changed over development. We grouped SPNs into three age groups and calculated the spatial probability and strength of silent synapses. We calculated the spatial probability by counting the numbers of SPNs in each of three age groups (P3–P5, P6–P9, and P10–P15) that had a silent synaptic connection from a particular spatial location, divided by the total number of SPNs in that group. We calculated the strength of silent synapses by calculating the transferred charge at +40 mV for spatial locations that were identified as silent. We then plotted the relative strength of silent synapses and the spatial probability of silent synapses for each age group (Fig. 3A). We find that silent synapses are present at all ages from P3 to P15. At the youngest ages, silent synaptic input tends to originate from stimulation sites far from the soma in the cortical plate. Thus, cells far from the recorded SPN signal via silent synapses. Moreover, comparing the maps at different ages suggested that the abundance and synaptic strength of silent synapses on SPNs changed over development, with a transient increase from P6 to P9 (Fig. 3B).
Figure 3.
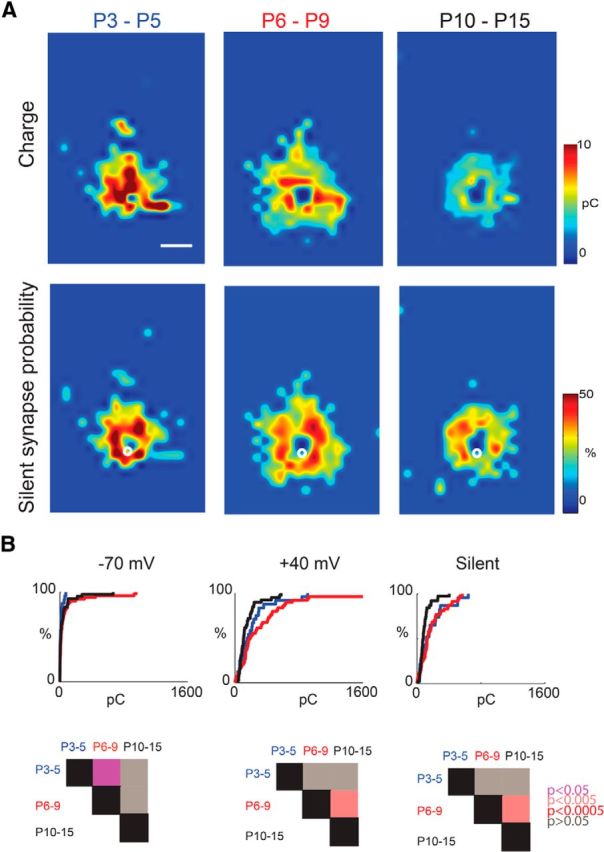
The spatial distribution of sites that signal via silent synapses changes with age. A, Spatial distribution of transferred charge of silent synapses (top row) and probability of occurrence of silent synapses (bottom row) for cells recorded at different age groups (columns). Scale bar, 200 μm. B, Cumulative distribution function (CDF) of total charge of SPNs in the different age groups at different holding potentials. Matrix shows p values between the age groups.
Within our complete sample of SPNs, we noticed distinct spatial patterns of synaptic input to SPNs from the cortical plate (Fig. 4A). To describe more completely the spatial profile of synaptic inputs to a given SPN, we measured the lateral and cortical extent of synaptic inputs for each cell. We then plotted the extent of cortical input to SPNs as a function of lateral extent (Fig. 4B). The spatial range of inputs to individual SPNs varied widely, but they appeared to form distinct groups based on this two-dimensional description of their synaptic input patterns. To test whether SPNs indeed segregated into different classes, we performed two-dimensional k-means clustering on these data (Fig. 4C). The clustering showed that SPNs could be divided into four clusters (Fig. 4B) based on their spatial inputs at −70 mV. The four populations of SPNs differed by the extent of feedback they received from the cortical plate and the amount of lateral connectivity (Fig. 4B, marginal graphs). To visualize the differences in spatial synaptic input pattern, we plotted the average spatial maps of PSCs at −70 and +40 mV, as well as the spatial distribution of silent synapses for these four classes of SPNs (Fig. 5A). Cells falling into group 1 and group 3 received few AMPAR-mediated inputs from the cortical plate, especially not from layer 4. Moreover, group 1 cells had very restricted AMPA inputs but a very large area of silent synapses that spanned into the cortical plate. Group 3 cells also had little AMPAR-mediated cortical inputs, but the spatial distribution of the AMPAR-mediated inputs within the subplate was broader, indicating that these cells received inputs from a larger spatial range of presynaptic SPNs. Cells in groups 2 and 4 received AMPAR-mediated inputs from the cortical plate, including layer 4. The difference between groups 2 and 4 was that the distribution of AMPAR-mediated inputs in group 4 cells was much broader than that of group 2 cells. Moreover group 2 cells received a large number of silent synapses from layer 4, whereas group 4 cells did not.
Figure 4.

SPNs form four groups based on distinct spatial input patterns. A, Maps of four SPNs mapped at −70 and +40 mV, as well as distribution of silent synapses (cell 1, P10; cell 2, P8; cells 3 and 4, P6). Color indicates PSCs charge. B, Scatter plot of cortical extent versus columnar extent of SPNs mapped at −70 mV. The columnar extent is the columnar width over 1 mm. Colors indicate the four groups based on clustering. Graphs on the sides indicate marginal distributions. C, Fraction of total variance explained by k-means clustering with different numbers of clusters. Graphs show clustering on columnar and cortical extent. Vertical dashed line indicates four clusters, which accounted for >90% of the variance.
Figure 5.
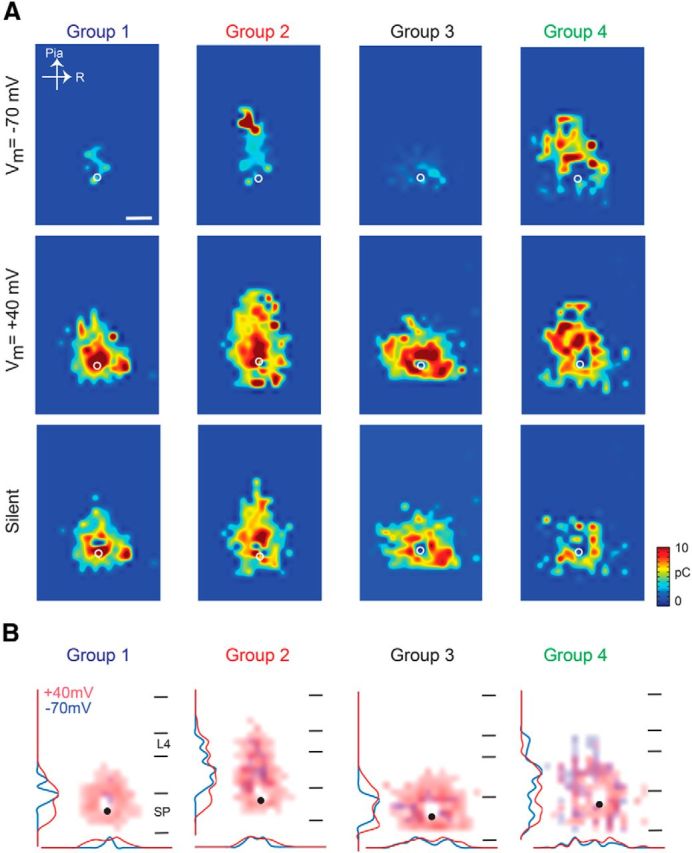
LSPS maps of the four groups. A, Average maps of transferred charge for SPNs in the four groups. Shown are maps at holding potentials of −70 mV (top) and +40 mV (middle) and of silent synapses (bottom). A total of 43.5% of cells were in group 1, 22.6% in group 2, 19.1% in group 3, and 14.8% in group 4. All the studied cells are aligned to the position marked by the white circle. Scale bar, 200 μm. B, Overlay of LSPS maps at the two holding potentials (−70 mV in blue, +40 mV in red) for SPNs in the four groups.
To further visualize the differences between the four groups of SPNs at −70 and +40 mV, we overlaid the average maps and also plotted the marginal distributions (Fig. 5B). Red marks areas in which silent synapses are present, whereas areas in blue have AMPAR-mediated currents. The maps for cells in the other groups show that silent synapses originate from cortical locations that are more superficial than those mediated by AMPARs. Group 1 cells also showed a very broad distribution of silent synapses within the subplate. Moreover, the input pattern of groups 3 and 4 at −70 mV was patchy (note the non-Gaussian marginal distributions), indicating that SPNs are not contacted by a spatially uniform group of cells.
We found previously that SPNs form distinct groups of neurons based on their inputs arising from layer 4 (Viswanathan et al., 2012). Therefore, we measured the amount of input the different groups of SPNs received from layer 4. As described previously, we identified layer 4 based on the differential interference contrast images (Fig. 6A) and calculated the total input that a given SPN received from layer 4 compared with the total synaptic input a given SPN received (Fig. 6B). Plotting the total amplitude and area of input from layer 4 (Fig. 6C,D) in the four groups at the different holding potentials showed that all groups had silent synapses in layer 4. Silent synapses from layer 4 were most abundant in group 2. Moreover, the different groups of SPNs also differed by the amount of input received from layers 5/6, as well as from within the subplate (Figs. 7, 8).
Figure 6.
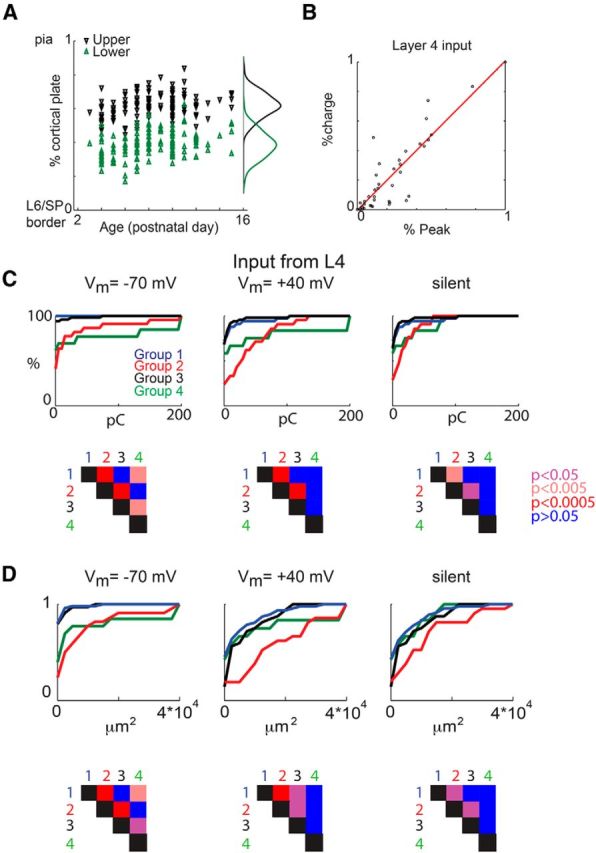
The four groups of SPNs show differences in layer 4 input. A, Upper and lower borders of layer 4 as identified from a differential interference contrast image (Viswanathan et al., 2012). The locations are relative to the distance between lower border of layer 6 (0%) and pia (100%). B, Relative peak amplitude and relative charge of fractional input from layer 4 (L4) to SPNs correlate. The relative amplitude (charge) is calculated by summing the amplitude (charge) of each PSC at each stimulation site in layer 4 that gave rise to a PSC divided by the total amplitude (charge) the cell received from all stimulation sites. SP, Subplate. C, CDF of the charge from layer 4 that the SPNs in each group receive at the different holding potentials (left, −70 mV; middle, +40 mV; right, silent). The bottom row shows the p values between the different groups (rank-sum test). D, CDF of the total area of input from layer 4 at the different holding potentials (left, −70 mV; middle, +40 mV; right, silent) and p values (bottom).
Figure 7.

The four groups of SPNs show differences in layer 5/6 input. A, CDF of the charge from layer 5/6 that the SPNs in each group receive at the different holding potentials (left, −70 mV; middle, +40 mV; right, silent) and p values (bottom). B, CDF of the total area of input from layer 5/6 at the different holding potentials (left, −70 mV; middle, +40 mV; right, silent) and p values (bottom). L5/6, Layer 5/6.
Figure 8.

The four groups of SPNs show differences in intra-subplate input. A, CDF of the charge from subplate that the SPNs in each group receive at the different holding potentials (left, −70 mV; middle, +40 mV; right, silent) and the p values between groups (bottom). B, CDF of the total area of input from at the different holding potentials (left, −70 mV; middle, +40 mV; right, silent) and the p values between groups (bottom).
The distribution of SPNs changes over development
Because the spatial distribution of cortical cells that synapse onto SPNs changes over development (Viswanathan et al., 2012), we plotted the relative proportion of SPNs in each group over the course of development (Fig. 9A). In particular, we find that few cells receive AMPAR-mediated inputs at young ages (groups 3 and 4) from extended columnar regions. However, we find that some cells that receive silent synapses from layer 4 (groups 1 and 2) are present at young ages. This indicates that SPNs receive feedback input from the overlying cortical plate at young ages, in this case here in A1 at P3. Moreover, the relative proportions of the cell groups changes with age. The percentage of group 2 cells that receive narrow inputs from superficial layers significantly decreases with age, whereas the percentage of group 4 cells that receive broad AMPAR-mediated inputs from layer 4 increases. Moreover, most group 4 cells have silent synapses only within deep layers, consistent with the decrease of silent synapses from superficial layers with age (Fig. 3). Together, these results indicate that, at young ages, SPNs receive feedback input from the overlying cortical plate via silent synapses and that cortical connections to SPNs changes with developmental.
Figure 9.
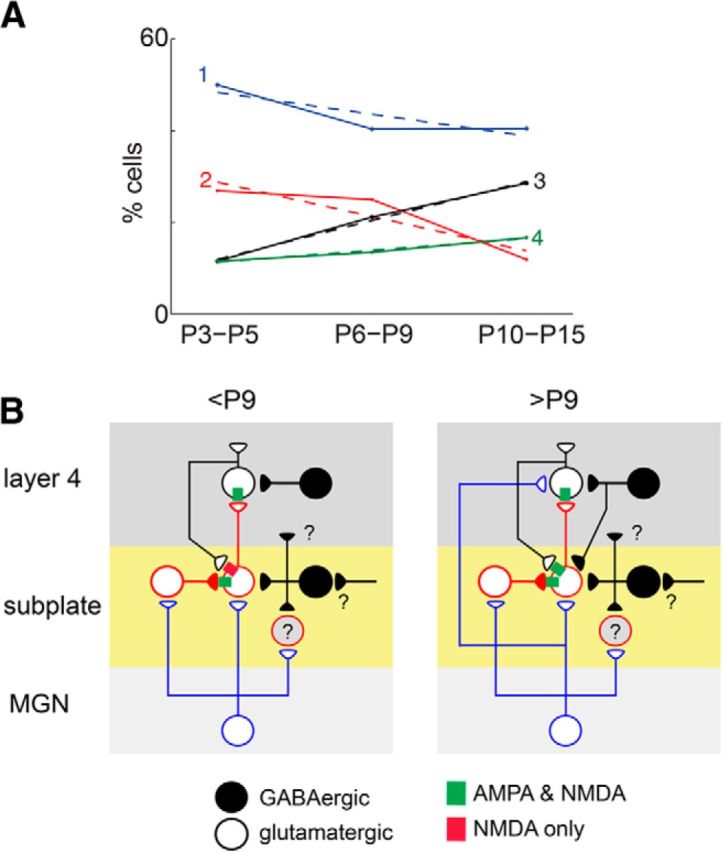
The relative population of SPNs changes over development. A, Fraction of SPNs in each of the groups identified in Figure 4 as a function of age. Dashed lines indicate linear regression and show changes with age (all p values <0.005). B, Model diagram summarizing the changing subplate circuit. Excitatory SPNs receive input from the medial geniculate nucleus (MGN), whereas inhibitory SPNs do not receive inputs from MGN but from other unknown sources (“?”). Excitatory SPNs project to layer 4 and to other SPNs, whereas the projection targets of inhibitory SPNs are unknown. At young ages, SPNs receive excitatory NMDA-only connections from layer 4. In the second postnatal week, superficial SPNs start to receive AMPAR-mediated and inhibitory feedback connections from layer 4, whereas deep SPNs do not (Viswanathan et al., 2012).
Discussion
Our results reveal that SPNs receive excitatory inputs from the developing cortex via both AMPAR-mediated synapses and exclusively NMDAR-mediated (silent) synapses. We found that the presynaptic sources of silent synapses tended to be at larger spatial distances from the SPN soma. We also observed that SPNs receive inputs from layer 4 through silent synapses at young ages before extensive AMPAR-mediated connections from layer 4 are present. SPNs as a population showed heterogeneity with respect to the spatial distribution of synaptic inputs. We find that the spatial distribution of cortical inputs to SPNs fell into four broad categories. This is consistent with previous observations of a large morphological and molecular diversity of SPNs (Hoerder-Suabedissen et al., 2009; Kanold and Luhmann, 2010). Our results show that the relative amplitude and spatial distribution of silent synapses change over development. This suggests a synaptic remodeling of cortical input to SPNs and that the way cortical plate neurons and SPNs interact changes with development.
It is well established that, during development of glutamatergic synapses, there is a time window when synapses do not contain AMPARs but only NMDARs; these synapses are thought of as “silent” (Malenka and Nicoll, 1997; Hanse et al., 2013). In general, the abundance of silent synapses in cells decreases over development and in the cerebral cortex follows a laminar maturational gradient (Rumpel et al., 2004). Moreover, at least in layer 2/3, there seems to be a transient period of high abundance of silent synapses (Rumpel et al., 2004). Because silent synapses can be functionally active if a cell is depolarized, these synapses can potentially signal information based on the state of the postsynaptic cell. A distinct pattern of silent synapses has also been observed in layer 5 neurons (Anastasiades and Butt, 2012), indicating that the origin of the presynaptic input might be important in determining which synapses are silent and which are not. Thus, the mechanisms of connecting distant inputs via silent synapses might be a universal principle of the developing cerebral cortex.
Our data show that SPNs receive a more extensive cortical input via silent synapses at young ages than has been appreciated previously when looking at AMPAR-mediated synapses (Viswanathan et al., 2012). Thus, there is a transient period in development when early cortical activity could influence SPNs depending on the activation state of SPNs (summarized in Fig. 9B). Because SPNs receive thalamic input from the earliest ages on (Zhao et al., 2009), SPNs are in a key position to integrate ascending peripherally generated activity with activity patterns endogenous to the cerebral cortex (Garaschuk et al., 2000; Khazipov and Luhmann, 2006; Kotak et al., 2012). This integrative role of SPNs is consistent with ablation studies showing that disruption of SPNs abolishes both sensory input-driven and spontaneous oscillatory activity in the cortex (Tolner et al., 2012). The presence of silent synapses from the cortical plate at young ages when few SPNs receive AMPAR-mediated input from the cortical plate also indicates that SPNs can integrate endogenous cortical activity patterns with ascending activity from the thalamus. Thus, when an area of cortex becomes spontaneously active while thalamic activity activates SPNs, silent synapses will become active. This interaction might contribute to the formation of the topographic organization of the cortex, consistent with the disruption of the cortical topographic organization when SPNs have been removed (Ghosh and Shatz, 1992; Kanold et al., 2003; Kanold and Luhmann, 2010; Tolner et al., 2012).
Our results show that SPNs at young ages have silent synapses from cells at distant locations. Because developing SPNs might have a slightly depolarized resting potential (Zhao et al., 2009), NMDAR-mediated synapses can potentially be activated at rest. However, because of the high membrane resistance of developing neurons, the amount of depolarization at rest might be overestimated (Tyzio et al., 2003). A high input resistance and the resulting large membrane time constant will also allow weak AMPAR-mediated inputs to depolarize SPNs to integrate silent NMDAR-mediated inputs. Thus, the cortical inputs could potentially have a functional influence on SPNs even if they signal via silent synapses. Therefore, at young ages, distant cortical neurons can influence the activity of SPNs if SPNs are active or receive AMPAR-mediated input from other sources but potentially also in the resting state. Moreover, because cortical neurons can show state-dependent fluctuations in their resting potential, silent synapses can enable SPNs to integrate inputs from farther away in a state-dependent manner. Our observation that silent synapses in SPNs exist at the oldest ages tested (P15) indicates that such state-dependent signaling might be a permanent feature of SPN circuits, at least up to P15.
Our work shows that SPNs over development can be separated into four groups based on their combined columnar and laminar excitatory synaptic input pattern. Thus, distinct subpopulations of SPNs exist. Two of these populations (groups 2 and 4) receive AMPAR-mediated inputs from the cortical plate, whereas the two others (groups 1 and 3) do not. Interestingly, both groups 1 and 2 are characterized by a relatively narrow range of columnar inputs, whereas groups 3 and 4 receive inputs from a wider columnar range (Fig. 5). Thus, initially SPNs integrate input from a local columnar area and over development receive inputs from cells farther away. Given that in older animals the columnar extent from which SPNs receive input ranges to ∼900 μm and that the rostrocaudal extent of A1 in the adult mouse is ∼1–1.5 mm (Stiebler et al., 1997), SPNs receive inputs from almost all of A1.
We identified simulation sites providing NMDAR-only (silent) synapses as sites evoking no responses at −70 mV but evoking responses at +40 mV. Because it is possible that at each site multiple neurons are activated that signal to the recorded SPN via either silent or AMPAR-mediated synapses, our analysis likely underestimates the fraction of silent synapses present between individual neurons. Because we here analyze both AMPA and NMDA inputs to SPNs, we blocked GABAAR-mediated signaling, which can contribute to changes in the excitability of the slice. To prevent overexcitability, we mapped in a solution that decreased excitability through increased Mg2+, reducing NMDAR activation such that our spatial activation profiles were similar to our previous studies (Viswanathan et al., 2012). However, compared with our previous study (Viswanathan et al., 2012), because of potential effects of the applied drugs on presynaptic terminals, we might have a slightly reduced synaptic release from cortical neurons, which might lead to smaller synaptic input maps and an underestimation of connectivity. Together, these methodological considerations suggest that our results are at a lower bound for the fraction of silent synapses at each age.
Our observation that the spatial pattern of silent synapses is distinct from that of AMPAR-mediated synapses raises multiple questions. First, we are revealing the spatial location of the presynaptic cell. Thus, the nature of the synapse seems to be determined by the distance of the presynaptic cell from the postsynaptic SPN. We do not yet know how synaptic inputs from multiple sources segregate on the dendrites of SPNs. If these inputs are intermingled, our results would indicate that silent and nonsilent synapses could exist in close spatial proximity to the postsynaptic neurons and thus must be regulated very closely. The alternative scenario is that silent and nonsilent synapses are also spatially segregated on the dendrites of the postsynaptic cell; therefore, a gradient of silent synapses might exist. Because dendrites grow outward from the soma, it is possible that the farther-most locations contain silent synapses and as such are connected to the presynaptic cells that are farthest away. Our data to date do not allow us to distinguish between these scenarios.
Together, our data show that SPNs perform complex changing integrative functions throughout the prenatal and neonatal period. This places SPNs in a key position in the developing thalamocortical pathway consistent with their demonstrated role in thalamocortical maturation and patterning.
Footnotes
This work was supported by National Institutes of Health Grants R01DC009607 (P.O.K.) and R01 GM056481 (J.P.Y.K.). We thank Dan Nagode, Krystyna Orzechowsky, Dan Winkowski, and Paul Watkins for comments on this manuscript.
References
- Anastasiades PG, Butt SJ. A role for silent synapses in the development of the pathway from layer 2/3 to 5 pyramidal cells in the neocortex. J Neurosci. 2012;32:13085–13099. doi: 10.1523/JNEUROSCI.1262-12.2012. [DOI] [PMC free article] [PubMed] [Google Scholar]
- Garaschuk O, Linn J, Eilers J, Konnerth A. Large-scale oscillatory calcium waves in the immature cortex. Nat Neurosci. 2000;3:452–459. doi: 10.1038/74823. [DOI] [PubMed] [Google Scholar]
- Ghosh A, Shatz CJ. Involvement of subplate neurons in the formation of ocular dominance columns. Science. 1992;255:1441–1443. doi: 10.1126/science.1542795. [DOI] [PubMed] [Google Scholar]
- Hanse E, Seth H, Riebe I. AMPA-silent synapses in brain development and pathology. Nat Rev Neurosci. 2013;14:839–850. doi: 10.1038/nrn3642. [DOI] [PubMed] [Google Scholar]
- Hoerder-Suabedissen A, Wang WZ, Lee S, Davies KE, Goffinet AM, Rakić S, Parnavelas J, Reim K, Nicolić M, Paulsen O, Molnár Z. Novel markers reveal subpopulations of subplate neurons in the murine cerebral cortex. Cereb Cortex. 2009;19:1738–1750. doi: 10.1093/cercor/bhn195. [DOI] [PubMed] [Google Scholar]
- Kanold PO, Luhmann HJ. The subplate and early cortical circuits. Annu Rev Neurosci. 2010;33:23–48. doi: 10.1146/annurev-neuro-060909-153244. [DOI] [PubMed] [Google Scholar]
- Kanold PO, Kara P, Reid RC, Shatz CJ. Role of subplate neurons in functional maturation of visual cortical columns. Science. 2003;301:521–525. doi: 10.1126/science.1084152. [DOI] [PubMed] [Google Scholar]
- Kao JPY. Caged molecules: principles and practical considerations. In: Gerfen C, Gerfen CR, Rogawski MA, Sibley DR, Skolnick P, Wray S, editors. Current protocols in neuroscience, Unit 6.20. Hoboken, NJ: Wiley; 2006. [DOI] [PubMed] [Google Scholar]
- Khazipov R, Luhmann HJ. Early patterns of electrical activity in the developing cerebral cortex of humans and rodents. Trends Neurosci. 2006;29:414–418. doi: 10.1016/j.tins.2006.05.007. [DOI] [PubMed] [Google Scholar]
- Kotak VC, Péndola LM, Rodríguez-Contreras A. Spontaneous activity in the developing gerbil auditory cortex in vivo involves GABAergic transmission. Neuroscience. 2012;226:130–144. doi: 10.1016/j.neuroscience.2012.09.008. [DOI] [PMC free article] [PubMed] [Google Scholar]
- Malenka RC, Nicoll RA. Silent synapses speak up. Neuron. 1997;19:473–476. doi: 10.1016/S0896-6273(00)80362-1. [DOI] [PubMed] [Google Scholar]
- Rumpel S, Kattenstroth G, Gottmann K. Silent synapses in the immature visual cortex: layer-specific developmental regulation. J Neurophysiol. 2004;91:1097–1101. doi: 10.1152/jn.00443.2003. [DOI] [PubMed] [Google Scholar]
- Shnerson A, Pujol R. Development: anatomy electrophysiology and behavior. In: Willot J, editor. The auditory psychobiology of the mouse. Springfield. IL: Thomas; 1983. pp. 395–425. [Google Scholar]
- Stiebler I, Neulist R, Fichtel I, Ehret G. The auditory cortex of the house mouse: left-right differences, tonotopic organization and quantitative analysis of frequency representation. J Comp Physiol A Neuroethol Sens Neural Behav Physiol. 1997;181:559–571. doi: 10.1007/s003590050140. [DOI] [PubMed] [Google Scholar]
- Suter BA, O'Connor T, Iyer V, Petreanu LT, Hooks BM, Kiritani T, Svoboda K, Shepherd GM. Ephus: multipurpose data acquisition software for neuroscience experiments. Front Neural Circuits. 2010;4:100. doi: 10.3389/fncir.2010.00100. [DOI] [PMC free article] [PubMed] [Google Scholar]
- Tolner EA, Sheikh A, Yukin AY, Kaila K, Kanold PO. Subplate neurons promote spindle bursts and thalamocortical patterning in the neonatal rat somatosensory cortex. J Neurosci. 2012;32:692–702. doi: 10.1523/JNEUROSCI.1538-11.2012. [DOI] [PMC free article] [PubMed] [Google Scholar]
- Tyzio R, Ivanov A, Bernard C, Holmes GL, Ben-Ari Y, Khazipov R. Membrane potential of CA3 hippocampal pyramidal cells during postnatal development. J Neurophysiol. 2003;90:2964–2972. doi: 10.1152/jn.00172.2003. [DOI] [PubMed] [Google Scholar]
- Viswanathan S, Bandyopadhyay S, Kao JP, Kanold PO. Changing microcircuits in the subplate of the developing cortex. J Neurosci. 2012;32:1589–1601. doi: 10.1523/JNEUROSCI.4748-11.2012. [DOI] [PMC free article] [PubMed] [Google Scholar]
- Zhao C, Kao JP, Kanold PO. Functional excitatory microcircuits in neonatal cortex connect thalamus and layer 4. J Neurosci. 2009;29:15479–15488. doi: 10.1523/JNEUROSCI.4471-09.2009. [DOI] [PMC free article] [PubMed] [Google Scholar]