Abstract
Choline is a small molecule that occupies a key position in the biochemistry of all living organisms. Recent studies have strongly implicated choline metabolites in cancer, atherosclerosis and nervous system development. To detect choline and its metabolites, existing physical methods such as magnetic resonance spectroscopy and positron emission tomography, are often limited by the poor spatial resolution and substantial radiation dose. Fluorescence imaging, although with submicrometer resolution, requires introduction of bulky fluorophores and thus is difficult in labeling the small choline molecule. By combining the emerging bond-selective stimulated Raman scattering microscopy with metabolic incorporation of deuterated choline, herein we have achieved high resolution imaging of choline-containing metabolites in living mammalian cell lines, primary hippocampal neurons and multicellular organism C. elegans. Different subcellular distributions of choline metabolites are observed between cancer cells and non-cancer cells, which may reveal functional difference in the choline metabolism and lipid-mediated signaling events. In neurons, choline incorporation is visualized within both soma and neurites, where choline metabolites are more evenly distributed compared to the protein. Furthermore, choline localization is also observed in the pharynx region of C. elegans larvae, consistent with its organogenesis mechanism. These applications demonstrate the potential of isotope-based stimulated Raman scattering microscopy for future choline-related disease detection and development monitoring in vivo.
Introduction
Choline metabolism performs critical roles in biological function of all living organisms. It is involved in various vital processes such as cell membrane formation, signaling, lipid transport, neurotransmitter acetylcholine synthesis and methyl transfer reaction.1 Important choline-containing metabolites include small molecule phosphocholine (PC), glycerophosphocholine (GPC), lipid-bound phosphatidylcholine (PtC) and sphingomyelin (SM).
Choline metabolites have been discovered to be important in oncogenesis,2 cardiovascular disease,3 and embryonic nervous system development.1 Recently, abnormal choline metabolism has emerged as a metabolic hallmark in cancer malignant transformation. Diffusive choline-containing metabolites level (including free choline, PC and GPC) has been found to be 2–20 folds higher in tumor compared to normal tissues, particularly in breast, brain and prostate cancers.2 Elevated level of choline metabolites in cancer has not only been attributed to the fast cell proliferation rate, but also indicated the aggressiveness of tumor development.4–6 In addition, the development of atherosclerosis has been associated with choline and its metabolites, the level of which can be used to predict risk for cardiovascular disease.3 Furthermore, as an essential nutrient for higher organisms including human, sufficient uptake of choline through diet is required for the maintenance of health.1 Especially during pregnancy and lactation, highest amount of choline-containing compounds are present in the utero and fetus plasma, indicating the crucial role of choline in embryonic development.7 It has been found that rodents supplemented with 0.5 wt.% choline diet during latter days of gestation when the memory center begins to develop, produce offspring with life-long enhanced memory and hippocampal plasticity,8 and choline deficiency in pregnant rodents results in altered blood vessel formation in fetal mouse hippocampus,9 impaired sensory inhibition10 and cognitive deficits.11
Therefore, the ability to monitor choline and its metabolites during diseases and embryogenesis will be highly desired. Conventionally, choline metabolites have been studied with 1H and 31P magnetic resonance spectroscopy (MRS), positron emission tomography (PET) using 11C-choline12 and liquid chromatography tandem mass spectrometry (LC-MS).3, 13 Current MRS and PET techniques, however, are hindered by the poor spatial resolution and significant radiation exposure, and mass spectrometry cannot achieve non-destructive imaging. Optical microscopy, with its superior spatial-temporal resolution and noninvasive nature, shows great advantages in biochemical imaging at subcellular level.14 In particular, fluorescence microscopy is one of the most widely used optical imaging techniques. However, the requirement of a large conjugation system for light absorption in the visible range limits its utility in detecting small molecules, which can be easily perturbed by the attachment of bulky fluorophores. Indirect labeling approach, such as bioorthogonal tagging through click chemistry, has been developed recently to allow the study of a wide range of small molecules.15, 16 Unfortunately, this technique generally requires non-physiological cell fixation and the use of toxic catalysts for dye staining, thus not compatible with live cell imaging. Hence, direct visualization of small choline-containing molecules through vibrational contrasts of either intrinsic or exogenous chemical bonds becomes a promising approach.
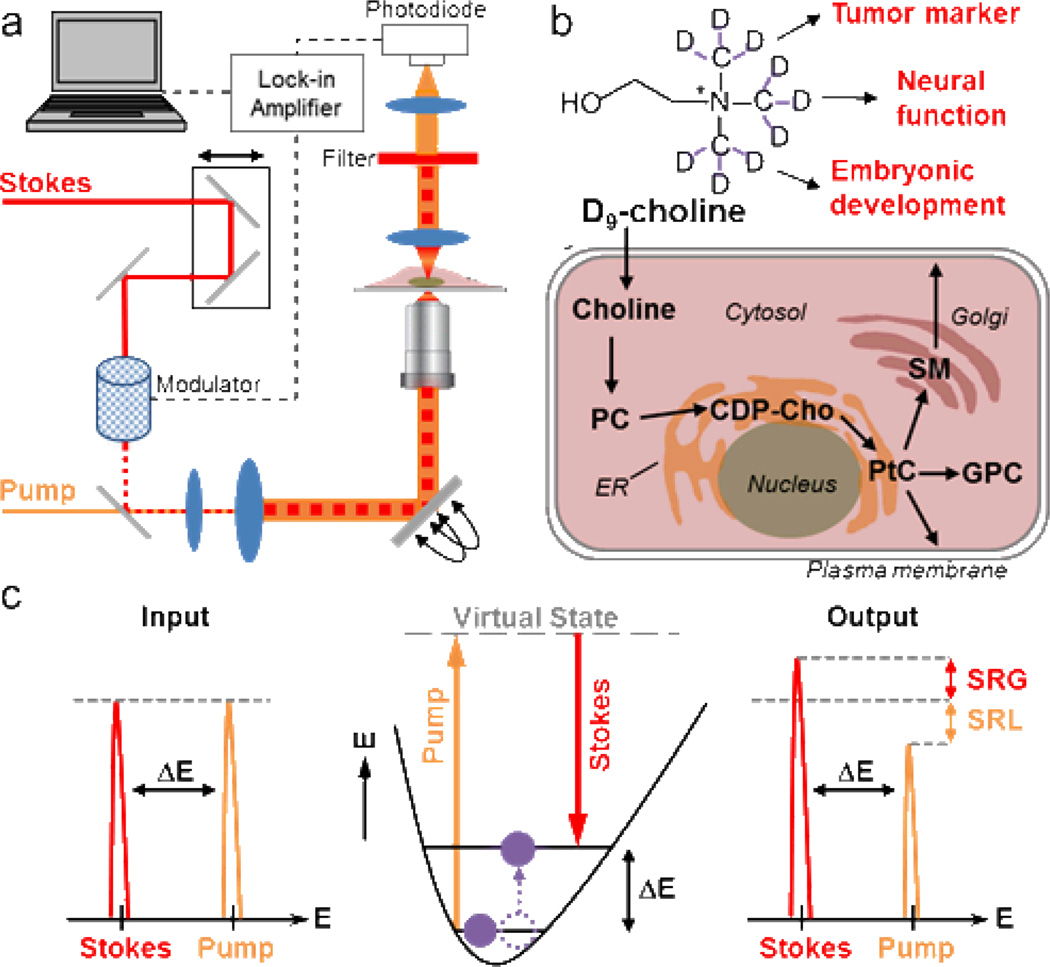
Here we report non-invasive in vivo imaging of choline-containing metabolites with subcellular resolution by stimulated Raman scattering (SRS) microscopy (Figure 1a), through metabolic incorporation of deuterated (trimethyl-D9)-choline. Once uptaken by cells, choline is mainly metabolized through the Kennedy pathway into small molecules PC, GPC and membrane-bound choline phospholipids (Figure 1b). Activated choline metabolism in tumor and high consumption of choline during prenatal development will lead to active uptake of D9-choline incorporated into the total pool of choline metabolites in a dynamic equilibrium, which serves as a distinct biomarker for cancer, neural function and embryonic development.
Figure 1.
Stimulated Raman scattering (SRS) imaging of choline metabolites through metabolic incorporation of deuterated D9-choline. (a) Set up of SRS microscope. Spatially and temporally overlapped Stokes and pump beams lead to selective vibrational activation within the sample under the resonant condition. (b) Incorporation of D9-choline in the cellular pool of choline metabolites serves as a metabolic biomarker in tumor progression, brain function and embryonic development. (c) Energy diagram together with the input and output laser spectra of SRS.
As an emerging nonlinear vibrational imaging technique, SRS microscopy has achieved high resolution chemical imaging in many biological systems with excellent sensitivity.17–22 By employing an additional near-infrared Stokes beam, vibrational transition which matches with the energy difference ΔE between the pump and Stokes photons is selectively stimulated (Figure 1c) via quantum amplification with an effective Raman cross section 107 greater than that of spontaneous Raman scattering.23 The accompanied stimulated Raman loss (SRL) signal of the transmitted pump beam or the stimulated Raman gain (SRG) of the transmitted Stokes beam can be detected sensitively by a high-frequency modulation scheme through a lock-in amplifier. Thus, high-speed imaging up to video rate can be achieved, which is orders of magnitudes faster than spontaneous Raman imaging. Compared with another popular nonlinear Raman technique, coherent anti-Stokes Raman scattering (CARS), SRS signal has little non-resonant background, well preserved Raman spectra, straightforward image interpretation and linear concentration dependence, allowing for unambiguous image visualization and quantification based on pure chemical contrast.24 When coupled with the strategy of stable isotope labeling, high-resolution SRS imaging of choline metabolites in several mammalian cell lines, primary neurons, and multicellular organism C. elegans will be demonstrated in this study.
Results and discussion
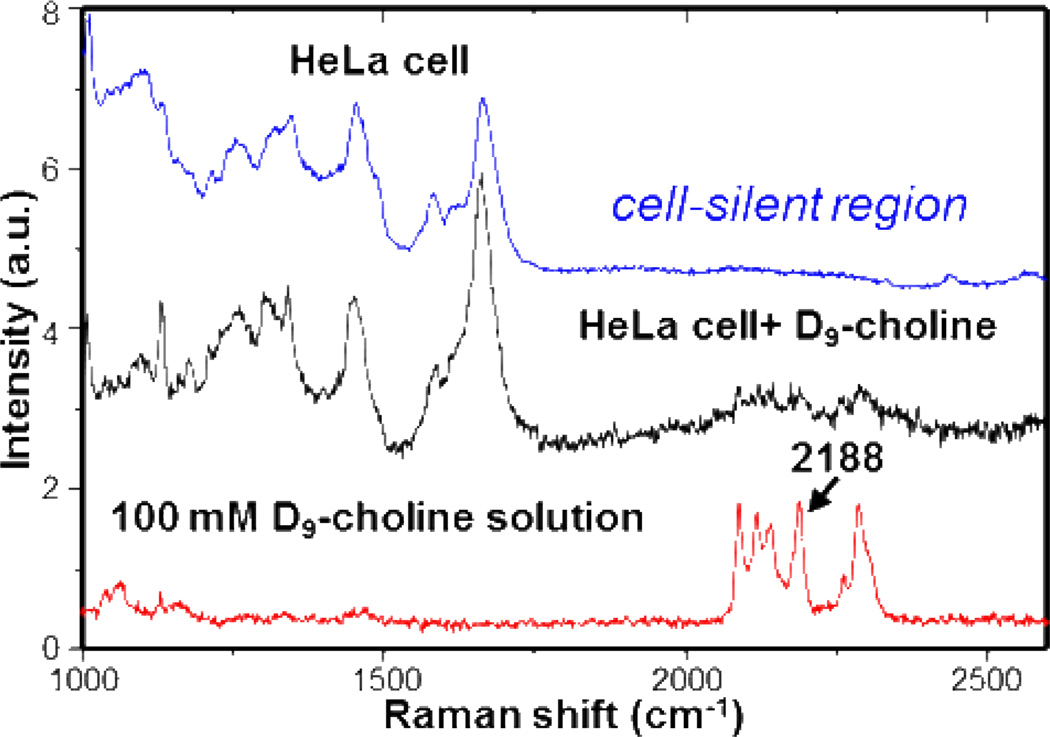
With all methyl groups of choline substituted with deuterium atoms, D9-choline-containing metabolites can be detected inside cells with high sensitivity and specificity in a background-free manner. First, characteristic C-D vibrational peaks around 2100 cm−1 arise in the cell-silent Raman window ranging from 1900 to 2700 cm−1 (Figure 2), where five major peaks are observed at 2089, 2118, 2141, 2188 and 2285 cm−1. Second, the methyl C-D stretching frequencies are expected to be sensitive to the chemical environment. Local environmental sensitivity of vibrational frequency has been well investigated, with nitrile and carbonyl groups being successfully used as vibrational probes for local electric fields inside proteins.25–27 When compared with Raman spectra of D3-methionine and D10-leucine (Figure S1), even though they all have CD3 groups, C-D bonds of D9-choline vibrate at frequencies distinct from the other two molecules, partly due to the positive charge on the nearby nitrogen atom. This allows for selective imaging of molecules only containing trimethyl-D9 moiety derived from D9-choline. Such spectral selectivity is especially beneficial since choline methyl groups could be transferred to methionine, which acts as a common methyl source in cells. Third, other forms of C-D vibration are negligible, because methyl groups of choline stay mostly intact along its metabolic pathways, as in both the Kennedy pathway and methyl-transfer pathway. The 2188 cm−1 peak of D9-choline is thus chosen for our SRS imaging due to its highest intensity and clear separation in the spectrum. Fourth, with a nearly indistinguishable structure to the natural choline and minimal biochemical perturbation to cells, D9-choline coupled with SRS is particularly suitable for in vivo imaging of choline metabolites during diseases and embryonic development.
Figure 2.
Spontaneous Raman spectra of HeLa cells supplemented with (black) and without (blue) D9-choline and 100 mM D9-choline (red) in phosphate buffered saline (PBS) solution. The 2188 cm−1 peak within the cell-silent Raman region is chosen for SRS imaging.
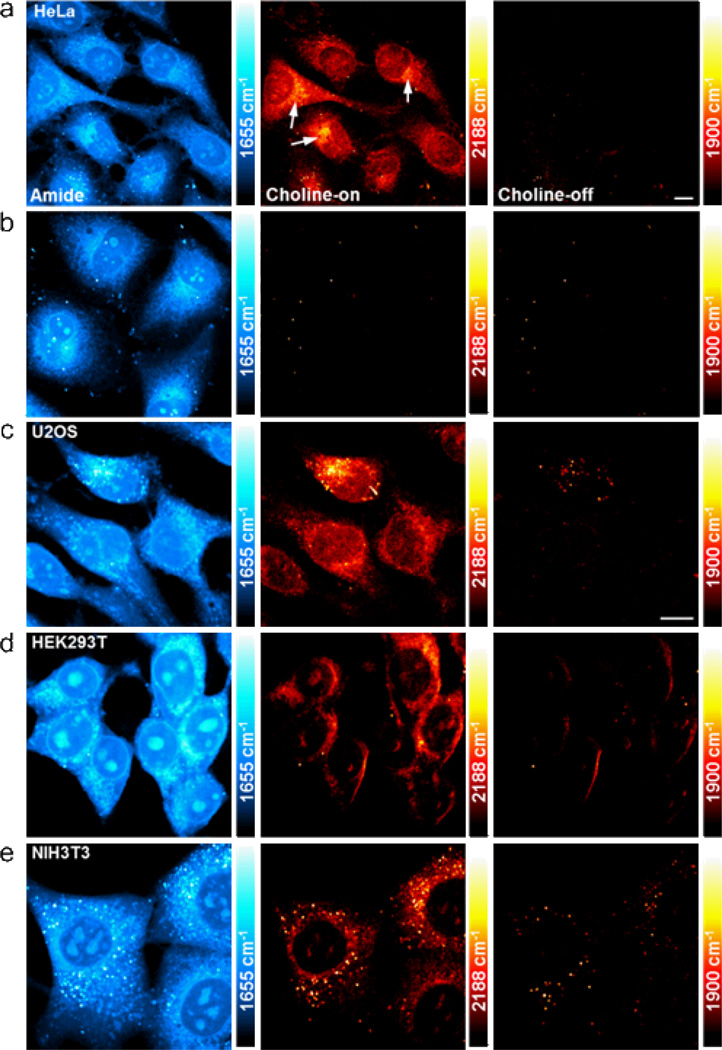
Live cell imaging of D9-choline metabolites is first demonstrated with SRS in the human cervical cancer HeLa cell line. Indeed, spontaneous Raman spectrum of HeLa cells supplemented with 10 mM D9-choline for 48 hours exhibits the same pattern of Raman peaks in the cell-silent region as for the D9-choline in PBS solution (Figure 2), verifying the cellular uptake of D9-choline. Based on the Raman intensity (Figure 2, black and red spectra), average intracellular D9-choline-containing metabolites are estimated to be ~20 mM after 48 hours incorporation. We also correlated the SRS intensity at 2188 cm−1 with D9-choline PBS solutions at different concentrations (Figure S2). This corresponds to a concentration range from 0 to 78.7 mM for the color bars of D9-choline images. The SRS image (Figure 3a) of the amide channel at 1655 cm−1 shows a high protein concentration outside the nucleus and in the nucleoli. When tuning into 2188 cm−1, the choline-on SRS image depicts the total pool of D9-choline-containing metabolites including free choline, PC, GPC, phospholipid-bound choline PtC and SM. The choline signal distributes over the whole cell and is especially pronounced in regions surrounding the nucleus, likely from endoplasmic reticulum and Golgi apparatus. This observation is consistent with the intracellular choline metabolic pathway, where choline phospholipid metabolites are synthesized both in cytosol and on the surface of nucleus and intracellular organelles, and are incorporated into membrane structure afterwards.28, 29 In the choline-off SRS image taken at 1900 cm−1, where no Raman transition occurs, an almost completely dark image is acquired, confirming the background-free detection of SRS microscopy. In the control HeLa cells cultured without D9-choline (Figure 3b), no signal is detected in both the choline-on and choline-off channels under the same image acquisition condition, proving that the signal observed in Figure 3a is indeed from the metabolite pool containing D9-choline.
Figure 3.
SRS images of D9-choline-containing metabolites in different cancer (a–c) and embryonic (d–e) cell lines. (a) 2188 cm−1 image of D9-choline metabolites (choline-on) in live HeLa cells cultured with 10 mM D9-choline for 48 hours. Strong signal is seen at regions around nucleus (indicated by arrows), such as endoplasmic reticulum. (b) 2188 cm−1 choline-on image in live HeLa cells cultured in medium without D9-choline. (c–e) 2188 cm−1 choline-on images in live human bone osteosarcoma U2OS cells (c), live human embryonic kidney HEK293T cells (d), and live mouse embryonic fibroblast NIH3T3 cells (e) cultured with 5 or 10 mM D9-choline for 48 hours. The 1655 cm−1 (amide I from protein) and the 1900 cm−1 (choline-off) images display the same set of cells as in the choline-on images. The choline-on and choline-off channels are imaged under identical experimental condition. The color scale in the amide channel is 3 times larger than other channels. The color bars in the choline channels correspond to a D9-choline concentration range from 0 at the darkest to 78.7 mM at the brightest. Scale bar: 10 µm.
To verify the enrichment of D9-choline into the total choline metabolite pool, particularly the downstream choline phospholipids, we subjected the immobile part of SRS choline signal retained after fixation to phospholipase assays. In fixed cells incubated with phospholipase C, choline phosphate headgroups are cleaved from phospholipids under Ca2+ catalysis and little signal can be observed in the choline-on channel, similar to the choline-off channel (Figure S3b), whereas the signal mostly remains when no phospholipase is present (Figure S3a) or EDTA is added to chelate the Ca2+ ion (Figure S3c). This confirms the incorporation of D9-choline in the downstream phospholipids PtC and SM, and therefore the total pool of choline metabolites. Compared with previously reported method to image membrane choline phospholipids through bioorthogonal fluorescent labeling,30 the direct SRS imaging here is free from cell fixation, dye-staining and extensive washing. Thus our approach not only is compatible with live cell imaging but also avoids the loss of the important diffusive choline-containing species and membrane surface phospholipids during the fixation and staining processes, thus providing a comprehensive and accurate picture of choline-containing metabolites inside cells.
Motivated by the importance of choline metabolism in both oncogenesis and embryonic development, we then studied the D9-choline incorporation (as well as their possible difference) in other cancer and embryonic cell lines. In human bone osteosarcoma U2OS cell line (Figure 3c), cells incubated with 10 mM D9-choline for 48 hours again show a strong D9-choline metabolites signal around the nucleus while protein in the amide channel is distributed more homogeneously in the whole cell. The signal in the choline-on channel resembles that in the HeLa cells (Figure 3a). The choline-off channel is still mostly dark as expected. Depending on the cell morphology and orientation, some residual signal exists at the boundaries of membrane and lipid droplets, due to the cross-phase modulation of laser beams at the interface of different refractive indices.31 To gain insights into embryonic development, choline metabolites in human embryonic kidney cells HEK 293T (Figure 3d) and mouse embryonic fibroblast cells NIH 3T3 (Figure 3e) were also imaged. While protein are similarly distributed throughout the cell and enriched inside the nucleoli, indicating active ribosomal biogenesis,32, 33 SRS signals of choline-containing metabolites from both embryonic cells are mostly detected in the cytoplasm with nearly vanishing signal inside the nucleus. Such significant difference in the intranuclear signal between cancer cells (HeLa and U2OS) and non-cancer cells (HEK293T and NIT3T3) suggests elevated choline metabolites level inside the nucleus of cancer cells, possibly due to an up-regulated choline metabolism that leads to altered endonuclear lipid-mediated signaling events in cancer.34 This is hard to visualize by click-chemistry based fluorescence imaging due to low nuclear permeability of fluorophores and the loss of small molecules during fixation.
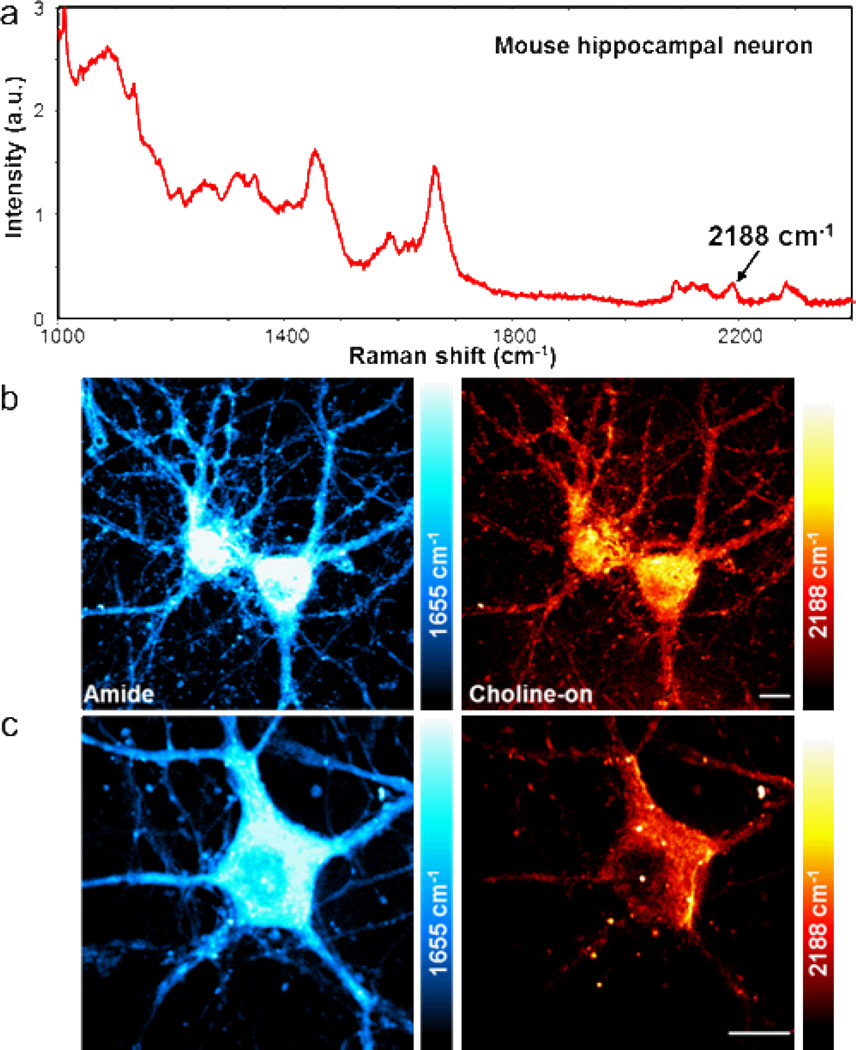
To demonstrate the general applicability of our approach in neuronal system, we cultured primary mouse hippocampal neurons with 10 mM D9-choline for 48 hours. In the spontaneous Raman spectrum (Figure 4a), a similar D9-choline spectral pattern was measured with higher intensity (approximately a factor of two) than that in HeLa cells, which confirms the successful uptake of D9-choline into neurons and is in agreement with the high content of lipids in neuronal cells. In the SRS images (Figure 4b), the amide channel at 1655 cm−1 depicts the total protein distribution, which is concentrated inside the cell body with a much brighter signal than that at the neurites, whereas in the choline-on channel at 2188 cm−1, the network between neurons is clearly visible with a less pronounced difference in the D9-choline metabolites signal between the neurites and the soma. Since choline phospholipid metabolism occurs mainly inside the cell body, at the surface of nucleus and endoplasmic reticulum,28 the detected D9-choline signal at the neurites indicates newly assembled membrane with D9-choline incorporated PtC and SM which are transported from the soma. When zoomed in, subcellular distribution of D9-choline metabolites can be visualized within a single neuron (Figure 4c). In the amide channel, protein is distributed throughout the cell body and the nucleolus is visible with higher protein signal, while choline metabolites are mainly outside the nucleus.
Figure 4.
SRS imaging of D9-choline metabolites in primary mouse hippocampal neurons. (a) Spontaneous Raman spectrum of neuron cultured with 10 mM D9-choline for 48 hours. (b) 2188 cm−1 choline-on image clearly reveals the distribution of D9-choline-containing metabolites within the neural network. (c) Zoom-in image of a single neuron shows subcellular distribution of D9-choline metabolites. The amide images display the same set of cells as in the choline-on images. The color scale in the amide channel is 2 times larger than other channels. The color bars in the choline channels correspond to a D9-choline concentration range from 0 at the darkest to 78.7 mM at the brightest. Scale bar: 10 µm.
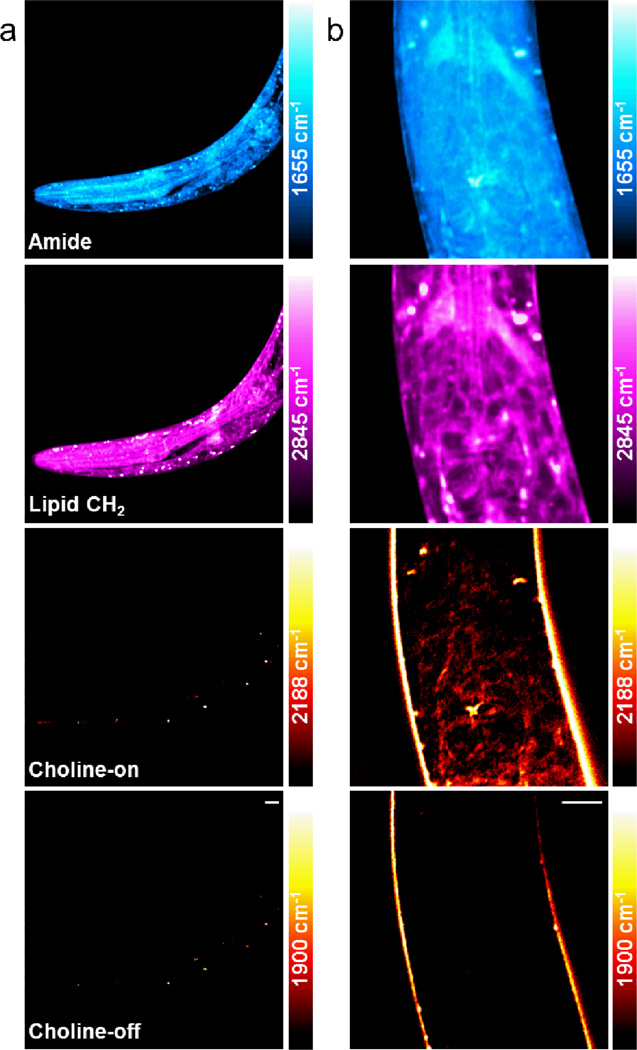
To further study the role of choline in embryonic development, we used Caenorhabditis elegans to visualize choline incorporation during embryonic and early larval development. This animal is widely used as a model organism in developmental biology, particularly for embryogenesis and organogenesis. 100 mM D9-choline PBS solution was microinjected into the gonad of wild-type young adult animals and newly hatched larvae were collected after one day for live imaging. We expected the diffusive D9-choline, which could be uptaken by the oocyte of adult worms as nutrients before the fertilization, to be metabolized and incorporated during the embryogenesis of C. elegans. As control, untreated C. elegans larva, progeny of the uninjected adults worm was first imaged (Figure 5a), where a dark background was observed in the choline-on channel at 2188 cm−1. The L1 larva produced by adult worm injected with D9-choline, however, showed significant signal at the pharynx region in the choline-on channel, mainly around the terminal bulb (Figure 5b). Interestingly, the distribution of this choline signal is resemblant to the pattern shown in the lipid CH2 channel at 2845 cm−1, which is located in the periphery of the cell with dark regions inside, indicating the incorporation of D9-choline into cell membrane structures. The choline-off channel is mostly clear with residual cross-phase modulation signal seen at the body surface of the worm. Our observation is consistent with the pharynx organogenesis process in C. elegans embryo, where pharynx develops through autonomous morphogenesis with only cell differentiation but not cell division,35 avoiding the dilution of D9-choline. The distribution of the protein signal in the amide channel, on the other hand, is more homogeneous throughout the whole worm body with less defined cellular structures, in contrast to that in both the lipid CH2 and choline-on channels.
Figure 5.
SRS imaging of D9-choline incorporation in C. elegans larvae. (a) As control, live wild-type C. elegans larva without any treatment was imaged and a dark background was found in the 2188 cm−1 choline-on image. (b) 100 mM D9-choline was injected into the gonad of young adult animals and the live F1 larva was imaged at L1 stage. The 2188 cm−1 choline-on channel displays a similar signal pattern as in the lipid CH2 Channel at 2845 cm−1, suggesting the localization of D9-choline in the cell membrane. The amide, lipid CH2 and the choline-off channels display the same area as in the choline-on channel. The color scale in the amide channel is 6 times larger than the choline channels. The color bars in the choline channels correspond to a D9-choline concentration range from 0 at the darkest to 78.7 mM at the brightest. Scale bar: 5 µm.
Conclusions
In this article, we have successfully demonstrated live cell imaging of choline-containing metabolite pool (including free choline, PC, GPC, PtC and SM) in several cancer, embryonic cell lines, primary neurons and C. elegans larvae with subcellular resolution, by using stimulated Raman scattering coupled with isotope-labeled metabolic incorporation. Cancer cells were found to have significant distribution of choline metabolites inside the nucleus compared to non-cancer cells, which could influence endonuclear lipid-mediated signaling events. Choline incorporation in both the cell body and neuronal processes has been visualized in hippocampal neurons, where choline metabolites are more evenly distributed than the protein. In C. elegans larvae, choline-containing metabolites were localized in the pharynx region, which is consistent with its autonomous organogenesis process.
The ability to image choline metabolites in live cells and organisms with high resolution, as shown in this study, will prepare us to better study cancer malignant transformation and embryonic development in complex systems. Recently, D9-choline has been used as a metabolic tracer in human.36 With the excellent biocompatibility of stable isotope incorporation32 and SRS microscopy in living animals and humans,37 our approach of isotope-based nonlinear vibrational imaging would find future applications in choline-related disease diagnostics and treatment evaluation in vivo.
Supplementary Material
Acknowledgements
We thank M. Chalfie, Z. Chen and L. Zhang for stimulating discussions and Dr. Y. Shin for providing mouse hippocampal neurons. W. Min acknowledges support from NIH Director’s New Innovator Award.
Footnotes
The authors declare no competing financial interest.
Electronic Supplementary Information (ESI) available: detailed materials, methods and additional data. See DOI: 10.1039/b000000x/
Notes and References
- 1.Zeisel SH, da Costa KA. Nutr. Rev. 2009;67:615–623. doi: 10.1111/j.1753-4887.2009.00246.x. [DOI] [PMC free article] [PubMed] [Google Scholar]
- 2.Glunde K, Bhujwalla ZM, Ronen SM. Nat. Rev. Cancer. 2011;11:835–848. doi: 10.1038/nrc3162. [DOI] [PMC free article] [PubMed] [Google Scholar]
- 3.Wang Z, Klipfell E, Bennett BJ, Koeth R, Levison BS, Dugar B, Feldstein AE, Britt EB, Fu X, Chung YM, Wu Y, Schauer P, Smith JD, Allayee H, Tang WH, DiDonato JA, Lusis AJ, Hazen SL. Nature. 2011;472:57–63. doi: 10.1038/nature09922. [DOI] [PMC free article] [PubMed] [Google Scholar]
- 4.Aboagye EO, Bhujwalla ZM. Cancer Res. 1999;59:80–84. [PubMed] [Google Scholar]
- 5.Ackerstaff E, Pflug BR, Nelson JB, Bhujwalla ZM. Cancer Res. 2001;61:3599–3603. [PubMed] [Google Scholar]
- 6.Amstalden van Hove ER, Blackwell TR, Klinkert I, Eijkel GB, Heeren RM, Glunde K. Cancer Res. 2010;70:9012–9021. doi: 10.1158/0008-5472.CAN-10-0360. [DOI] [PMC free article] [PubMed] [Google Scholar]
- 7.Zeisel SH, Niculescu MD. Nutr. Rev. 2006;64:197–203. doi: 10.1111/j.1753-4887.2006.tb00202.x. [DOI] [PMC free article] [PubMed] [Google Scholar]
- 8.Glenn MJ, Kirby ED, Gibson EM, Wong-Goodrich SJ, Mellott TJ, Blusztajn JK, Williams CL. Brain Res. 2008;1237:110–123. doi: 10.1016/j.brainres.2008.08.049. [DOI] [PMC free article] [PubMed] [Google Scholar]
- 9.Mehedint MG, Craciunescu CN, Zeisel SH. Proc. Natl. Acad. Sci. U.S.A. 2010;107:12834–12839. doi: 10.1073/pnas.0914328107. [DOI] [PMC free article] [PubMed] [Google Scholar]
- 10.Stevens KE, Adams CE, Mellott TJ, Robbins E, Kisley MA. Brain Res. 2008;1237:84–90. doi: 10.1016/j.brainres.2008.08.047. [DOI] [PMC free article] [PubMed] [Google Scholar]
- 11.Meck WH, Williams CL. Neurosci. Biobehav. Rev. 2003;27:385–399. doi: 10.1016/s0149-7634(03)00069-1. [DOI] [PubMed] [Google Scholar]
- 12.Wehrl HF, Schwab J, Hasenbach K, Reischl G, Tabatabai G, Quintanilla-Martinez L, Jiru F, Chughtai K, Kiss A, Cay F, Bukala D, Heeren RM, Pichler BJ, Sauter AW. Cancer Res. 2013;73:1470–1480. doi: 10.1158/0008-5472.CAN-12-2532. [DOI] [PubMed] [Google Scholar]
- 13.Craciun S, Balskus EP. Proc. Natl. Acad. Sci. U.S.A. 2012;109:21307–21312. doi: 10.1073/pnas.1215689109. [DOI] [PMC free article] [PubMed] [Google Scholar]
- 14.Yuste R, editor. Imaging: A Laboratory Manual. Cold Spring Harbor Press; 2010. [Google Scholar]
- 15.Prescher JA, Bertozzi CR. Nat Chem Biol. 2005;1:13–21. doi: 10.1038/nchembio0605-13. [DOI] [PubMed] [Google Scholar]
- 16.Grammel M, Hang HC. Nat Chem Biol. 2013;9:475–484. doi: 10.1038/nchembio.1296. [DOI] [PMC free article] [PubMed] [Google Scholar]
- 17.Freudiger CW, Min W, Saar BG, Lu S, Holtom GR, He C, Tsai JC, Kang JX, Xie XS. Science. 2008;322:1857–1861. doi: 10.1126/science.1165758. [DOI] [PMC free article] [PubMed] [Google Scholar]
- 18.Nandakumar P, Kovalev A, Volkmer A. New J. Phys. 2009;11 [Google Scholar]
- 19.Zhang D, Slipchenko MN, Cheng JX. J. Phys. Chem. Lett. 2011;2:1248–1253. doi: 10.1021/jz200516n. [DOI] [PMC free article] [PubMed] [Google Scholar]
- 20.Wang MC, Min W, Freudiger CW, Ruvkun G, Xie XS. Nat. Methods. 2011;8:U135–U152. doi: 10.1038/nmeth.1556. [DOI] [PMC free article] [PubMed] [Google Scholar]
- 21.Suhalim JL, Boik JC, Tromberg BJ, Potma EO. J. Biophotonics. 2012;5:387–395. doi: 10.1002/jbio.201200002. [DOI] [PMC free article] [PubMed] [Google Scholar]
- 22.Ozeki Y, Umemura W, Otsuka Y, Satoh S, Hashimoto H, Sumimura K, Nishizawa N, Fukui K, Itoh K. Nat. Photonics. 2012;6:844–850. [Google Scholar]
- 23.Min W, Freudiger CW, Lu S, Xie XS. Annu. Rev. Phys. Chem. 2011;62:507–530. doi: 10.1146/annurev.physchem.012809.103512. [DOI] [PMC free article] [PubMed] [Google Scholar]
- 24.Min W. Curr. Opin. Chem. Biol. 2011;15:831–837. doi: 10.1016/j.cbpa.2011.10.005. [DOI] [PubMed] [Google Scholar]
- 25.Fafarman AT, Sigala PA, Schwans JP, Fenn TD, Herschlag D, Boxer SG. Proc. Natl. Acad. Sci. U.S.A. 2012;109:E299–E308. doi: 10.1073/pnas.1111566109. [DOI] [PMC free article] [PubMed] [Google Scholar]
- 26.Sigala PA, Fafarman AT, Schwans JP, Fried SD, Fenn TD, Caaveiro JM, Pybus B, Ringe D, Petsko GA, Boxer SG, Herschlag D. Proc. Natl. Acad. Sci. U.S.A. 2013;110:E2552–E2561. doi: 10.1073/pnas.1302191110. [DOI] [PMC free article] [PubMed] [Google Scholar]
- 27.Fried SD, Bagchi S, Boxer SG. J. Am. Chem. Soc. 2013;135:11181–11192. doi: 10.1021/ja403917z. [DOI] [PMC free article] [PubMed] [Google Scholar]
- 28.Farooqui AA, Horrocks LA, Farooqui T. Chem. Phys. lipids. 2000;106:1–29. doi: 10.1016/s0009-3084(00)00128-6. [DOI] [PubMed] [Google Scholar]
- 29.Cornell RB, Northwood IC. Trends Biochem. Sci. 2000;25:441–447. doi: 10.1016/s0968-0004(00)01625-x. [DOI] [PubMed] [Google Scholar]
- 30.Jao CY, Roth M, Welti R, Salic A. Proc. Natl. Acad. Sci. U.S.A. 2009;106:15332–15337. doi: 10.1073/pnas.0907864106. [DOI] [PMC free article] [PubMed] [Google Scholar]
- 31.Cheng J-X, Xie XS, editors. Coherent Raman Scattering Microscopy. CRC Press; 2012. [Google Scholar]
- 32.Wei L, Yu Y, Shen Y, Wang MC, Min W. Proc. Natl. Acad. Sci. U.S.A. 2013;110:11226–11231. doi: 10.1073/pnas.1303768110. [DOI] [PMC free article] [PubMed] [Google Scholar]
- 33.Andersen JS, Lam YW, Leung AK, Ong SE, Lyon CE, Lamond AI, Mann M. Nature. 2005;433:77–83. doi: 10.1038/nature03207. [DOI] [PubMed] [Google Scholar]
- 34.Hunt AN. J. Cell. Biochem. 2006;97:244–251. doi: 10.1002/jcb.20691. [DOI] [PubMed] [Google Scholar]
- 35.Pilon M, Morck C. Acta Pharmacol. Sin. 2005;26:396–404. doi: 10.1111/j.1745-7254.2005.00070.x. [DOI] [PubMed] [Google Scholar]
- 36.Yan J, Wang W, Gregory JF, 3rd, Malysheva O, Brenna JT, Stabler SP, Allen RH, Caudill MA. Am. J. Clin. Nutr. 2011;93:348–355. doi: 10.3945/ajcn.110.005975. [DOI] [PMC free article] [PubMed] [Google Scholar]
- 37.Saar BG, Freudiger CW, Reichman J, Stanley CM, Holtom GR, Xie XS. Science. 2010;330:1368–1370. doi: 10.1126/science.1197236. [DOI] [PMC free article] [PubMed] [Google Scholar]
Associated Data
This section collects any data citations, data availability statements, or supplementary materials included in this article.


