

Abstract
Background & objectives:
During the post influenza pandemic period, continuous surveillance of influenza virus and its subtypes is mandatory to help the policy makers to take effective and appropriate decisions. Therefore, this study was planned to determine the pattern of influenza virus activity in context to various meteorological and clinical parameters in and around Lucknow, Uttar Pradesh, India, during post pandemic period August 2010 - September 2012.
Methods:
Nasal swabs/throat swabs/nasopharyngeal aspirates of 2669 patients were collected. One-step real time PCR for detection of influenza virus was done according to the Centers for Disease Control and Prevention (CDC) protocol.
Results:
Influenza positivity was 15.8 per cent (423/2669) in symptomatic patients. Of the 423 total positives, 192 (7.2%) were influenza A and 231 (8.7%) were influenza B. Positivity for influenza virus was significantly (P=0.001, OR=2.9, CI=1.9-4.3) higher in patients with Influenza like illness (ILI) (17.4%, 396/2271) than those with severe acute respiratory illness (SARI) (6.8%, 27/398). Influenza A positive samples were subtyped as; pdmH1N1 (67.2%, 129/192) and seasonal H3N2 (32.8%, 63/192). It significantly correlated with monthly mean rainfall, humidity and dew point while atmospheric pressure was inversely related. No significant association was found with temperature and wind speed. Clinical variations were observed between different strains of Influenza virus.
Interpretation & conclusions:
The findings provide a clear picture of different clinical presentations of various strains of influenza A and B viruses and epidemiology of influenza infection from Lucknow (UP), India. The seasonality of influenza virus infection showed variation in relation to different environmental factors. Pandemic H1N1 caused more systemic infection than seasonal influenza A/H3N2 virus.
Keywords: Epidemiology, influenza, influenza A/H3N2, meteorological factors, seasonality
Influenza virus causes acute febrile respiratory illness in humans and is responsible for seasonal epidemics and pandemics throughout the world. In April 2009, a novel triple-reassortant swine influenza A/H1N1 virus (pdmH1N1) was first detected in Mexico which rapidly spread worldwide within a short time period as the first human influenza virus pandemic of the 21st century. Repeated influenza outbreaks at the beginning of 21st century have heightened the political interest in continuous influenza surveillance and response activities, therefore, laboratory surveillance expanded to nearly all parts of the world. In contrast to pandemics, seasonal annual epidemics occur every year worldwide. Annual seasonal influenza epidemics alone cause significant morbidity and mortality, affecting 5-15 per cent of the global population, hence are of major public health concern. The World Health Organization (WHO) reported an estimated 3 to 5 million cases of severe illness and 250,000 to 500,000 deaths worldwide due to seasonal epidemics1.
Although the well-known phenomenon of genetic reassortment (genetic shift) which allows virus to cause pandemics and “genetic drift” which causes seasonal epidemics explain the distribution of disease, yet the pattern of diseases transmission is not well understood. Epidemiology of influenza virus infection varies from year to year in different geographical regions of the world. In temperate countries of Northern and Southern hemisphere, influenza epidemics occur in winter months. In tropical countries, seasonality is less defined where high background influenza activity persists throughout the year2. Due to large year-to-year variations in influenza transmission, monitoring of influenza burden in tropical countries relies on good quality virus surveillance data of several years. To monitor its transmission, it is necessary to understand its seasonality in different geographical regions along with its global evolution and spread. It is also crucial for effective regional and global seasonal influenza prevention strategies as well as pandemic influenza control measures3,4.
Influenza surveillance activity has been conducted in different parts of India which is mostly restricted to only a few cities. The accurate epidemiological data from other parts of country are also required for better understanding of its transmission within country. Lucknow, Uttar Pardesh (UP), India has a warm humid subtropical climate with cool, dry winters from November to February and dry, hot summers from April to June. The rainy season is from mid-June to mid-September, with average rainfall of 1010 mm. The geographical location of Lucknow is between 26.50° North and 80.50° East and is situated on the northern Gangetic plains of India.
This study was undertaken to determine the circulating influenza virus strains by real- time PCR, define seasonality of influenza virus infection in this part of North India by correlating influenza positivity with meteorological factors, and to analyze clinical features of influenza cases infected with different influenza strains for better understanding of diagnosis.
Material & Methods
Patients with clinical diagnosis of influenza like illness, referred to the Virology Laboratory, Department of Microbiology, King George Medical University, Lucknow, Uttar Pradesh, India, during August 2010 to September 2012, were consecutively enrolled. The study protocol was approved by the Institutional ethics committee. Informed consent was taken from all participating patients/ their guardians in case of children. Patients of all age groups and both sexes were included in this study, and were categorized in two groups, based on severity of illness viz., influenza-like illness (ILI) and severe acute respiratory illness (SARI). Case definition of ILI was as: sudden onset of fever over 38°C, and cough or sore throat/ running nose, in absence of other diagnoses. SARI was defined as sudden onset of fever >38°C, accompanied by cough or sore throat, and shortness of breath (children) or difficulty in breathing (adults) and requiring hospitalization5. Relevant clinical data were collected in standardized questionnaires from each patient. Patients having received influenza immunization and not consenting to participate were excluded from this study. From each patient, nasal and throat swabs or / naso-pharyngeal aspirates were collected in 3.5 ml VTM (Viral Transport Media: Hanks’ balanced salt solution with 200 U penicillin/ ml and 200 μg/ml amphotericin B and 2 per cent bovine serum albumin (BSA), transported at 4°C and were processed for molecular diagnosis of human influenza viruses by real-time reverse transcriptase PCR and viral culture on MDCK (Madin Darby Canine Kidney) cell lines [Centre for Disease and Control (CDC), Atlanta, USA].
Laboratory procedures: RNA was extracted from 200μl clinical samples using High Pure Viral Nucleic Acid Extraction kit (Roche, Germany) according to the manufacturer's specifications. Real time PCR was done for confirmation of influenza A and B by using group specific primers targeted to conserved matrix gene (M) for influenza A and nucleocapsid protein gene (NP) for influenza B. Influenza A positive samples were further subtyped into seasonal H1, seasonal H3 and pandemic H1 using haemagglutinin gene (HA) specific primers according to the Centers for Disease Control and Prevention (CDC) protocol6, on ABI 7500 cycler (Applied Biosystems, USA). The RnaseP primers/ probe were used as positive internal control for human nucleic acid gene and positive control (PC), and negative template controls (NTC) were used with each run for the validity of experiment. To avoid cross-contamination, single use aliquots were prepared for all reagents including primers, probes, buffers and enzymes. External quality assurance was provided by the National Institute of Virology, Pune, India.
To determine the lineages of influenza B, PCR-positive samples were inoculated on MDCK cell lines for culture. Influenza B was confirmed by heamaggglutinin assay (HA) and lineages of influenza B were determined by haemagglutinin inhibition assay (HAI) with strain-specific antisera as per WHO guidelines7.
Statistical analysis: To determine the seasonal trends of influenza virus infection, we explored association of monthly mean temperature, humidity, rainfall, dew point, wind speed and atmospheric pressure with frequency of influenza positivity. Meteorological data of Lucknow (Uttar Pradesh) were collected from the meteorological department of Lucknow as reported by the World Weather Organization (www.wunderground.com).
To determine correlation between influenza confirmed cases with meteorological factors, biserial correlation coefficients (rb) were calculated. Multiple logistic regression analysis was done to find out independent association between influenza positivity and various independent environmental variables. Association of clinical parameters with influenza A / pdmH1N1, A / H3N2 and B positive cases were determined by odds ratio with chi-square test. All statistical analyses were done using STATA (version 11) software Stata Corp (Devloper), USA.
Results
Influenza positivity: A total of 2669 samples of patients with ILI/ SARI were tested during the study period. Real time PCR analysis revealed 15.8 per cent (423/2669) overall positivity for human influenza viruses. Of the 423 total positives, 192 (7.2%) were influenza A and 231 (8.7%) were influenza B (Table I). Figure 1 represents decreasing trend of influenza A positivity and increasing trend of influenza B positivity. Influenza A positive samples (192) were subtyped as pdmH1N1 (67.2%, 129) and seasonal H3N2 (32.8%, 63). Of the total 231 patients positive for influenza B, 57 (25%) were positive for influenza B/Victoria lineage and 174 (75%) for influenza B/Yamagata lineage.
Table I.
Month-wise distribution of influenza in and around Lucknow during August 2010 - September 2012
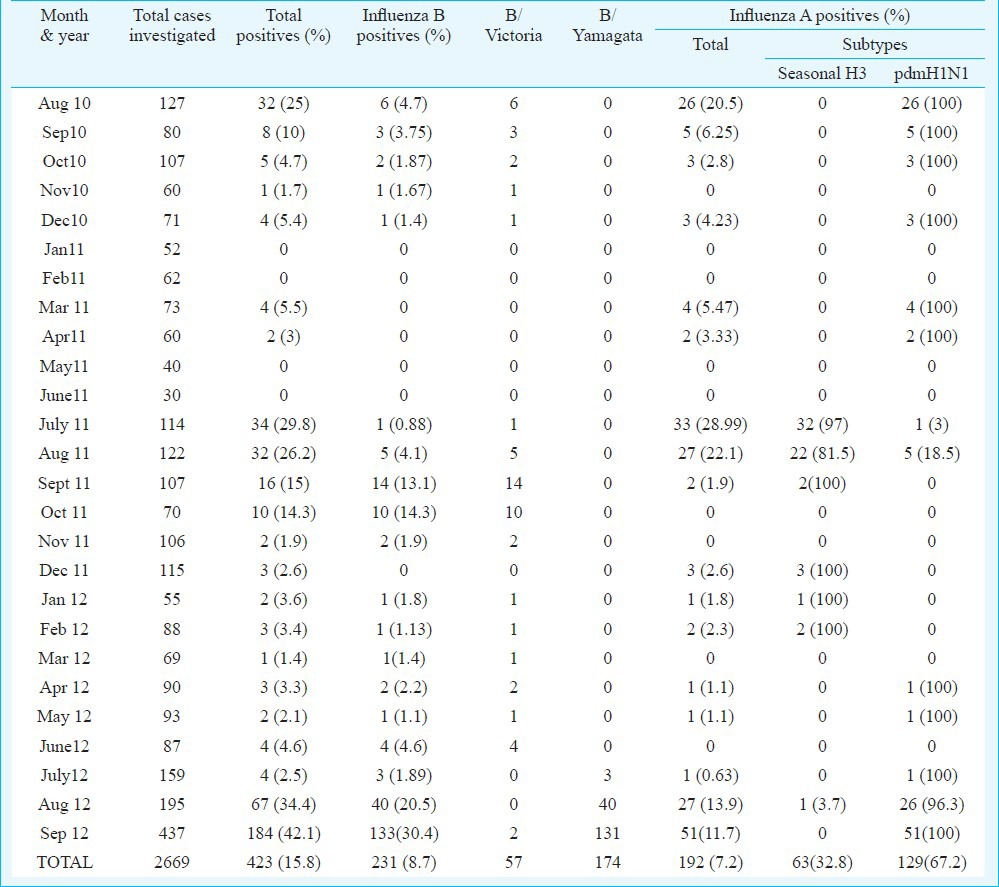
Fig. 1.
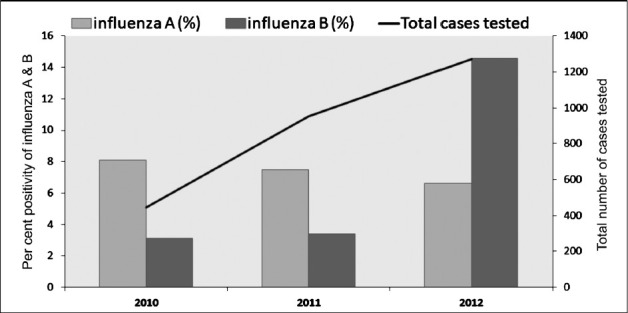
Total cases and influenza positivity during post pandemic period from 2010-2012.
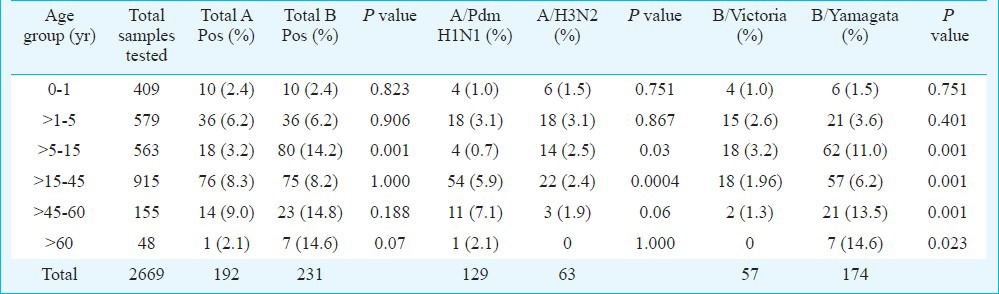
Among 2669 samples, 2271 patients presented as ILI and 398 as SARI. Positivity of influenza was significantly (P=0.001, OR=2.9, CI=1.9-4.3) higher in ILI group (17.4%, 396/2271) than SARI group (6.8%, 27/398). However, ratio of influenza A vs influenza B was more or less similar in ILI and SARI cases (ILI - 0.82:1, SARI- 1.1:1) (Table II). Influenza A and B positivity in different age groups is detailed in Table III. Patients of age groups >15 - 45, >45 - 60 and >60 yr were more susceptible to Inf A/Pdm H1N1 infection in comparison to A/H3N2, which predominately affected younger age groups (0 - 1, > 5-15 yr). Significant differences were observed only in age groups > 5 - 15, >15 - 45 and > 45 - 60 yr. Likewise, B/Victoria was more common in 0 - 1 and >1 - 5 yr age groups but B/Yamagata was significantly more common in >5 - 15, >15 - 45, >45 - 60 and >60 yr age groups. Statistical analysis between influenza A and B among different age groups showed that influenza B positivity (80/563, P<0.001, OR- 4.4 and CI- 2.64-7.87) was significantly higher in >5-15 age group as compared to influenza A.
Table II.
Frequency of influenza positivity in different severity group
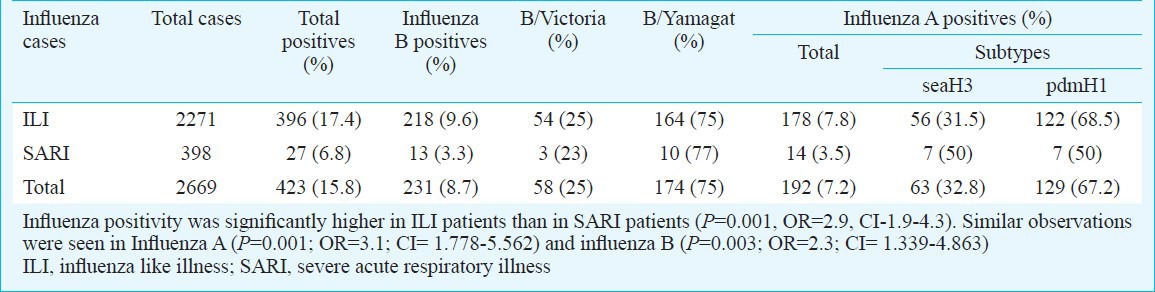
Table III.
Influenza positivity in different age groups
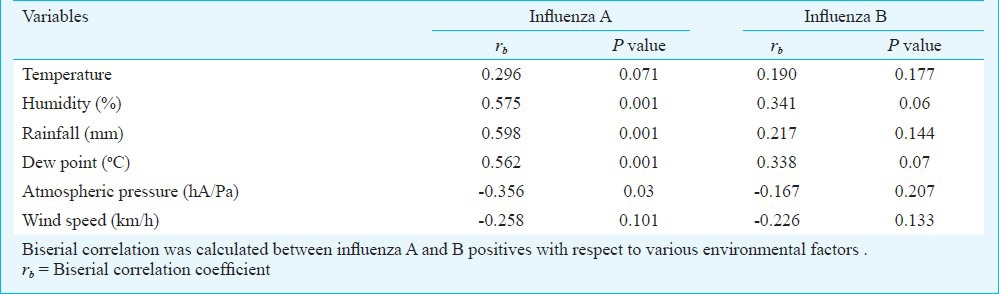
Seasonality: Month-wise analysis of influenza activity showed maximum number of cases in August and September each year (2010-2012) (Table I). Although, influenza positivity was seen throughout the year but the circulating patterns of influenza A and influenza B strains varied markedly. In 2010, pdmH1N1 subtypes of influenza A was circulating (37/37,100%), replaced by the seasonal H3N2 strains in year 2011 and again pdmH1N1 in 2012 (Table I). Influenza B circulated throughout the year along with influenza A and peaked during August - September each year and showed distinct pattern in which B/Victoria lineages was circulating from August 2010 to July 2012 replaced by B/Yamagata in August 2012 (Table I). Effects of various meteorological factors were studied on influenza positivity. In Fig. 2, upper graph shows the month-wise mean value of six independent environmental factors: humidity, rainfall, dew point, atmospheric pressure, temperature and wind speed; lower graph shows monthly percentage of influenza positivity (both influenza A & B and their subtypes). The analysis was done considering both the graphs simultaneously to see the effect of various meteorological factors on influenza positivity. Hence, the peaks of humidity, rainfall and dew point corresponded the peak of influenza positivity and the correlation was significant as shown in Table IV. Atmospheric pressure was inversely associated with influenza positivity, wind speed and temperature did not show any correlation. Influenza B virus did not show any statistically significant relation with any of the meteorological factor (Table IV). The adjusted R square value (R2=0.470) of analysis revealed that all independent variables could predict 47 per cent of the variance in influenza positivity. Independent environmental factors also showed significant correlation with each other, as temperature with rainfall (rb= 0.522, P=0.003) and humidity with dew point (rb= 0.476, P=0.007).
Fig. 2.

Correlation of meteorological factors with influenza positivity in and around Lucknow (UP, India) during post pandemic period of 2010-2012. Influenza A virus correlated positively to rainfall, humidity and dew point [r20=0.358, r2=0.423 and r2=0.460, respectively; P<0.01], and correlated negatively with atmospheric pressure [r2=0.458, P<0.01].
Table IV.
Correlation of influenza positivity with various environmental factors studied
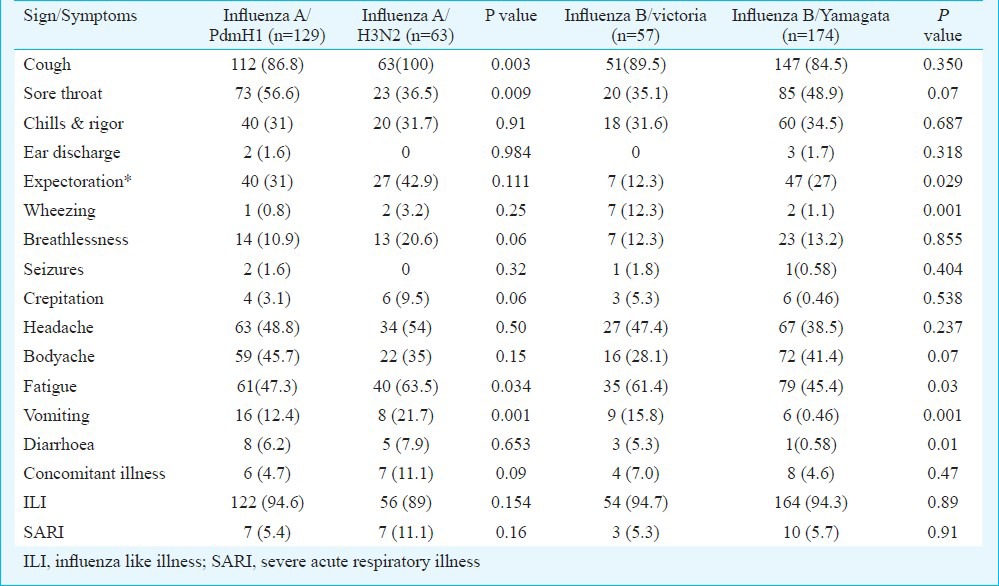
Clinical presentations: Clinical presentations of patients infected with pdmH1N1 were compared with those of seasonal A/H3N2 and likewise B/victoria with B/Yamagata (Table V). Sore throat was significantly associated with (P=0.009, OR=2.267 and CI=1.219-4.215) pdmH1N1 (56.6%). Fatigue (P=0.03, OR=0.5158 and CI=0.2779-0.9575) was significantly associated with seasonal influenza A/H3N2 infection. Since, fever, cough and nasal discharge were mandatory criteria for patient enrolment, hence, were not included in analysis. Expectoration was significantly associated with influenza B/yamagata strain (P=0.029, OR=0.378 and CI= 0.160-0.893), while wheezing (12.3%), fatigue (61.4%), vomiting (15.8%) and diarrhoea (5.3%) were significantly higher in case of B/Victoria (P<0.001) infection (P=0.001, OR=12, CI=2.42-59.8; P=0.03, OR=1.9, CI=1.03-3.52; P=0.001, OR=5.2, CI=1.77-15.49 and P=0.01, OR=9.6, CI=0.97-19.4).
Table V.
Comparative analysis of clinical features studied in influenza cases
Discussion
This study demonstrates the year round activity of influenza virus with overall prevalence of 15.8 per cent in and around Lucknow in north India during August 2010 to September 2012. Influenza A/ PdmH1N1 strain was most prevalent during August 2010 (peak influenza season) to April 2011 which was replaced by seasonal influenza A/H3N2 in May 2011 and reappeared in August 2012 with negligible cases in between. According to WHO update 20118 during post pandemic period influenza A/pdmH1N1 is expected to circulate as a seasonal virus for some years to come. This pattern of influenza virus circulation is also observed globally but with different prevalence rates. Influenza activity in the temperate regions of the northern hemisphere remained low overall though notable local increases in activity had been reported in North America, the western part of Europe, and northern China8. The most commonly detected virus type or subtype during 2011 was influenza A/H3N2 throughout the northern hemisphere temperate zone9 with the exception of Mexico where influenza A/pdmH1N1 was the predominant subtype circulating. In southern hemisphere, the most commonly detected virus was influenza A/pdmH1N1; however, influenza virus types and subtypes varied considerably from country to country, and even between neighbouring countries and domestic jurisdictions. Notable exceptions to the overall pattern seen in Asia during the second peak included southern China, which had a minor peak of influenza type B in August and smaller proportion of influenza A/H3N2. Influenza type B and A/H3N2 continued to be detected in low numbers across other parts, the region particularly in Lao People's Democratic Republic, Viet Nam, and Indonesia8,10.
In this study influenza B activity was seen throughout the study period at low level. Cases of influenza B increased during August-October 2011 with maximum positivity in September 2011. In 2012, influenza B positive cases increased abruptly with a peak in August perhaps due to change in lineages of influenza B. In 2011, nearly all influenza B were typed as B/Victoria lineages while in 2012 most of the influenza B positives were B/Yamagata lineages. One seroprevalence study against different influenza B strains conducted in Pune, Maharashtra, showed that the immunity to Yamagata lineage would not render protection from Victoria lineage and vice versa. The antibodies against previous strains do not provide protection to new stains of influenza, hence increases the possibility of incidence rate of influenza infection in population11.
Although influenza virus has been widely studied in developed countries, little is known about its seasonality in developing countries. Temperate countries observe more uniform pattern of influenza activity with distinct peak in winter months but the dynamic pattern of influenza transmission is less understood in tropical countries. In tropics, influenza virus is thought to circulate year round12. This location is responsible for the diverse weather patterns and climatic changes possibly contributing to mild influenza activity throughout year with unimodal peak during monsoon season. In other tropical countries around India such as Hong Kong and Southern China, two peaks of seasonal epidemic as in early spring and June-August are usually reported10. In contrast, a few studies have reported no defined influenza season13,14 while some have reported that influenza seasonality coincides with the rainy season15,16,17, and others have reported 1 or 2 seasonal peaks of influenza activity per year18,19,20. We found significant association of monthly mean rainfall, humidity and dew point with influenza activity. Rainfall promotes crowding and indoor staying therefore increases the risk for contact transmission which is the efficient mechanism of influenza transmission in tropical countries17,21,22,23,24,25. Atmospheric pressure showed significant inverse relationship with influenza A activity. It is likely that atmospheric pressure indirectly influences the other climatic factors that derive seasonality of influenza virus transmission. Humidity and atmospheric pressure both are related to rainfall and temperature.
WHO recommends that persons suspected of illness from influenza virus should receive appropriate clinical care26. In post pandemic period as H1N1(2009) virus is expected to circulate, cases of severe illness in higher risk individuals, as well as in otherwise healthy individuals, are likely to occur. Early recognition and appropriate treatment of such cases remain important. We analyzed clinical presentations of different influenza virus types and subtypes. Many studies from India and around the world depicted that 2009 pdmH1N1 infected more often young adults while mortality was quite high in >60 yr age group and children27,28,29, while seasonal influenza usually affected >1-15 yr age group. Human seasonal influenza infects the people of all age groups but children and elders are more prone to infection may be due to weak immune system30. Pandemic influenza A/H1N1 causes sore throat, body ache and ear discharge more often compared to seasonal influenza A/H3N2 infection, and causes more systemic disease in patients than seasonal strains of influenza. Expectoration, breathlessness, crepitation were more likely associated with seasonal H3N2 positive cases causing more localized infection.
In conclusion, the present findings show differential clinical presentations of various strains of influenza A and B viruses and epidemiology of influenza infection from Lucknow (UP), India, which can help in future planning.
Acknowledgment
This research work was financially supported by the Indian council of Medical Research, New Delhi. Authors acknowledge the Director, National Institute of Virology, Pune, for providing support in this influenza surveillance project and for technical guidance to the staff. Dr Shashi Krishna, Ms. Preeti Sharma, staff of influenza project and VDL staff for support in laboratory work and collection of samples.
References
- 1.Influenza (seasonal), World Health Organization. 2009. [accessed on January 24, 2010]. Available from: http://www.who.int/mediacentre/factsheets/fs211/en/index.html .
- 2.Viboud C, Alonso WJ, Simonsen L. Influenza in tropical regions. PLoS Med. 2006;3:89. doi: 10.1371/journal.pmed.0030089. [DOI] [PMC free article] [PubMed] [Google Scholar]
- 3.Moura FA. Influenza in the tropics. Curr Opin Infect Dis. 2010;23:415–20. doi: 10.1097/QCO.0b013e32833cc955. [DOI] [PubMed] [Google Scholar]
- 4.World Health Organization. Acute respiratory infections: Influenza. 2007. [accessed on March 15, 2011]. Available from: http://www.who.int/vaccine_research/diseases/ari/en/index.html .
- 5.Human infection with pandemic (H1N1) 2009 virus: updated interim WHO guidance on global surveillance 2009. July 10. [accessed on April 5, 2011]. Available from: http://www.who.int/csr/disease/swineflu/WHO_case_definition_swine_flu_2009_04_29.pdf .
- 6.WHO, CDC protocol of real-time RTPCR for swine influenza A (H1N1) 2009. Apr 30, [accessed on March 15, 2011]. Available from: http://www.who.int/csr/resources/publications/swineflu/CDCRealtimeRTPCR_Swine H1Assay-2009_20090430.pdf .
- 7.Geneva, Switzerland: WHO; 2002. World Health Organization. Manual on animal influenza diagnosis and surveillance. WHO/CDS/CSR/ NCS2002.2. [Google Scholar]
- 8.WHO update, Summary review of the 2011 southern hemisphere winter influenza season, WHO Influenza Update. 2012. [accessed on February 24, 2012]. Available from: www.who.int/influenza/surveillance_monitoring/2011_GIP_surveillance_seasonal review .
- 9.WHO update, summary review of the 2010-2011 northern hemisphere winter influenza season. WHO Influenza Update. 2011. [accessed on December 30, 2011]. Available from: www.who.int/influenza/surveillance_monitoring/2010_2011_GIP_surveillance_seasonalreview/en .
- 10.European Centre for Disease Prevention and Control (ECDC) 2005-2009: Global Influenza Epidemiology Overview for Europe, with particular emphasis on southern hemisphere temperate countries - week 36. 2010. Sep 13, [accessed on November 11, 2011]. Available from: http://www.ecdc.europa.eu .
- 11.Yeolekar LR, Kulkarni PB, Pawar SD, Rao BL. Influenza surveillance in Pune, India: Reappearance of B/Victoria/2/87-like influenza virus strain in 2002. Curr Sci. 2004;86:966–8. [Google Scholar]
- 12.Monto AS. Epidemiology of Influenza. Vaccine. 2008;26:D45–8. doi: 10.1016/j.vaccine.2008.07.066. [DOI] [PubMed] [Google Scholar]
- 13.Straliotto SM, Siqueira MM, Muller RL, Fischer GB, Cunha ML, Nestor SM. Viral etiology of acute respiratory infections among children in Porto Alegre, RS, Brazil. Rev Soc Bras Med Trop. 2002;35:283–91. doi: 10.1590/s0037-86822002000400002. [DOI] [PubMed] [Google Scholar]
- 14.Moura FE, Perdigao AC, Siqueira MM. Seasonality of influenza in the tropics: a distinct pattern in northeastern Brazil. Am J Trop Med Hyg. 2009;81:180–3. [PubMed] [Google Scholar]
- 15.de Mello WA, de Paiva TM, Ishida MA, Benega MA, Dos Santos MC, Viboud C, et al. The dilemma of influenza vaccine recommendations when applied to the tropics: the Brazilian case examined under alternative scenarios. PLoS One. 2009;4:e5095. doi: 10.1371/journal.pone.0005095. [DOI] [PMC free article] [PubMed] [Google Scholar]
- 16.Dosseh A, Ndiaye K, Spiegel A, Sagna M, Mathiot C. Epidemiological and virological influenza survey in Dakar, Senegal: 1996-1998. Am J Trop Med Hyg. 2000;62:639–43. doi: 10.4269/ajtmh.2000.62.639. [DOI] [PubMed] [Google Scholar]
- 17.Rao BL, Banerjee K. Influenza surveillance in Pune, India, 1978-90. Bull World Health Organ. 1993;71:177–81. [PMC free article] [PubMed] [Google Scholar]
- 18.Chew FT, Doraisingham S, Ling AE, Kumarasinghe G, Lee BW. Seasonal trends of viral respiratory tract infections in the tropics. Epidemiol Infect. 1998;121:121–8. doi: 10.1017/s0950268898008905. [DOI] [PMC free article] [PubMed] [Google Scholar]
- 19.Wong CM, Yang L, Chan KP, Leung GM, Chan KH, Guan Y, et al. Influenza-associated hospitalization in a subtropical city. PLoS Med. 2006;3:e121. doi: 10.1371/journal.pmed.0030121. [DOI] [PMC free article] [PubMed] [Google Scholar]
- 20.Nguyen HL, Saito R, Ngiem HK, Nishikawa M, Shobugawa Y, Nguyen DC, et al. Epidemiology of influenza in Hanoi, Vietnam, from 2001 to 2003. J Infect. 2007;55:58–63. doi: 10.1016/j.jinf.2006.12.001. [DOI] [PubMed] [Google Scholar]
- 21.Lowen AC, Mubareka S, Steel J, Palese P. Influenza virus transmission is dependent on relative humidity and temperature. PLoS Pathog. 2007;3:1470–6. doi: 10.1371/journal.ppat.0030151. [DOI] [PMC free article] [PubMed] [Google Scholar]
- 22.Shaman J, Pitzer VE, Viboud C, Grenfell BT, Lipsitch M. Absolute humidity and the seasonal onset of influenza in the continental United States. PLoS Biol. 2010;8:e1000316. doi: 10.1371/journal.pbio.1000316. [DOI] [PMC free article] [PubMed] [Google Scholar]
- 23.Agrawal AS, Sarkar M, Chakrabarti S, Rajendran K, Kaur H, Mishra AC, et al. Comparative evaluation of real-time PCR and conventional RT-PCR during a 2 year surveillance for influenza and respiratory syncytial virus among children with acute respiratory infections in Kolkata, India, reveals a distinct seasonality of infection. J Med Microbiol. 2009;58:1616–22. doi: 10.1099/jmm.0.011304-0. [DOI] [PubMed] [Google Scholar]
- 24.Kumar B, Pati DR, Khanna M, Kumar P, Daga MK, Singh V, et al. Age-sex distribution and seasonality pattern among influenza virus infected patients in Delhi, 2009-2010. Indian J Commun Med. 2012;37:57–8. doi: 10.4103/0970-0218.94028. [DOI] [PMC free article] [PubMed] [Google Scholar]
- 25.Zaman RU, Alamgir ASM, Rahman M, Azziz-Baumgartner E, Gurley ES, Sharker MAY, et al. Influenza in outpatient ILI case-patients in National hospital-based surveillance, Bangladesh, 2007-2008. PLoS One. 2009;4:e8452. doi: 10.1371/journal.pone.0008452. [DOI] [PMC free article] [PubMed] [Google Scholar]
- 26.WHO recommendations for the post pandemic period. Pandemic H1N1 2009 briefing note 23. 2010. Aug 10, [accessed on May 12, 2011]. Available from: www.who.int/entity/csr/disease/swineflu/notes/en .
- 27.Das RR, Sami A, Lodha R, Jain R, Broor S, Kaushik S, et al. Clinical profile and outcome of swine flu in Indian children. Indian Paediatr. 2010;48:373–8. doi: 10.1007/s13312-011-0085-y. [DOI] [PMC free article] [PubMed] [Google Scholar]
- 28.Broor S, Krishnan A, Roy DS, Dhakad S, Kaushik S, Mir MA, et al. Dynamic patterns of circulating seasonal and pandemic A (H1N1) pdm09 Influenza viruses from 2007-2010 in and around Delhi, India. PLoS One. 2012;7:e29129. doi: 10.1371/journal.pone.0029129. [DOI] [PMC free article] [PubMed] [Google Scholar]
- 29.Greer AL, Tuite A, Fisman DN. Age, influenza pandemics and disease dynamics. Epidemiol Infect. 2010;138:1542–9. doi: 10.1017/S0950268810000579. [DOI] [PubMed] [Google Scholar]
- 30.Legace-Wiens PR, Rubinstein E, Gumel A. Influenza epidemiology - past, present, and future. Crit Care Med. 2010;38:e1–e6. doi: 10.1097/CCM.0b013e3181cbaf34. [DOI] [PubMed] [Google Scholar]