

Abstract
Background: The factors affecting glioblastoma progression are of great clinical importance since dismal outcomes have been observed for glioblastoma patients. The Snail gene is known to coordinate the regulation of tumor progression in diverse tumors through induction of epithelial mesenchymal transition (EMT); however, its role in glioblastoma is still uncertain. Therefore, we aimed to further define its role in vitro. Methods and results: The small interfering RNA (siRNA) technique was employed to knock down Snail expression in three glioblastoma cell lines (KNS42, U87, and U373). Specific inhibition of Snail expression increased E-cadherin expression but decreased vimentin expression in all cell lines. In addition, inhibition of the expression of Snail significantly reduced the proliferation, viability, invasion, and migration of glioblastoma cells as well as increased the number of cells in the G1 phase. Conclusions: Knockdown of Snail suppresses the proliferation, viability, migration, and invasion of cells as well as inhibits cell cycle progression by promoting EMT induction. The findings suggest that expression of this gene facilitates glioblastoma progression. Therefore, these results indicate the clinical significance of Snail for use as a potential therapeutic target for glioblastoma.
Keywords: Epithelial mesenchymal transition (EMT), glioblastoma, small interfering RNA (siRNA), Snail
Introduction
Glioblastomas are commonly occurring brain tumors and are difficult to treat. Despite conventional advancements in modern therapeutic methodologies such as surgery, chemotherapy, and radiation therapy, dramatic improvement in the survival of patients with glioblastomas has not yet been achieved [1]. These limitations of current therapeutic modalities in patients with glioblastoma are germane to remarkable resistance to cell death and a distinct invasive nature. Many researchers focused on various molecular and genetic mechanisms implicated in glioblastoma progression in order to overcome the major therapeutic obstacles during treatment [2-6].
Tumor progression is a complicated process occurring via a coordinated series of cellular and molecular processes [7]. The invasiveness and higher cell proliferation and viability are important factors in tumor progression. One of the mechanisms that can explain tumor progression is the epithelial mesenchymal transition (EMT), which is the first step [8,9] in epithelial tumor invasion since invasion and metastatic cascade of tumor cells are achieved by EMT induction [7,10]. However, only a few studies have been performed on the role of the EMT-activating transcription factor in glioblastoma. Limited studies have been conducted due to the absence or low expression of E-cadherin. Therefore, it is yet to be ascertained whether EMT induction is directly responsible for the invasive mechanism of brain tumors as in epithelial tumors [11]. This is because EMT begins with the functional loss of E-cadherin. However, only a few studies have revealed the association between expression of the EMT-activating transcription factor and glioblastoma progression [3,8,9]. Consequently, the EMT-activating transcription factor should be studied to ascertain glioblastoma progression [3].
The Snail (also known as SNAI1 or Snail1) gene was firstly characterized in Drosophila melanogaster [4,12], and currently, more than 50 family members of the SNAI1 gene have been isolated from metazoans [4,13]. The expression of Snail is known to be associated with various physiological functions such as gastrulation, neural crest formation, and various developmental processes [4,7,13]. In addition, Snail is a well-known factor related to the regulation of the invasion in various carcinomas, such as breast tumors, gastric cancers, hepatocellular carcinomas, and colon cancers [4,14-32]. Various studies that revealed an association between Snail expression and regulation of tumor progression were documented with carcinomas. Recently, Han et al. demonstrated the role of Snail in the progression of glioblastoma cells [4]. They demonstrated that Snail induced the proliferation and migration of glioblastoma cells. These results taken together to verify the role of Snail in EMT process regulation will provide new insights into the molecular mechanisms of glioblastoma progression. Our studies intended to evaluate the effect of the knockdown of Snail on the invasion, migration, viability and proliferation of cells as well as on the cell cycle of glioblastoma cells in vitro.
Materials and methods
Cell culture
Human pediatric glioblastoma cell line KNS42 (cordially provided by Japan Health Science Research Resources Bank ) and adult glioblastoma cell lines U87 and U373 were obtained from the American Type Culture Collection (Manassas, VA). Cells were maintained Dulbecco’s modified Eagle’s medium (DMEM) (Welgene, Daegu, Korea) supplemented with 10% fetal bovine serum (FBS, Invitrogen, NY), penicillin (50 U/ml), and streptomycin (50 U/ml). The cells were kept at 37°C in a humidified atmosphere of 5% CO2 and the medium was replaced every 2-3 days.
Immunohistochemistry
The primary antibodies used in the immunohistochemical study of formalin-fixed, paraffin-embedded sections is Snail (polyclonal, Abcame, Cambridge, UK) using a 1:400 dilution. Immunohistochemistry was performed by the avidin-biotin peroxidase (ABC) method, based on our previous report [33].
Knockdown of Snail
To inhibit endogenous Snail gene in glioblastoma cell lines, small interfering RNAs (siRNA) were used. Scrambled siRNA (universal negative control siRNA), Snail-siRNA was purchased (Thermo Fisher Scientific, Waltham, USA or Bioneer, Daejeon, Korea). Two kinds of siRNAs to target one gene were described in Table 1. Cells were plated 40-60% confluency and transfected 25-50 nM scrambled siRNA, Snail-siRNA using Lipofectamin RNAiMAX reagent (Invitrogen) according to the manufacturer’s instruction. Knockdown efficiency was confirmed by RT-qPCR. The transfected cells were used for various assays 48-72 h after transfection to allow effective knockdown of Snail was specified in each experiment.
Table 1.
Sequences for two kinds of siRNAs
| Gene | Sense | Antisense |
|---|---|---|
| Snail (1) | 5’-GCGUGGGUUUUUGUAUCCA(dTdT)-3’ | 5’-GACUGUGAGUAAUGGCUGU(dTdT)-3’ |
| Snail (2) | 5’-GCGUGGGUUUUUGUAUCCA(dTdT)-3’ | 5’-GACUGUGAGUAAUGGCUGU(dTdT)-3’ |
Reverse transcription- polymerase chain reaction (PCR) and real-time reverse transcription-PCR
Total RNA was extracted from transfected cell lysates using PureLink RNA mini kit (Invitrogen). cDNA synthesis was performed using EcoDry Premix-Oligo (dT) (Clontech, Mountain View, CA, USA) from 1 μg of total RNA. Real-time PCR (power SYBR Green, ABI, UK) analysis was performed using an ABI (Applied Biosystems, Foster City, CA) Prism 7000 Sequence Detector, according to the manufacturer’s protocol with the appropriate primers (Table 2). The relative expression of each gene was normalized against GAPDH as described by the manual of ABI prism 7000 Sequence Detection System. These experiments were performed in triplicate and repeated in three independent experiments.
Table 2.
Primer sequences for reverse transcription and quantitative real-time polymerase chain reaction
| Gene | Sense | Antisense |
|---|---|---|
| Snail | TTTCTGGTTCTGTGTCCTCTGC | CCTGTAGCTCAAAGCAGCTGTA |
| E-Cadherin | TGCCCAGAAAATGAAAAAGG | GTGTATGTGGCAATGCGTTC |
| Vimentin | GAGAACTTTGCCGTTGAAGC | GCTTCCTGTAGGTGGCAATC |
| GAPDH | CAATGACCCCTTCATTGACC | GACAAGCTTCCCGTTCTCAG |
Western blot
Total protein extracts were isolated RIPA buffer (Thermo Scientific, Pierce Biotechnology, Pittsburgh, PA) and quantification was performed using the BCA Assay (Thermo Scientific). The samples were prepared by adding the NuPage 4 × LDS sample buffer (Invitrogen) and heating them at 70°C for 10 min. Equal amounts of the proteins (depending on experiment) were loaded on NuPage 4-12% gradient polyacrylamide gels (Invitrogen). The proteins were transfered i-Blot system (Invitrogen) using polyvinylidine fluoride (PVDF) membranes and then, the membrane was blocked for 1 hour at room temperature. The blots were then incubated in the primary antibodies; Snail (1:200; Cell Signaling, USA), E-cadherin (1:200; Abcam, Cambridge, UK) and Vimentin (1:1,000; Cell Signaling) either rocking for overnight at 4°C. HRP-conjugated secondary antibody was then incubated for 1 hour at room temperature. The membranes were developed using the enhanced chemiluminescence detection system (Invitrogen) and visualized by exposing the autoradiographic film (Kodak, Rochester, NY).
CCK and BrdU assay
An equal density of cells (4 × 10³) from transfection with scrambled siRNA and Snail-siRNA were seeded in 96-well plates and incubated for 24-72 hours. The viable cell number was evaluated using a CCK (cell counting kit; Dojindo, Kumamoto, Japan) assay. CCK were added and incubated for 2 hour and absorbance of each well was measured at 540 nm with a micro-ELISA reader (Molecular Devices; Sunnyvale, CA, USA).
Cell proliferation was determined using the Cell Proliferation ELISA BrdU kit (Roche Diagnostics GmbH; Mannheim, Germany). BrdU was added to the cells for 2 hours and the cells were treated according to the manufacture’s protocol. The optical density at 370 nm was measured on an ELISA plate reader. Percentage of cell survival was determined by relative absorbance of cells transfected with Snail-siRNA versus cells scrambled-siRNA. All assays were performed in triplicates.
Cell cycle analysis
To assess the cell cycle phase distributions, a flow cytometry analysis of DNA contents of cells were performed as described. The cells were tranfected with scrambled siRNA and Snail-siRNA. Three days after transfection, the cells were harvested, washed in PBS, and fixed in 70% ethanol for 1 h at 4°C. Then, cells were washed in PBS and incubated with 0.5 mg/ml Rnase A (Sigma Aldrih) for 30 min at 37°C and DNA-binding dye 10 μg/ml propidium iodine solution (Sigma Aldrih) in the dark. DNA contents of the samples were analyzed on a FACS Caliber flow cytometer (BD, Heidelberg, Germany) using a peak fluorescence gate to discriminate aggregates.
Invasion assay and wound healing assay
Invasion of tumor cells was analyzed using Cell Invasion Assay Kit (8 μm pore size, Chemicon, MA, USA) according to the manufacture’s protocol. After transfection, the cells (1 × 10⁵/well) were suspended in serum-free medium and plated on the upper chamber including mitomycin-C (10 μg/ml, Sigma Aldrich). The lower chamber was filled with culture medium supplemented with 10% fetal bovine serum as the chemoattractant. After 24, and 72 h, the non-invading cells were removed gently by cotton swab. The cells that are invaded that are present on the lower side of the upper chamber were stained and air dried. The invaded cells were photographed and counted under the light microscope. For quantification, the stained cells were dissolved with 10% acetic acid, and absorbance was measured at 560 nm. The assay was performed in triplicates.
The wound healing assay was performed with a CytoSelectTM 24-well cell invasion assay kit (Cell Biolabs, San Diego, CA) according to the manufacturer’s protocol. Transfected cells were added to either side of the open ends at the top of the insert. When cells formed a monolayer, the insert were removed to generate a consistent 0.9 mm wound gap in the middle. To analyze of migration distance, the wound gap were observed for each time point. At different time period, cells were fixed and stained with methylene blue and photographed.
Statistical analysis
All statistical data were presented as mean ± SD and GraphPad Prism software (GraphPad Software, San Diego, CA) was used for statistical analyses. Statistical significance was determined by Student’s t test. For comparison of more than three groups, one-way analysis of variance (ANOVA), followed by Tukey’s multiple comparisons, was used. A result with a P value of < 0.01 and < 0.05 was considered statistically significant.
Results
Immunohistochemical analysis of Snail protein expression in glioma and normal brain tissue samples
The expression level of the Snail protein in normal brain tissue and in different WHO-grade paraffin-embedded glioma samples was determined using immunohistochemical staining (Figure 1). The expression of Snail was higher in glioma samples than in normal brain tissue. Furthermore, highly malignant gliomas (WHO grade IV) showed higher expression of the Snail protein than low-grade gliomas (WHO grade II).
Figure 1.
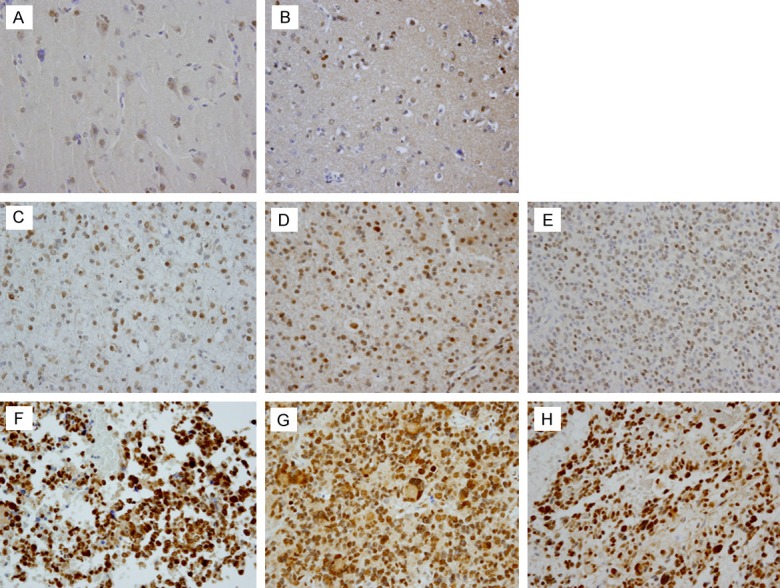
Expression of Snail in normal brain tissue and glioma. A, B. Weak expression of Snail presents in normal brain tissue. Neurons and a few glial cells mainly show very weak immunoreactivity to the Snail protein. C-E. Weak-to-moderate immunoreactivity to the Snail protein along the nuclear membrane was observed in low-grade glial tumors (WHO grade II). F-H. Glioblastomas exhibiting strong staining intensity for Snail protein (Snail immunostaining; original magnification, 400 ×).
Effect of Snail knockdown on E-cadherin and vimentin expression
A molecular feature of EMT is the down regulation of E-cadherin expression and up regulation of a mesenchymal marker, such as vimentin. We compared the mRNA and protein expression of Snail, E-cadherin, and vimentin after Snail inhibition with specific siRNAs in adult and pediatric glioblastoma cell lines. The results are shown in Figure 2. Overall, the expression profiling change of E-cadherin and vimentin mRNA and protein after Snail inhibition with specific siRNA was consistent in three cell lines. Real-time quantitative polymerase chain reaction (PCR) demonstrated that knockdown of Snail expression in these three cell lines significantly increased E-cadherin mRNA expression as compared with that in the control group. These results were further simultaneously validated in protein expression. In contrast, the mRNA and protein expression of vimentin significantly decreased as compared to that in the control group after Snail specific siRNA treatment.
Figure 2.
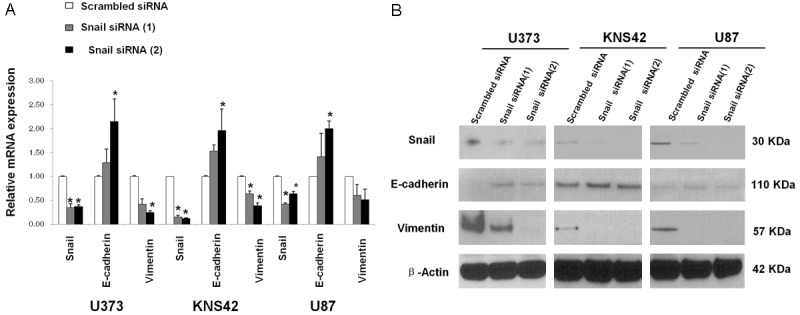
Relative mRNA and protein expression of Snail, E-cadherin, and vimentin after Snail inhibition with specific siRNA in adult and pediatric glioblastoma cell lines. U373, KNS-42, and U87 cells were transfected with scrambled siRNA and two Snail-specific siRNA. The total mRNA and protein were extracted from each transfected cell. A. Reverse transcriptase quantitative polymerase chain reaction (RT-qPCR) analysis of the mRNA expression of Snail, E-cadherin, and vimentin in each cell line. B. Western blotting of the protein of Snail, E-cadherin, and vimentin expression in each cell line. The β-actin loading control is shown in the lower panel. Data shown correspond to one representative experiment out of the three performed. *P < 0.05 vs. scrambled siRNA control.
Effect of Snail knockdown on invasion and migration ability
In addition to increased expression of the mesenchymal marker after EMT induction, cells acquired a more motile and invasive phenotype. To evaluate these characteristics, we evaluated the invasion and migration ability based on Snail expression. Inhibition of Snail expression reduced the invasive ability of U373 and KNS42 glioblastoma cells (Figure 3). Also, Snail specific siRNA treatment significantly reduced the migration ability of U373 and KNS42 glioblastoma cells through EMT induction (Figure 4).
Figure 3.
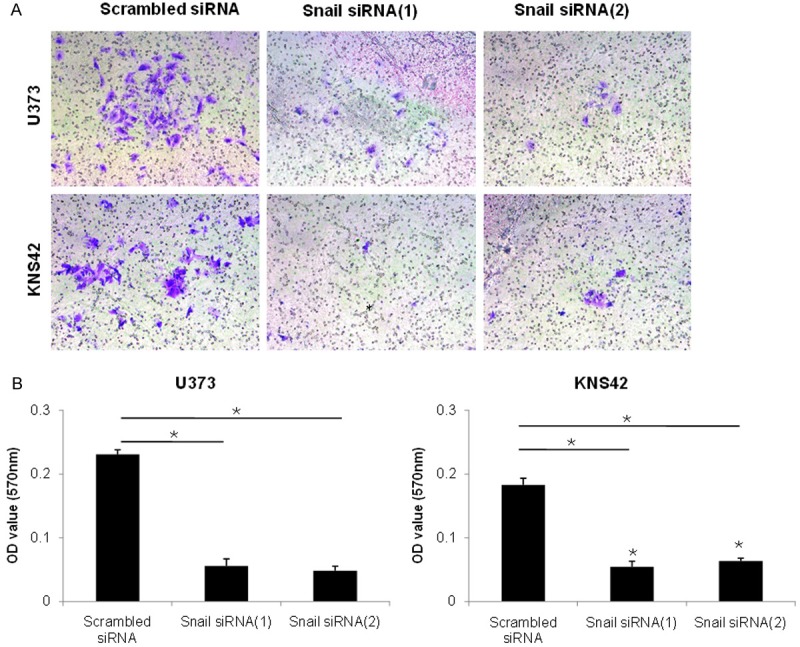
Cell invasion assay after Snail inhibition with specific siRNA in the U373 and KNS 42 cells. Snail siRNA gene knockdown significantly decreased cell invasion. A. Images displaying the bottom side of the filter inserts with cells that invaded through the filter pores. B. Columns graphs represent cell count analysis. Data shown correspond to one representative experiment out of the three performed. *P < 0.01 vs. scrambled siRNA control.
Figure 4.
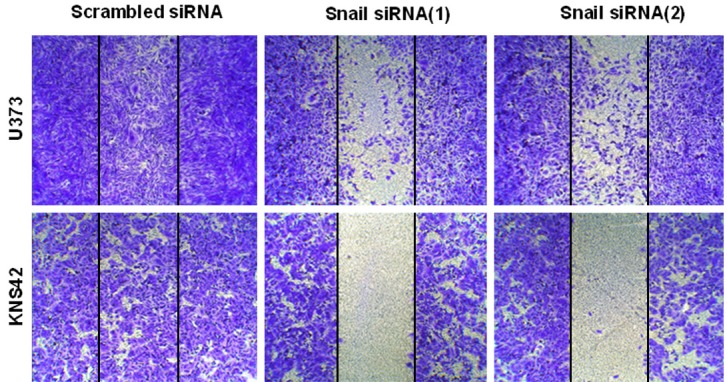
Cell migration assay after inhibition with specific siRNA in U373 and KNS42 cells. Snail siRNA gene knockdown significantly decreased cell migration as compared with universal scrambled siRNA. Representative images of decreased migration in U373 and KNS 42 cells by Snail siRNA gene knockdown in a wound-healing assay.
Snail knockdown on proliferation and viability
In addition to the well-characterized role of EMT in increased invasion and migration of tumor cells, induction of EMT is also found to be associated with diverse effects such as cell proliferation and viability. Many studies have shown that increased proliferation and viability of cells in EMT-induced cells, results of which are consistent those of the present study. The growth curves determined using the BrdU assay revealed that inhibition of Snail expression significantly reduced glioblastoma cell proliferation in all cell lines. Also, the CCK assay demonstrated the effect of Snail expression cell viability reduction in Snail-specific siRNA transfected cells as compared to that for scrambled siRNA transfected cells. The results are shown in Figure 5.
Figure 5.
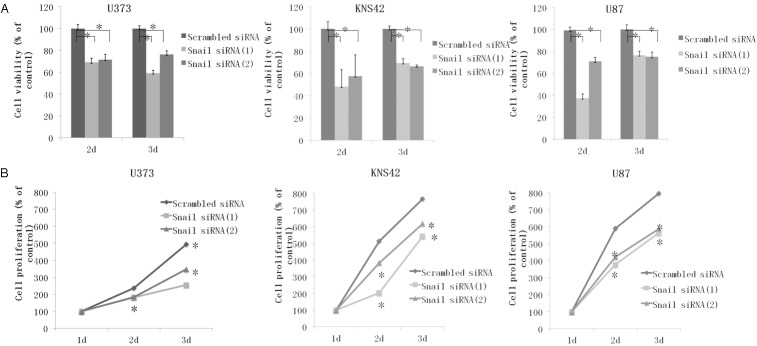
Cell proliferation and viability assay after Snail inhibition with specific siRNA for Snail. A. Column graphs showing the effects of Snail inhibition on the viability of U373, KNS 42, and U87 cells as compared with scrambled siRNA determined by a BrdU proliferation assay at days 1, 2, and 3 post siRNA transfection. B. Line graphs showing the effects of Snail inhibition on the proliferation of U373, KNS 42, and U87 cells as compared with scrambled siRNA, determined using a CCK assay at days 1, 2, and 3 post siRNA transfection. Data shown correspond to one representative experiment out of the three performed. *P < 0.01 vs scrambled siRNA control.
Effect of Snail knockdown on cell cycle
To examine the effects of Snail expression on the cell cycle, we evaluated the cell cycle distribution using flow cytometry at 72 h post transfection in scrambled siRNA and Snail-specific siRNA-treated cells. As shown in Figure 6, the cells exhibited a significant increase in the fraction of cells in the G1 phase and a corresponding reduction in the fraction of cells in the S phase. This result is observed in all cell lines.
Figure 6.
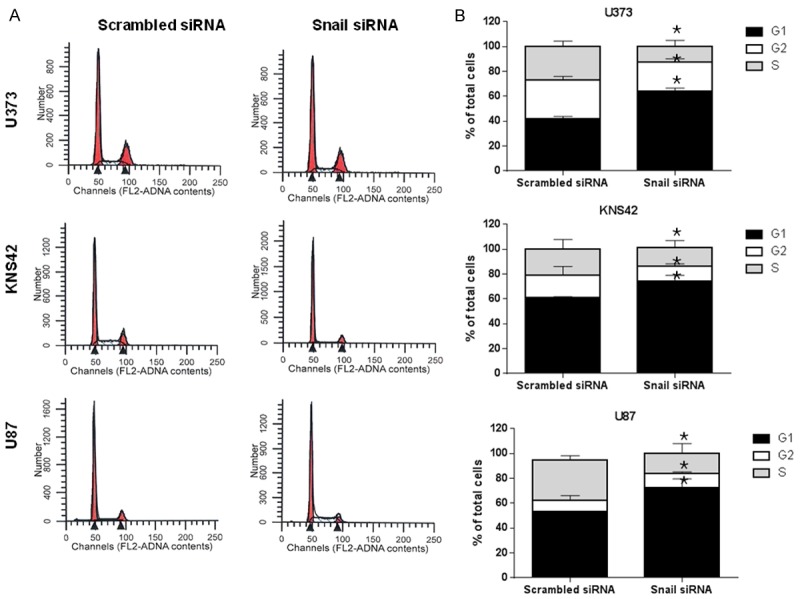
FACS analysis of propidium iodide-stained U373, KNS42, and U87 cells after Snail siRNA transfection. A. U373, KNS42, and U87 cells were grown for 3 days on either Snail siRNA transfection or scrambled siRNA. Fluorescence analysis of the DNA content (propidium iodide staining; FL2-A) was performed. Different cell distribution in the G1, S, and G2/M phases of the cell cycle was observed in U373, KNS42, and U87 cells, respectively. B. Quantitative assessment of the percentage of cellular population associated with each phase of the cell cycle. A significantly large number of G1 phase cells were observed in all cell lines after treatment of Snail siRNA. Data shown correspond to one representative experiment out of the three performed. *P < 0.01 vs. scrambled siRNA control.
Discussion
The EMT process included acquisition of mesenchymal and migration properties through the loss of cell-cell interaction and apico-basal polarity. These processes played a major role in the various developmental processes, tumor cell invasion, and metastasis [7,10]. With regard to tumor cell invasion, these programs were used to explain the mechanism of invasive processes only in epithelial cancers. However, recent new results demonstrated that EMT-activating transcription factors, such as Snail, Slug, Twist, and ZEB2, enhanced the proliferation, invasion, and migration of glioblastoma cells as well as epithelial tumors [4-6,34]. These studies proposed a correlation between glioblastoma progression and expression of EMT-activating transcription factors in brain tumors similar to that in epithelial tumors. Based on these findings, further studies are warranted for the role of EMT-activating transcription factors, especially those in glioblastoma progression, in order to enhance the survival rate of patients with glioblastoma and broaden our understanding of glioblastoma pathogenesis. Many researchers may claim that the effect of EMT-activating transcription factors on the progression of glioblastoma was difficult to determine due to the lack of E-cadherin expression in normal brain tissue and in brain tumors. However, in addition to E-cadherin, various diverse genes and proteins exist that regulate EMT processes. Also, some experimental results demonstrated a definite effect of EMT-activating transcription factors on the progression of glioblastomas. Recently, a new experiment was conducted on the molecular classification of glioblastomas, and the results suggested that glioblastomas could be subclassified into four groups based on gene expression. The mesenchymal subtype showed high expression of EMT-related genes as compared to the other subtypes. Therefore, it is important to evaluate the effect of the Snail expression on glioblastoma progression, and the present study will serve to expand current knowledge on the new oncogenic role of Snail in glioblastoma pathogenesis.
Recently, various studies have described the role of Snail in cell proliferation, cell survival, and tumor cell invasion as well as on EMT induction. These recent studies suggested that aberrant expression of Snail is related to other clinicopathological findings, including patient survival in breast [15,16,26,32], ovarian [15,30,31], hepatocellular [17,19,28,35], and colorectal carcinomas [25,36]. Analysis of these results clarified the influence of Snail on patient survival; however, no study has evaluated the association between patient survival and the aberrant expression of Snail in glioblastoma patients. Interestingly, in our previous study, we first confirmed that the level of Snail protein was higher in glioma samples than in normal brain tissue using immunohistochemistry. Further, we determined a statistically significant positive correlation between Snail protein expression and the WHO grade of glioma [33]. In that study, we tried to ascertain a significant correlation between Snail expression and various clinicopathological factors, and a positive correlation was determined between Snail expression and the WHO grade of glioma. Glioblastoma, WHO grade IV, showed the highest protein expression as compared to other low-grade glial tumors. Based on these results, we hypothesize that Snail expression in glioblastoma is clinically significant. Therefore, to verify this assumption, we evaluated the effect of Snail gene expression on the proliferation, viability, cell cycle, and invasion and migration ability of glioblastoma cells. Knockdown of Snail gene expression showed increased E-cadherin and decreased vimentin expression at the transcriptional and protein level. Also, various functional studies demonstrated that inhibition of Snail expression reduced the proliferation and viability of glioblastoma cells and decreased the invasion and migration ability of glioblastoma cells. Inhibition of Snail gene expression was found to induce G1 arrest in cell cycle analysis. On comparison with our previous result, we ascertained that the association between Snail protein expression and the WHO grade of glial tumors may be due to the fact that increased Snail gene expression enhanced the proliferation, viability, and invasion ability of glioblastoma cells by promoting EMT induction. The glioblastoma was highly invasive and destructive, had higher proliferation activity, and was resistant to chemotherapy and radiotherapy. Although there were many factors associated with the proliferation, viability, and invasiveness of glioblastoma cells, we suggested that the expression of the Snail gene could be one of the regulation factors for determination of high proliferation activity and viability of glioblastoma cells. Also, we showed that Snail gene expression was significantly related to the highly invasive or destructive nature of glioblastomas. Therefore, our study revealed that Snail target therapy can be used for glioblastoma treatment and also suggested other possible target molecules for glioblastoma treatment.
Acknowledgements
This work was supported by grant from Seoul National University (0320110210) and authors have no conflicts of interest to declare.
Disclosure of conflict of interest
None.
References
- 1.Wong ML, Kaye AH, Hovens CM. Targeting malignant glioma survival signalling to improve clinical outcomes. J Clin Neurosci. 2007;14:301–308. doi: 10.1016/j.jocn.2006.11.005. [DOI] [PubMed] [Google Scholar]
- 2.D’Abaco GM, Kaye AH. Integrins: molecular determinants of glioma invasion. J Clin Neurosci. 2007;14:1041–1048. doi: 10.1016/j.jocn.2007.06.019. [DOI] [PubMed] [Google Scholar]
- 3.Lewis-Tuffin LJ, Rodriguez F, Giannini C, Scheithauer B, Necela BM, Sarkaria JN, Anastasiadis PZ. Misregulated E-cadherin expression associated with an aggressive brain tumor phenotype. PLoS One. 2010;5:e13665. doi: 10.1371/journal.pone.0013665. [DOI] [PMC free article] [PubMed] [Google Scholar]
- 4.Han SP, Kim JH, Han ME, Sim HE, Kim KS, Yoon S, Baek SY, Kim BS, Oh SO. SNAI1 is involved in the proliferation and migration of glioblastoma cells. Cell Mol Neurobiol. 2011;31:489–496. doi: 10.1007/s10571-010-9643-4. [DOI] [PMC free article] [PubMed] [Google Scholar]
- 5.Mikheeva SA, Mikheev AM, Petit A, Beyer R, Oxford RG, Khorasani L, Maxwell JP, Glackin CA, Wakimoto H, Gonzalez-Herrero I, Sanchez-Garcia I, Silber JR, Horner PJ, Rostomily RC. TWIST1 promotes invasion through mesenchymal change in human glioblastoma. Mol Cancer. 2010;9:194. doi: 10.1186/1476-4598-9-194. [DOI] [PMC free article] [PubMed] [Google Scholar]
- 6.Xia M, Hu M, Wang J, Xu Y, Chen X, Ma Y, Su L. Identification of the role of Smad interacting protein 1 (SIP1) in glioma. J Neurooncol. 2010;97:225–232. doi: 10.1007/s11060-009-0015-1. [DOI] [PubMed] [Google Scholar]
- 7.Peinado H, Olmeda D, Cano A. Snail, Zeb and bHLH factors in tumour progression: an alliance against the epithelial phenotype? Nat Rev Cancer. 2007;7:415–428. doi: 10.1038/nrc2131. [DOI] [PubMed] [Google Scholar]
- 8.Thiery JP. Epithelial-mesenchymal transitions in tumour progression. Nat Rev Cancer. 2002;2:442–454. doi: 10.1038/nrc822. [DOI] [PubMed] [Google Scholar]
- 9.Thiery JP, Sleeman JP. Complex networks orchestrate epithelial-mesenchymal transitions. Nat Rev Mol Cell Biol. 2006;7:131–142. doi: 10.1038/nrm1835. [DOI] [PubMed] [Google Scholar]
- 10.Gupta GP, Massague J. Cancer metastasis: building a framework. Cell. 2006;127:679–695. doi: 10.1016/j.cell.2006.11.001. [DOI] [PubMed] [Google Scholar]
- 11.Birchmeier W, Behrens J. Cadherin expression in carcinomas: role in the formation of cell junctions and the prevention of invasiveness. Biochim Biophys Acta. 1994;1198:11–26. doi: 10.1016/0304-419x(94)90003-5. [DOI] [PubMed] [Google Scholar]
- 12.Boulay JL, Dennefeld C, Alberga A. The Drosophila developmental gene snail encodes a protein with nucleic acid binding fingers. Nature. 1987;330:395–398. doi: 10.1038/330395a0. [DOI] [PubMed] [Google Scholar]
- 13.Nieto MA, Sargent MG, Wilkinson DG, Cooke J. Control of cell behavior during vertebrate development by Slug, a zinc finger gene. Science. 1994;264:835–839. doi: 10.1126/science.7513443. [DOI] [PubMed] [Google Scholar]
- 14.Rosivatz E, Becker I, Specht K, Fricke E, Luber B, Busch R, Hofler H, Becker KF. Differential expression of the epithelial-mesenchymal transition regulators snail, SIP1, and twist in gastric cancer. Am J Pathol. 2002;161:1881–1891. doi: 10.1016/S0002-9440(10)64464-1. [DOI] [PMC free article] [PubMed] [Google Scholar]
- 15.Elloul S, Elstrand MB, Nesland JM, Trope CG, Kvalheim G, Goldberg I, Reich R, Davidson B. Snail, Slug, and Smad-interacting protein 1 as novel parameters of disease aggressiveness in metastatic ovarian and breast carcinoma. Cancer. 2005;103:1631–1643. doi: 10.1002/cncr.20946. [DOI] [PubMed] [Google Scholar]
- 16.Blanco MJ, Moreno-Bueno G, Sarrio D, Locascio A, Cano A, Palacios J, Nieto MA. Correlation of Snail expression with histological grade and lymph node status in breast carcinomas. Oncogene. 2002;21:3241–3246. doi: 10.1038/sj.onc.1205416. [DOI] [PubMed] [Google Scholar]
- 17.Miyoshi A, Kitajima Y, Kido S, Shimonishi T, Matsuyama S, Kitahara K, Miyazaki K. Snail accelerates cancer invasion by upregulating MMP expression and is associated with poor prognosis of hepatocellular carcinoma. Br J Cancer. 2005;92:252–258. doi: 10.1038/sj.bjc.6602266. [DOI] [PMC free article] [PubMed] [Google Scholar]
- 18.Palmer HG, Larriba MJ, Garcia JM, Ordonez-Moran P, Pena C, Peiro S, Puig I, Rodriguez R, de la Fuente R, Bernad A, Pollan M, Bonilla F, Gamallo C, de Herreros AG, Munoz A. The transcription factor SNAIL represses vitamin D receptor expression and responsiveness in human colon cancer. Nat Med. 2004;10:917–919. doi: 10.1038/nm1095. [DOI] [PubMed] [Google Scholar]
- 19.Sugimachi K, Tanaka S, Kameyama T, Taguchi K, Aishima S, Shimada M, Tsuneyoshi M. Transcriptional repressor snail and progression of human hepatocellular carcinoma. Clin Cancer Res. 2003;9:2657–2664. [PubMed] [Google Scholar]
- 20.Yokoyama K, Kamata N, Fujimoto R, Tsutsumi S, Tomonari M, Taki M, Hosokawa H, Nagayama M. Increased invasion and matrix metalloproteinase-2 expression by Snail-induced mesenchymal transition in squamous cell carcinomas. Int J Oncol. 2003;22:891–898. [PubMed] [Google Scholar]
- 21.Yang MH, Chang SY, Chiou SH, Liu CJ, Chi CW, Chen PM, Teng SC, Wu KJ. Overexpression of NBS1 induces epithelial-mesenchymal transition and co-expression of NBS1 and Snail predicts metastasis of head and neck cancer. Oncogene. 2007;26:1459–1467. doi: 10.1038/sj.onc.1209929. [DOI] [PubMed] [Google Scholar]
- 22.Takeno S, Noguchi T, Fumoto S, Kimura Y, Shibata T, Kawahara K. E-cadherin expression in patients with esophageal squamous cell carcinoma: promoter hypermethylation, Snail overexpression, and clinicopathologic implications. Am J Clin Pathol. 2004;122:78–84. doi: 10.1309/P2CD-FGU1-U7CL-V5YR. [DOI] [PubMed] [Google Scholar]
- 23.Saito T, Oda Y, Kawaguchi K, Sugimachi K, Yamamoto H, Tateishi N, Tanaka K, Matsuda S, Iwamoto Y, Ladanyi M, Tsuneyoshi M. E-cadherin mutation and Snail overexpression as alternative mechanisms of E-cadherin inactivation in synovial sarcoma. Oncogene. 2004;23:8629–8638. doi: 10.1038/sj.onc.1207960. [DOI] [PubMed] [Google Scholar]
- 24.Roy HK, Smyrk TC, Koetsier J, Victor TA, Wali RK. The transcriptional repressor SNAIL is overexpressed in human colon cancer. Dig Dis Sci. 2005;50:42–46. doi: 10.1007/s10620-005-1275-z. [DOI] [PubMed] [Google Scholar]
- 25.Pena C, Garcia JM, Silva J, Garcia V, Rodriguez R, Alonso I, Millan I, Salas C, de Herreros AG, Munoz A, Bonilla F. E-cadherin and vitamin D receptor regulation by SNAIL and ZEB1 in colon cancer: clinicopathological correlations. Hum Mol Genet. 2005;14:3361–3370. doi: 10.1093/hmg/ddi366. [DOI] [PubMed] [Google Scholar]
- 26.Martin TA, Goyal A, Watkins G, Jiang WG. Expression of the transcription factors snail, slug, and twist and their clinical significance in human breast cancer. Ann Surg Oncol. 2005;12:488–496. doi: 10.1245/ASO.2005.04.010. [DOI] [PubMed] [Google Scholar]
- 27.Liu S, Kumar SM, Martin JS, Yang R, Xu X. Snail1 mediates hypoxia-induced melanoma progression. Am J Pathol. 2011;179:3020–3031. doi: 10.1016/j.ajpath.2011.08.038. [DOI] [PMC free article] [PubMed] [Google Scholar]
- 28.Li T, Zhu Y, Ren W, Xu S, Yang Z, Fang A, Qin C. High co-expression of vascular endothelial growth factor receptor-1 and Snail is associated with poor prognosis after curative resection of hepatocellular carcinoma. Med Oncol. 2012;29:2750–61. doi: 10.1007/s12032-012-0160-9. [DOI] [PubMed] [Google Scholar]
- 29.Kong D, Liang J, Li R, Liu S, Wang J, Zhang K, Chen D. Prognostic significance of snail expression in hilar cholangiocarcinoma. Braz J Med Biol Res. 2012;45:617–624. doi: 10.1590/S0100-879X2012007500070. [DOI] [PMC free article] [PubMed] [Google Scholar]
- 30.Imai T, Horiuchi A, Wang C, Oka K, Ohira S, Nikaido T, Konishi I. Hypoxia attenuates the expression of E-cadherin via up-regulation of SNAIL in ovarian carcinoma cells. Am J Pathol. 2003;163:1437–1447. doi: 10.1016/S0002-9440(10)63501-8. [DOI] [PMC free article] [PubMed] [Google Scholar]
- 31.Elloul S, Silins I, Trope CG, Benshushan A, Davidson B, Reich R. Expression of E-cadherin transcriptional regulators in ovarian carcinoma. Virchows Arch. 2006;449:520–528. doi: 10.1007/s00428-006-0274-6. [DOI] [PubMed] [Google Scholar]
- 32.Come C, Magnino F, Bibeau F, De Santa Barbara P, Becker KF, Theillet C, Savagner P. Snail and slug play distinct roles during breast carcinoma progression. Clin Cancer Res. 2006;12:5395–5402. doi: 10.1158/1078-0432.CCR-06-0478. [DOI] [PubMed] [Google Scholar]
- 33.Myung J, Cho BK, Kim YS, Park SH. Snail and Cox-2 expressions are associated with WHO tumor grade and survival rate of patients with gliomas. Neuropathology. 2010;30:224–231. doi: 10.1111/j.1440-1789.2009.01072.x. [DOI] [PubMed] [Google Scholar]
- 34.Yang HW, Menon LG, Black PM, Carroll RS, Johnson MD. SNAI2/Slug promotes growth and invasion in human gliomas. BMC Cancer. 2010;10:301. doi: 10.1186/1471-2407-10-301. [DOI] [PMC free article] [PubMed] [Google Scholar]
- 35.Cai MY, Luo RZ, Chen JW, Pei XQ, Lu JB, Hou JH, Yun JP. Overexpression of ZEB2 in peritumoral liver tissue correlates with favorable survival after curative resection of hepatocellular carcinoma. PLoS One. 2012;7:e32838. doi: 10.1371/journal.pone.0032838. [DOI] [PMC free article] [PubMed] [Google Scholar]
- 36.Kahlert C, Lahes S, Radhakrishnan P, Dutta S, Mogler C, Herpel E, Brand K, Steinert G, Schneider M, Mollenhauer M, Reissfelder C, Klupp F, Fritzmann J, Wunder C, Benner A, Kloor M, Huth C, Contin P, Ulrich A, Koch M, Weitz J. Overexpression of ZEB2 at the invasion front of colorectal cancer is an independent prognostic marker and regulates tumor invasion in vitro. Clin Cancer Res. 2011;17:7654–7663. doi: 10.1158/1078-0432.CCR-10-2816. [DOI] [PubMed] [Google Scholar]