

Abstract
Interactions of monomeric alpha-synuclein (αS) with lipid membranes have been suggested to play an important role in initiating aggregation of αS. We have systematically analyzed the distribution and self-assembly of monomeric αS on supported lipid bilayers. We observe that at protein/lipid ratios higher than 1:10, αS forms micrometer-sized clusters, leading to observable membrane defects and decrease in lateral diffusion of both lipids and proteins. An αS deletion mutant lacking amino-acid residues 71–82 binds to membranes, but does not observably affect membrane integrity. Although this deletion mutant cannot form amyloid, significant amyloid formation is observed in the wild-type αS clusters. These results suggest that the process of amyloid formation, rather than binding of αS on membranes, is crucial in compromising membrane integrity.
Introduction
The 14.4-kDa neuronal protein αS is a major component of Lewy bodies, which are a pathological hallmark of Parkinson’s disease (1). Neuronal death has been attributed to various causes (2–6), all of which involve the aggregation of αS into amyloid structures. Above a critical concentration, αS aggregates in vitro into oligomers and fibrils (7), with the details of aggregation depending on pH (8), salt (9), and temperature (8) conditions. There is increasing evidence that interactions with lipid bilayers play a role in αS aggregation (10,11), although there have been some unresolved debates in earlier literature (12,13).
Alpha-synuclein-lipid membrane interactions depend on the negative charge on the membrane (12). These interactions are mediated by positively charged residues located in seven imperfect repeats in the N-terminus of the protein (14,15). These repeats are reminiscent of lipid-membrane binding domains in apolipoproteins, with the first five repeats predicted and shown to form α-helices upon binding to negatively charged small unilamellar vesicles (SUVs) (16,17).
In vitro, the presence of negatively charged lipid membranes accelerates αS aggregation into amyloids (12). For other amyloid-forming proteins like Aβ and IAPP, membrane integrity is affected by extensive membrane remodeling and lipid extraction (18–23). There is increasing evidence that this is also the case for αS (11,24–27). Further, the report of measurable amounts of lipids in Lewy bodies (6) strongly suggests that the interaction of lipid membranes with αS is relevant in the aggregation process.
One of the major reasons for neuronal cell death in Parkinson’s disease is membrane damage (28–30). It is uncertain whether certain oligomeric species or the aggregation process itself causes the observed membrane damage. Moreover, the exact mechanism of this damage remains to be elucidated. Both monomers and oligomers of WT-αS have been shown to cause dye leakage in model membrane vesicles, consistent with a pore-like mechanism (31–34). However, this leakage is observed only at high surface charge densities indicating that other mechanisms may be important at physiologically relevant charge densities. WT-αS oligomers with a putative channel-like structure have been shown to induce single ion-channel currents in lipid membranes (35). Recent reports also indicate that addition of monomeric wild-type αS (WT-αS) causes membrane damage in supported lipid bilayers (SLBs) (24,26). Thus, it is unclear whether membrane damage is due to αS amyloid formation on the membrane or is a result of binding of αS species to the membrane. To distinguish between these two mechanisms for membrane damage, we studied a deletion mutant lacking amino-acid residues 71–82 (αS(Δ71–82)) that in solution fails to form amyloids but forms spherical oligomers with a diameter of ∼20 nm (36).
We used SLBs as a platform to visualize and measure the interactions of WT-αS and αS(Δ71–82) with membranes by confocal microscopy using fluorescently labeled SLBs and αS. We indirectly modulated the rate of aggregation of αS on the membrane surface by varying the negative lipid composition and thereby modulating the density of surface-bound protein. The presence of a charged protein on a charged membrane surface can influence lateral lipid diffusion and protein-protein interactions. We used fluorescence recovery after photobleaching (FRAP) to measure changes in the lateral diffusion coefficients of lipids to extract quantitative information about lipid phase and fluidity. FRAP was also used to probe diffusion of αS and its aggregation on the SLB surface. We observe that formation of amyloids by WT-αS results in lipid extraction and decreases the mobility of lipids in SLBs. Neither effect is observed with the deletion mutant even though it binds membranes with comparable affinity.
Materials and Methods
Stock solutions of POPC (1-palmitoyl-2-oleoyl-sn-glycero-3-phosphocholine), POPG (1-palmitoyl,2-oleoyl phosphatidylglycerol), and NBD-PC (1-palmitoyl-2-[6-[(7-nitro-2-1,3-benzoxadiazol-4-yl)amino]hexanoyl]-sn-glycero-3-phosphocholine) in chloroform were purchased from Avanti Polar Lipids (Birmingham, AL) and used without further purification. EDTA (ethylenediaminetetraacetic acid) was purchased from Sigma Chemical (St. Louis, MO). NaCl (sodium chloride), NaOH (sodium hydroxide), and HEPES (4-(2-hydroxyethyl)-1-piperazineethanessulfonic acid) were purchased from Merck (Darmstadt, Germany). Alexa Fluor 647 C2 maleimide and β-BODIPY FL C5-HPC (2-(4,4-difluoro-5,7-dimethyl-4-bora-3a,4a-diaza-s-indacene-3-pentanoyl)-1-hexadecanoyl-sn-glycero-3-phosphocholine) was purchased from Invitrogen (Carlsbad, CA).
Substrate pretreatment
Glass coverslips were washed in 2% Hellmanex (VWR International, Chicago, IL) at 80°C for 60 min, rinsed exhaustively with deionized water, and then dried with a stream of nitrogen. The slides were etched for 8 min in a solution of 3:1 (v/v) concentrated sulfuric acid (H2SO4) and 30% hydrogen peroxide (H2O2). The slides were stored in Milli-Q water (Millipore, Billerica, MA), and were used within 3 days after treatment.
Vesicle and supported lipid bilayer preparation
Lipid stock solutions of POPC and POPG in chloroform were mixed in 1:1 or 3:1 molar ratios, dried under a stream of nitrogen, and placed under vacuum for 1 h. After drying, the lipid films were rehydrated in 100 mM NaCl solution. Large unilamellar vesicles (∼500 μM in lipids) were prepared by extruding the solution 21 times through 100 nm polycarbonate membranes. The vesicles were stored at 4°C and used within 3 days. Supported lipid bilayers were formed by vesicle fusion inside a 120 μL custom-built chamber on appropriately treated glass slides. The extruded vesicles were mixed with 750 mM NaCl solution at a 1:1 ratio to induce fusion as reported in Pandey et al. (37). After 20 min incubation, excess vesicles were removed from the chamber by rinsing with a 50 mM HEPES, 0.1 mM EDTA, and 750 mM NaCl, pH 7.4 buffer. Thereafter the chamber was rinsed with 50 mM HEPES, 0.1 mM EDTA, pH 7.4 buffer to remove salt. At least 3 mL of buffer were passed through the chamber to ensure complete solvent exchange.
Expression, purification, and labeling of αS
Because WT-αS does not contain any cysteine residues necessary for fluorescent labeling, an alanine to cysteine mutation was introduced at residue 140. The WT-αS-A140C mutant was expressed in Escherichia coli strain BL21 (DE3) using the pT7-7 expression plasmid and purified in the presence of 1 mM DTT as previously reported in van Raaij et al. (38). The cDNAs for the deletion mutant of αS lacking 71–82 residues (αS(Δ71–82)) were obtained from Prof. Benoit Giasson from the University of Florida (Gainesville, FL). The cDNA was cloned into a pT7-7 expression plasmid and purified. For labeling αS(Δ71–82), an alanine to cysteine mutation was introduced at residue 140 as for the WT-αS. Before labeling, both WT-αS-A140C and αS(Δ71–82)-A140C were reduced with a fivefold molar excess of DTT for 30 min at room temperature. The samples were desalted with Zeba desalting columns (Pierce, Rockford, IL), followed by the addition of a twofold molar excess of Alexa 647 (AL647) C2 maleimide dye (Invitrogen) and incubated for 2 h in the dark at room temperature. Free label was removed using two desalting steps. The protein labeling efficiency was estimated to be 90% from the absorption spectrum. Before use, the protein was diluted with 50 mM HEPES, 0.1 mM EDTA, pH 7.4 buffer to the desired concentrations.
Imaging of supported lipid bilayers and proteins
All measurements were performed on a model A1 confocal microscope equipped with a perfect focus system (Nikon, Tokyo, Japan). SLBs were visualized by incorporating 0.25 mol % BODIPY-PC. To visualize the proteins, a mixture of 25% labeled and 75% unlabeled protein was used. The SLBs were prepared as reported in Pandey et al. (37). In a typical experiment, exactly two times the chamber volume (∼240 μL) of the desired concentrations of the protein was flushed into the perfusion chamber with an oil-free pump. The proteins were incubated with the SLBs for 18 h at room temperature. Thereafter the unbound protein was washed off with 50 mM HEPES, 0.1 mM EDTA, pH 7.4 for 10 min to remove background fluorescence from the unbound protein in the solution. Although the washing step could potentially lead to desorption, within the time frame of the measurements we see <10% decrease in the protein fluorescence from these bilayer systems. Images were acquired using a 63× water immersion, 1.30 NA objective combined with a 2× optical zoom. The acquired images consisted of 512 × 512 pixels with a pixel size of 0.41 × 0.41 μm. All images were collected under identical conditions of power and gain. For visualization purposes only, the contrast threshold was set to a constant value, allowing comparison of all images.
Image processing and cluster analysis
The NIS ELEMENTS ObjectCount module (Nikon) was used for area estimation of αS clusters. Using intensity thresholding, areas of αS clusters were calculated automatically from the pixel areas in at least 10 images per protein concentration. Because the number of clusters and their sizes depend directly on the level of the threshold set, we systematically varied the threshold (see Fig. S1 in the Supporting Material) to choose an optimum threshold. For each image, the intensity threshold was fixed to 1.5 times the peak intensity of its intensity histogram, avoiding under- or over-sampling. The cluster area distribution for each protein concentration was fit to a log-normal distribution to get an average cluster area (39).
Fluorescence recovery after photobleaching
FRAP was used to determine the diffusivity of lipids in the bilayer and of the labeled protein on the lipid bilayer after incubation. FRAP was performed on a model A1 confocal microscope (Nikon). A 100-mW Argon ion laser (488 nm; Coherent, Santa Clara, CA) was used to both bleach and monitor the lipid bilayer fluorescence. A 30-mW laser (647 nm; Coherent) was used to bleach and monitor protein fluorescence. In the FRAP experiment, fluorescence from a circular region of interest (ROI) was bleached (radius ∼12 μm) in 1.5 s. After bleaching, the increase in fluorescence intensity in the ROI was monitored for 8 min. During the experiment, there was only a minimal drop in the fluorescence intensity in the reference ROI. All FRAP data were fitted using the Soumpasis fit (40), which has been shown to better model membrane/protein diffusivity than a single exponential fit (41), yielding the diffusion coefficients and mobile fractions of the probed entity.
Circular dichroism spectroscopy
A model J-715 spectropolarimeter (Jasco, Tokyo, Japan) was used to obtain circular dichroism (CD) spectra at protein concentrations of 3 μM in solution. Spectra were recorded between 190 and 260 nm with a step size of 0.5 nm and a scanning speed of 10 nm/min using a 1-mm path length cuvette. The apparent dissociation constants (Kdapp) for both proteins were determined by titrating them against POPC/POPG (50:50) SUVs and fitting the measured mean residue ellipticity at 222 nm, R, to the solution of the binding equilibrium equation:
| (1) |
By assuming equilibrium binding and applying the law of mass action, solving for R, we obtain
| (2) |
where R is the measured signal (MRE (Mean Residual Ellipticity) at 222 nm, corrected for dilution) at a given lipid concentration, L is the total lipid concentration, and P is the total concentration of the protein. Kdapp is the apparent macroscopic dissociation equilibrium constant, and n is the binding stoichiometry (lipids/protein). The values Rf and Ro are the final (corrected for dilution) and initial mean residue ellipticities, respectively. This equation assumes that all lipid-binding sites are equivalent and that Kdapp does not depend on the lipid/protein ratio (L/P) (42). Because αS adopts a helical conformation upon membrane binding (16), titration of WT-αS and αS(Δ71–82) with POPC/POPG (1:1) SUVs allows an estimate of Kdapp from the characteristic band at 222 nm.
Results
WT-αS and αS(Δ71–82) bind lipid membranes with comparable affinities
To compare the clustering and possible aggregation of WT-αS and αS(Δ71–82) on lipid membranes, the binding of both proteins to SLBs has to be comparable. We used CD spectroscopy to measure binding affinities of αS(Δ71–82) and WT-αS to POPC/POPG (1:1) SUVs (42) (Materials and Methods). The data (Fig. 1) show that the binding affinities of both constructs to the lipid bilayer are comparable. Although the WT-αS and αS(Δ71–82) exhibit similar binding affinities to lipid membranes, they show different aggregation behavior in solution. In absence of membranes, αS(Δ71–82) does not form fibrillar amyloids (36) and aggregation arrests at an oligomeric stage (43), whereas WT-αS readily aggregates into cross-β-sheet-rich amyloid structures. Aggregation experiments under our experimental conditions confirmed this reported difference in aggregation behavior (see Fig. S2).
Figure 1.
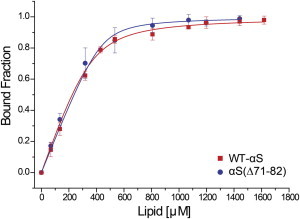
Binding of WT-αS and αS(Δ71–82)with POPC/POPG liposomes. Titration of WT-αS (red squares) and αS(Δ71–82) (blue circles) by POPC/POPG (50:50) SUVs. The bound fractions were obtained by measuring mean residual ellipticities at 222 nm by CD spectroscopy (Materials and Methods). The binding curve was generated by fitting normalized ellipticity values to Eq. 2 (solid lines), assuming equivalent binding sites. The error bars indicate standard deviations from three independent measurements. To see this figure in color, go online.
WT-αS and αS(Δ71–82) self-assemble differently on POPC/POPG (1:1) SLBs
Upon systematically varying the concentration of αS on POPC/POPG (1:1) SLBs, we observed that both WT-αS and αS(Δ71–82) organized into clusters on the SLB surface. Although the binding affinities of these proteins were comparable, there was a clear difference in the organization of these clusters (Fig. 2), obtained upon incubation of 10 μM protein on SLBs after 18 h (P/L ratio ∼1:1).
Figure 2.
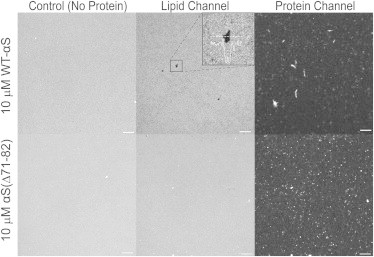
Clustering of WT-αS and αS(Δ71–82) on POPC/POPG supported lipid bilayers. Representative images of SLBs after adsorption of 10 μM αS for 18 h. The protein images show bigger and more heterogeneous WT-αS protein aggregates on 50% POPG-containing bilayers as compared to those of αS(Δ71–82) mutant. There appears to be little correlation between the defects on the SLBs and the bigger aggregates. The lipid images show the appearance of cracks and defects in the top panels (WT-αS). (Inset) Enhanced magnification. The sparse lipid clustering (seen as bright spots) was also seen in the controls and αS(Δ71–82) aggregates do not seem to have a preference for these regions. Fewer and smaller defects appear in the presence of αS(Δ71–82) and the average intensity remains the same. Images are contrasted to the same extent to facilitate comparison. All experiments were performed at room temperature in 50 mM HEPES, pH 7.4, 0.1 mM EDTA buffer. The scale bar is 10 μm.
WT-αS assembles into a heterogeneous distribution of clusters of both small and large areas, whereas clusters of αS(Δ71–82) are more homogenous in size. Upon decreasing the P/L ratio, we observe that assembly of both WT-αS (see Fig. S3) and αS(Δ71–82) clusters (see Fig. S4) are sensitive to protein concentration, with cluster size increasing as a function of protein concentration. To obtain a quantitative overview of protein cluster size, we estimated average cluster areas (Materials and Methods) by fitting the measured area distribution to a log-normal distribution. Fig. 3 depicts the correlation between the protein concentration and average cluster areas.
Figure 3.
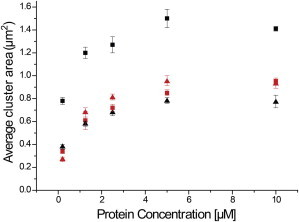
Average cluster areas of αS on SLBs with changing protein concentration and lipid composition. Average cluster areas obtained by fitting the area distributions obtained from αS aggregates on POPC/POPG SLBs. Upon increasing protein concentration, there is a twofold increase in the average cluster areas irrespective of the lipid composition for both WT-αS and αS(Δ71–82). However, for a given protein concentration, αS(Δ71–82) clusters (red symbols) show little dependence on lipid composition contrary to that observed for the WT-αS clusters (black symbols). Cluster areas for WT-αS and αS(Δ71–82) on 50% POPG SLBs (squares) and 25% POPG SLBs (triangles). The error bars indicate standard errors in each case. The statistics underlying the values presented here are shown in Table S1 in the Supporting Material. To see this figure in color, go online.
As shown in Fig. 3, we obtained αS cluster areas from incubation of WT-αS and αS(Δ71–82) on POPC/POPG (75:25) SLBs (see Fig. S5). This experiment was done to investigate whether the percentage of negatively-charged lipids influenced the clustering of αS on SLBs. The WT-αS clusters are consistently smaller on less negatively charged SLBs (i.e., 25 vs. 50% POPG content). The histograms of the cluster areas (see Fig. S6) show a more heterogeneous distribution (larger widths) for the WT-αS clusters at all concentrations. The smallest calculated cluster area using our thresholding parameters is 0.04 μm2, which corresponds to the pixel area in the image. We cannot make any conclusive predictions about the size or aggregation number (number of monomers) of αS structures inducing membrane damage. At these high P/L ratios (1:1), it has been previously reported that WT-αS forms amyloid structures depending on the percentage of negative charge in the lipid membranes (12). Our observations show a charge-dependent increase in the size of WT-clusters on SLBs at high P/Ls.
To establish whether the observed WT-αS clusters contain amyloid, SLBs containing 10 μM WT-αS clusters were incubated with 50 μM of ThT (ThioflavinT) for 1 h. After washing off unbound ThT, most of the clusters seen in the protein channel were found to be positive for ThT fluorescence (Fig. 4), confirming the formation of amyloid aggregates on the SLB surface (18,24). The average intensities in all ThT-positive clusters were at least 150 times higher than background intensities. It is interesting to note that not all clusters of WT-αS are positive for ThT fluorescence (Fig. 4 B).
Figure 4.
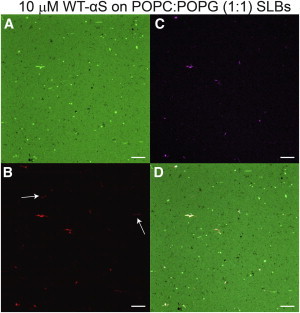
ThioflavinT (ThT) staining of WT-αS aggregates. Representative fluorescence images depicting the lipid channel (A) and protein channel (B) after 18 h incubation of 10 μM labeled WT-αS on POPC/POPG SLB. (White arrows) Aggregates of WT-αS which are not positive for ThT. (C) Fluorescence images taken after ThT staining. (D) Overlay of all channels. Lipid composition of the bilayer was POPC/POPG/BODIPY-PC, 50:49.75:0.25 (mol/mol). All images were taken at room temperature in 50 mM HEPES, 0.1 mM EDTA, pH 7.4 buffer. The scale bar is 10 μm. To see this figure in color, go online.
To investigate whether the clusters of WT-αS can reorganize and grow into bigger amyloid aggregates, we incubated the aggregates formed from 10 μM WT-αS after 18 h on POPC/POPG (1:1) SLBs for another 24 h. As expected for amyloid growth, we observe a marked increase in the protein aggregate size, as shown in Fig. 5. Closer inspection of the WT-αS amyloid aggregates in Fig. 5 show evidence of lipid fluorescence (arrows in Fig. 5). This may be a result of lipids being extracted out of the membrane upon amyloid formation. We see fewer protein aggregates at this stage, which suggests that smaller aggregates fuse into bigger structures; however, an alternative explanation could be that the aggregates desorb from the membrane.
Figure 5.
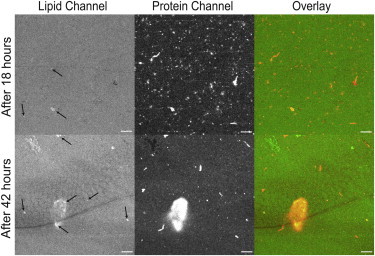
Time-dependent growth of WT-αS aggregates on POPC/POPG (50:50) SLBs. The images shown are representative endpoint images obtained after incubation of 10 μM WT-αS on POPC/POPG (50:50) after 18 h (top panel) and the same bilayer incubated for another 24 h (bottom panel). Upon incubation for 18 h, large aggregates are seen on the bilayer surface but these aggregates do not coincide with regions of high membrane damage. After 42 h, very large aggregates appear that in some regions appear to incorporate lipids. (Solid arrows) Lipids lining along the shape of the aggregate suggesting incorporation. Images are contrasted to the same extent to facilitate proper comparison. All experiments were performed at room temperature in 50 mM HEPES, pH 7.4, 0.1 mM EDTA buffer. The scale bar is 10 μm. To see this figure in color, go online.
Aggregation of αS affects lipid membrane mobility
Protein aggregation on SLBs requires that the observed clusters are mobile on the bilayer. This mobility would be affected by the protein-protein interactions required for aggregation into amyloid fibrils. The dependence of protein clustering on lipid composition further suggests that there are specific lipid-protein interactions. To characterize the aggregation state of αS, we used FRAP to probe the diffusion of WT-αS and αS(Δ71–82) on SLBs. We observed that at 10 μM protein concentration the diffusion coefficient of WT-αS (DαS) had a much lower value (∼0.14 μm2/s) than that for αS(Δ71–82) (∼1.1 μm2/s) (Fig. 6 A). The αS(Δ71–82) mutant diffuses much faster than the WT-αS at all protein concentrations. We attribute the faster diffusion to significantly reduced interactions between αS(Δ71–82) species as compared to that of WT-αS. Consistent with strong protein-protein interactions and amyloid formation we observed a decrease (up to 30%) in the mobile fraction of the WT-αS species with increasing concentrations of the protein (Fig. 6 B).
Figure 6.
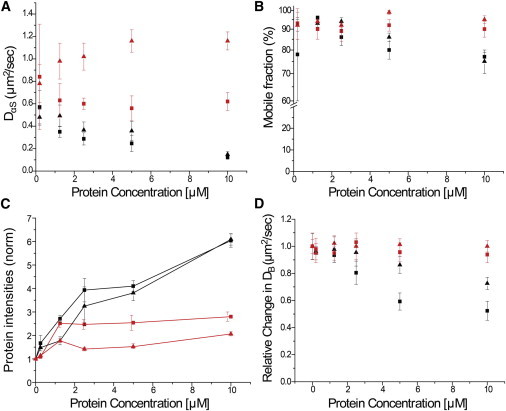
Effects of adsorption of αS on lipid and protein dynamics of the SLBs. In all the figures, measurements with WT-αS are shown (black symbols), and those with αS(Δ71–82) (red symbols); measurements on 50% POPG-containing membranes (square symbols) and those on 25% POPG-containing membranes (triangular symbols). (A) Apparent protein diffusion coefficients (DαS). (B) Mobile fractions in protein channel obtained from FRAP upon incubation of αS WT-αS and αS(Δ71–82) on POPC/POPG SLBs in increasing concentrations. (C) Average intensities (normalized to background of red channel) obtained from protein channels after 18 h incubation and removal of unbound protein. The WT-αS clearly shows a concentration-dependent rise in adsorbed protein irrespective of % of negative charge on SLBs, whereas αS(Δ71–82) intensities do not change with concentration. (D) Protein concentration-dependent changes in lateral diffusion coefficients of BODIPY-PC (DB) relative to that in the absence of protein. The error bars indicate standard deviation obtained from five independent measurements in panels A–C and from 10 independent measurements in panel D. All experiments were performed at room temperature in 50 mM HEPES, pH 7.4, 0.1 mM EDTA buffer. Note: the protein diffusion measurements (B and C) at 200 nM had poor signal/background and therefore much poorer fits to the recovery curves and greater variability in both diffusion coefficient and mobile fractions estimates. To see this figure in color, go online.
The mobile fraction of αS(Δ71–82) does not change. We analyzed the average fluorescence intensities from the protein channel after incubation of labeled WT-αS and αS(Δ71–82) on POPC/POPG SLBs. SLBs incubated with different concentrations of WT-αS showed a linear increase in fluorescence intensity whereas SLBs with αS(Δ71–82) did not. Intriguingly, a similar trend was observed with WT-αS upon decreasing the percentage of negative lipids in the SLBs (Fig. 6 C). After incubation for 18 h, the unbound protein was washed off. Because the binding affinities of WT-αS and αS(Δ71–82) were comparable, the SLBs should be fully covered with αS at all concentrations used. Thus, after the washing step, the fluorescence intensity should have been comparable for SLBs incubated with WT-αS and αS(Δ71–82). The fact that we see an increase in fluorescence intensity with increasing concentration of WT-αS suggests direct adsorption of incoming WT-αS onto attached WT-αS species. A higher intensity could also be a result of compaction of existing aggregates into ordered structures, thereby creating space for incoming monomers.
To investigate the effect of αS binding on lateral mobility of lipids in POPC/POPG SLBs, we used FRAP with BODIPY-PC as a fluorescent lipid probe. The diffusion coefficient of BODIPY-PC in the absence of protein was found to be ∼1.25 μm2/s, similar to values reported in the literature for lateral diffusion of lipids in SLBs on glass surfaces (44,45). The lipids were completely mobile (mobile fraction >98%) and SLBs were found to be stable over an incubation period of at least 42 h. Increasing concentrations of WT-αS (P/L ratios from 0.02 to 1) were incubated on separate SLBs for 18 h. After 18 h incubation with WT-αS, a drop in the diffusion coefficient of BODIPY-PC in SLBs was observed with increasing P/L values. At P/L < 0.1, there is little effect on the lipid bilayer fluidity, but starting from P/L ∼ 0.1, we observe a drop in the diffusion coefficient of BODIPY-PC (DB) (Fig. 6 D). The mobile fraction of BODIPY-PC remained unchanged upon incubation of WT-αS and αS(Δ71–82) at all protein concentrations and lipid compositions. DB dropped by ∼55% and ∼30% on 50% POPG and 25% POPG SLBs, respectively. Upon incubation of similar concentrations of αS(Δ71–82) on POPC/POPG SLBs, we found no change in the apparent diffusion coefficients of BODIPY-PC in either lipid composition as seen in Fig. 6 D. The increase in the protein aggregate size coincides with the drop in DB. Thus, formation of small protein clusters is not enough to decrease the lateral diffusion of lipids, whereas aggregation of αS into larger clusters and/or amyloids with typical cross-β sheets is correlated with the decreased lateral diffusion of SLBs.
Amyloid formation and lipid extraction are correlated
To probe the effects of WT-αS aggregation and αS(Δ71–82) clustering on the integrity of SLBs, we systematically varied the concentration of αS on SLBs. BODIPY-PC at 0.25 mol % was incorporated to visualize the SLBs. In the absence of protein, the bilayers were devoid of defects, cracks, or any other inhomogeneities resolvable by our confocal microscope (Fig. 2; Control). Upon adding increasing concentrations of WT-αS to separate SLBs, we observe a general loss of BODIPY-PC fluorescence intensity and appearance of defects with no lipid present (black regions in images) and patterns of elongated cracks with lower-than-average fluorescence intensities, suggesting damage to the SLBs (Fig. 2) after 18 h.
We observed that the extent of this damage seems to reduce as the protein concentration is reduced (P/L from 1 to 0.02) (see Fig. S3). In contrast to what was observed with WT-αS, when αS(Δ71–82) is added to the SLBs, there was much less evidence of damage to SLBs (see Fig. S4). However, αS(Δ71–82) did form smaller clusters on the bilayer surface, as seen in Fig. 2. Control experiments involving SLBs incubated in buffer show no such damage over the timescale of the experiments. Moreover, these SLBs show negligible loss in BODIPY-PC fluorescence intensity over a period of at least 42 h. The onset of aggregation of WT-αS to form amyloid structures is faster with increasing composition of negatively charged lipids (12). Accordingly, to probe whether amyloid formation was involved in the observed membrane damage, we decreased the proportion of negative lipids. Upon incubation of 10 μM protein on POPC/POPG (75:25) SLBs for 18 h, we found that WT-αS causes fewer and smaller defects, whereas αS(Δ71–82) mutants show almost no defect formation (see Fig. S5).
We measured the lipid fluorescence in the buffer solution above the SLBs before and after incubation with protein for 18 h. After protein incubation, there is a concentration dependent increase in lipid fluorescence. This increase is ∼3–4-fold larger for WT-αS than for αS(Δ71–82) (see Fig. S7). These results suggest that the general loss of lipid fluorescence after incubation with WT-αS could be due to lipid extraction. We suggest that formation of amyloid structures in WT-αS occurs concurrently with extraction of lipids from the SLBs.
To test whether loss in membrane fluidity, membrane damage, and aggregate formation are influenced by the BODIPY probe, SLBs containing a small fraction of NBD-PC lipids were incubated with 5 μM and 10 μM WT-αS. Similar defects, cracks in the lipid membrane, and protein aggregate formation were observed. We conclude that the specific fluorescent probe does not influence our observations. We find the same decrease in DB upon incubation with unlabeled protein (5 μM and 10 μM WT-αS) rather than 25% labeled and 75% unlabeled protein, confirming that there is no significant effect on DB from adding the fluorophores.
Discussion
WT-αS and αS(Δ71–82) behave differently on SLBs. Collectively, the data presented here shows that the adsorption of protein to the membrane surface results in protein clustering. Depending on the interactions between proteins, this clustering can result in the formation of amyloid, which causes significant perturbations in the bilayer structure and dynamics.
As the concentration of WT-αS is increased, the lipid structure is altered by formation of defects that appear to be devoid of lipid and by formation of a pattern of cracks with fewer lipids. Concurrently, the rate of diffusion of the lipid decreases, suggesting that diffusion is either hindered by the formation of cracks or slowed down by a strong association of lipid with protein clusters. As the concentration of αS(Δ71–82) mutant is increased, there are a few defects but there is no evidence of other perturbations to the lipid membranes. We see no cracks and DB is unaffected. There is also minimal loss of lipid. The perturbations by the WT-αS on the SLBs become more severe as the time of incubation is increased from 18 to 42 h. It is also important to note that there are no defects or lipid loss in samples without protein even after 42 h.
The effects of the WT-αS on the membrane fluidity and integrity are generally lipid-composition-dependent and more pronounced at high fractions of negatively charged lipids (POPG). Changing the composition of the lipid does not change the effects of the αS(Δ71–82) mutant on these membrane properties. Both WT-αS and αS(Δ71–82) are expected to adsorb on the membrane in comparable amounts owing to their comparable membrane binding. However, as the protein concentration is increased the amount of adsorbed WT-αS increases linearly, whereas there is no change in the amount of adsorbed αS(Δ71–82) mutant. Interestingly, the adsorption of the αS(Δ71–82) mutant is lower on membranes with lower proportion of charged lipids, whereas that of the WT-αS is not. This is consistent with the additional adsorption of the WT-αS arising from protein-protein binding rather than protein-lipid binding.
Both the WT-αS and αS(Δ71–82) mutant appear to form small clusters of protein on the surface. As the concentration increases, the average area of these clusters increase by approximately a factor of two. At all concentrations, the average cluster area of the WT-αS is larger on the highly charged membranes. This agrees with the earlier observations that at high protein/lipids, a high percentage of negative lipids increases the rate of aggregation of WT-αS (12). Moreover, WT-αS is seen to form very large clusters of protein at high concentrations and longer incubation times. These large clusters are stained positively by ThT, supporting the conclusion that the proteins in the clusters tend to aggregate into amyloid fibrils. Such large ThT positive structures are not observed for the deletion mutant. The largest amount of membrane damage occurs when amyloid structures form.
Therefore, the most likely explanation for the observed membrane damage would be the aggregation of WT-αS into amyloids characterized by a significant cross-β sheet component on the membrane surface. The evidence for the extent of membrane damage is indirect, but support the conclusion that both lipid leaflets are removed because the fluorescence in these regions is reduced to background levels. In the cracks, the fluorescence is reduced, but not to the background levels, so these perturbations may be limited to the top leaflet. Defects in the SLBs are seen starting from P/L ratios of 1:10 and increase in frequency with higher concentrations. Vesicle permeabilization assays showed hardly any dye efflux with POPC/POPG large unilamellar vesicles (34), motivating us to test an alternative mechanism. Our data are consistent with a mechanism of membrane damage including lipid extraction and incorporation in amyloid structures.
Prior reports also suggest that αS mutants having higher aggregation propensity cause significantly greater membrane damage in SLBs (24) or increased cell death of dopaminergic neurons in a rat model (46). Thus, aggregation into amyloids is likely to be the prerequisite for membrane damage. Previous studies on interaction of WT-αS with POPC/POPS (1:1) (17) and POPC/POPA (1:1) (12) supported lipid bilayers using atomic force microscopy also reveal defects and membrane disruption with formation of protein aggregates on the bilayer surface. Recent studies with model vesicles suggest a membrane thinning mechanism (47). WT-αS has previously been shown to cause phase separation and protein clustering to eggPG-rich domains (37,48) in eggPC/eggPG (50:50) SLBs. In our experiments, we do not observe phase separation upon addition of WT-αS; this may be attributed to the choice of lipids. Aggregate sizes similar to those observed for αS have also been observed for β-amyloid (1–40) on POPC/POPG SLBs (49).
The rate of diffusion of the WT-αS is lower than that of the αS(Δ71–82) mutant at all concentrations and for both lipid compositions. Whereas the WT-αS diffusion decreases at higher concentrations, that of the αS(Δ71–82) mutant does not. Correspondingly, the fraction of mobile WT-αS decreases at high concentrations whereas the αS(Δ71–82) mutant remains fully mobile. The decrease in mobile fraction of WT-αS is consistent with the formation of large amyloid aggregates and to the change in the lipid diffusion, suggesting a correlation between the two effects.
The diffusivity of the WT-αS is independent of the lipid composition of the SLBs. However, the αS(Δ71–82) mutant moves significantly faster on the less charged membrane. This may be related to the observation that there is less protein adsorbed, which would suggest that the protein diffusion is sensitive to protein concentration on the surface. Because there appears to be no difference in the average cluster area for the αS(Δ71–82) mutant on two differently charged membranes, the difference in protein diffusion is not related to the cluster sizes.
If the changes in lipid and protein diffusion are linked, it could arise from direct protein-lipid bilayer interactions. This notion is supported by the observation that the large aggregates colocalize with lipids. The diffusion of the lipid DB is therefore retarded by the diffusion of the protein DαS in proportion to the amount bound to the protein as
| (3) |
where Df is the measured diffusion coefficient of BODIPY-PC in absence of any protein and fa is the fraction of lipid bound. This relation assumes a rapid exchange between free and bound lipid on the timescale of the recovery of fluorescence (minutes). Table 1 shows the calculated fractions (fa) as a function of protein concentration. The value fa increases with protein concentration and with the fraction of negatively-charged lipids in the SLBs in a self-consistent manner. Although BODIPY-PC exhibits reduced lateral mobility upon incubation with WT-αS, its mobile fraction remains close to unity at all protein concentrations used. This suggests that BODIPY-PC is not immobilized beneath or around the clusters. Thus, the lipids in the SLBs must be able to exchange within the timescale of the measurement of fluorescence recovery.
Table 1.
Cluster-associated fractions of BODIPY-PC on POPC/POPG SLB
| Protein concentration (μM) | Measured DB (μm2/s) | Measured DαS (μm2/s) | fa (from model) | |
|---|---|---|---|---|
| WT-αS on POPC/POPG (50:50) SLBs | 10 | 0.75 ± 0.07 | 0.15 ± 0.02 | 0.39 ± 0.06 |
| 5 | 0.81 ± 0.06 | 0.36 ± 0.09 | 0.42 ± 0.06 | |
| 2.5 | 0.87 ± 0.09 | 0.37 ± 0.07 | 0.33 ± 0.07 | |
| 1.25 | 1.08 ± 0.05 | 0.49 ± 0.10 | 0.11 ± 0.04 | |
| 0.20 | 1.14 ± 0.03 | 0.48 ± 0.07 | 0.05 ± 0.03 | |
| WT-αS on POPC/POPG (75:25) SLBs | 10 | 0.84 ± 0.04 | 0.12 ± 0.01 | 0.31 ± 0.02 |
| 5 | 1.04 ± 0.06 | 0.25 ± 0.07 | 0.18 ± 0.03 | |
| 2.5 | 1.10 ± 0.10 | 0.29 ± 0.05 | 0.12 ± 0.04 | |
| 1.25 | 1.08 ± 0.09 | 0.35 ± 0.05 | 0.09 ± 0.04 | |
| 0.20 | 0.97 ± 0.06 | 0.57 ± 0.15 | 0.14 ± 0.11 | |
| αS(Δ71–82) on POPC/POPG (50:50) SLBs | 10 | 1.05 ± 0.04 | 0.62 ± 0.08 | 0.05 ± 0.03 |
| 5 | 1.02 ± 0.04 | 0.56 ± 0.11 | 0.06 ± 0.02 | |
| 2.5 | 1.13 ± 0.09 | 0.60 ± 0.05 | 0.04 ± 0.01 | |
| 1.25 | 1.04 ± 0.05 | 0.63 ± 0.15 | 0.04 ± 0.02 | |
| 0.20 | 1.02 ± 0.07 | 0.84 ± 0.47 | 0.10 ± 0.05 | |
| αS(Δ71–82) on POPC/POPG (75:25) SLBs | 10 | 1.21 ± 0.06 | 1.16 ± 0.08 | 0.08 ± 0.03 |
| 5 | 1.21 ± 0.07 | 1.16 ± 0.10 | 0.08 ± 0.05 | |
| 2.5 | 1.49 ± 0.02 | 1.02 ± 0.12 | 0.04 ± 0.01 | |
| 1.25 | 1.42 ± 0.05 | 0.98 ± 0.16 | 0.03 ± 0.02 | |
| 0.20 | 1.09 ± 0.08 | 0.78 ± 0.17 | 0.06 ± 0.04 |
Clusters associated with fraction fa obtained from Eq. 3. This fraction increases with the protein concentration and fraction of negative lipids. Note: the protein diffusion measurements at 200 nM had poor signal/background and therefore much poorer fits to the recovery curves and greater variability in both diffusion coefficients (DαS) and mobile fractions estimates. The error bars indicate standard deviations from five independent measurements.
A model for aggregation of αS on SLBs
Our operating model for the action of αS on SLBs is illustrated in Fig. 7. Alpha-synuclein initially binds the charged lipids in the membranes via a conformational change that involves the formation of amphipathic α-helical structures. These adsorbed proteins interact to form small clusters that are the end points for the self-assembly of the αS(Δ71–82) mutant. However, in the WT-αS, clustering is followed by aggregation allowing additional adsorption of the protein, and leading to amyloid-containing protein aggregates. These aggregates bind strongly to negatively-charged lipids (POPG), thereby reducing the effective mobility of the lipid mixture. The clusters weakly associate with POPC because the mobile fraction of BODIPY-PC is unchanged. If the protein aggregate detaches from the membrane, it would lead to lipid loss.
Figure 7.
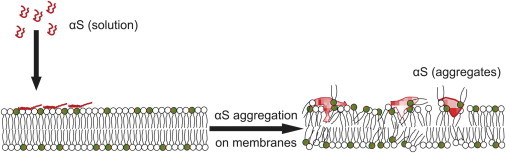
Model for lipid membrane disruption by α-synuclein. To see this figure in color, go online.
Conclusions
We report that aggregation of WT-αS on lipid membranes leads to formation of amyloid structures that grow in time. This conversion of monomeric WT-αS to amyloid structures composed of lipids and WT-αS is accompanied by significant membrane damage, lipid extraction, and reduced lateral mobility of lipids in SLBs. This happens more prominently at high protein to lipid ratios. The αS(Δ71–82) mutant fails to form amyloids on the bilayer surface and thus is not able to damage lipid membranes. Overall, our data suggests that aggregation of WT-αS on lipid membranes affects membrane integrity. Whether the membrane damage observed in our experiments arises from a distinct amyloid species or the process of amyloid formation remains to be established.
Acknowledgments
The authors thank Professor Benoit I. Giasson from the University of Florida for providing the plasmids for the αS(Δ71-82) synuclein construct, Kapil Dev Singh from University of Zürich for providing a script for data analysis, and Nathalie Schilderink from the University of Twente for assistance with αS expression, purification, and labeling.
This work was performed in the program entitled “A Single Molecule View on Protein Aggregation”, part of the research program of the Foundation for Fundamental Research on Matter (FOM), which is part of the Netherlands Organization for Scientific Research (NWO). N.O.P.’s visit to the Netherlands was supported by visitors travel grant No. 040-11-389 from the Netherlands Organization for Scientific Research.
Supporting Material
References
- 1.Spillantini M.G., Schmidt M.L., Goedert M. Alpha-synuclein in Lewy bodies. Nature. 1997;388:839–840. doi: 10.1038/42166. [DOI] [PubMed] [Google Scholar]
- 2.Fiskum G., Starkov A., Chinopoulos C. Mitochondrial mechanisms of neural cell death and neuroprotective interventions in Parkinson’s disease. Ann. N. Y. Acad. Sci. 2003;991:111–119. doi: 10.1111/j.1749-6632.2003.tb07469.x. [DOI] [PubMed] [Google Scholar]
- 3.Polymeropoulos M.H., Lavedan C., Nussbaum R.L. Mutation in the α-synuclein gene identified in families with Parkinson’s disease. Science. 1997;276:2045–2047. doi: 10.1126/science.276.5321.2045. [DOI] [PubMed] [Google Scholar]
- 4.Nemani V.M., Lu W., Edwards R.H. Increased expression of α-synuclein reduces neurotransmitter release by inhibiting synaptic vesicle reclustering after endocytosis. Neuron. 2010;65:66–79. doi: 10.1016/j.neuron.2009.12.023. [DOI] [PMC free article] [PubMed] [Google Scholar]
- 5.Farrer M.J. Genetics of Parkinson disease: paradigm shifts and future prospects. Nat. Rev. Genet. 2006;7:306–318. doi: 10.1038/nrg1831. [DOI] [PubMed] [Google Scholar]
- 6.Gai W.P., Yuan H.X., Jensen P.H. In situ and in vitro study of colocalization and segregation of alpha-synuclein, ubiquitin, and lipids in Lewy bodies. Exp. Neurol. 2000;166:324–333. doi: 10.1006/exnr.2000.7527. [DOI] [PubMed] [Google Scholar]
- 7.van Raaij M.E., van Gestel J., Subramaniam V. Concentration dependence of α-synuclein fibril length assessed by quantitative atomic force microscopy and statistical-mechanical theory. Biophys. J. 2008;95:4871–4878. doi: 10.1529/biophysj.107.127464. [DOI] [PMC free article] [PubMed] [Google Scholar]
- 8.Hoyer W., Antony T., Subramaniam V. Dependence of α-synuclein aggregate morphology on solution conditions. J. Mol. Biol. 2002;322:383–393. doi: 10.1016/s0022-2836(02)00775-1. [DOI] [PubMed] [Google Scholar]
- 9.Munishkina L.A., Henriques J., Fink A.L. Role of protein-water interactions and electrostatics in α-synuclein fibril formation. Biochemistry. 2004;43:3289–3300. doi: 10.1021/bi034938r. [DOI] [PubMed] [Google Scholar]
- 10.Burke K.A., Yates E.A., Legleiter J. Biophysical insights into how surfaces, including lipid membranes, modulate protein aggregation related to neurodegeneration. Frontiers Neurol. 2013;4:17. doi: 10.3389/fneur.2013.00017. [DOI] [PMC free article] [PubMed] [Google Scholar]
- 11.Hellstrand E., Grey M., Sparr E. Adsorption of α-synuclein to supported lipid bilayers: positioning and role of electrostatics. ACS Chem. Neurosci. 2013;4:1339–1351. doi: 10.1021/cn400066t. [DOI] [PMC free article] [PubMed] [Google Scholar]
- 12.Zhu M., Li J., Fink A.L. The association of α-synuclein with membranes affects bilayer structure, stability, and fibril formation. J. Biol. Chem. 2003;278:40186–40197. doi: 10.1074/jbc.M305326200. [DOI] [PubMed] [Google Scholar]
- 13.Necula M., Chirita C.N., Kuret J. Rapid anionic micelle-mediated α-synuclein fibrillization in vitro. J. Biol. Chem. 2003;278:46674–46680. doi: 10.1074/jbc.M308231200. [DOI] [PubMed] [Google Scholar]
- 14.Goers J., Uversky V.N., Fink A.L. Polycation-induced oligomerization and accelerated fibrillation of human α-synuclein in vitro. Protein Sci. 2003;12:702–707. doi: 10.1110/ps.0230903. [DOI] [PMC free article] [PubMed] [Google Scholar]
- 15.Lorenzen N., Lemminger L., Otzen D.E. The N-terminus of α-synuclein is essential for both monomeric and oligomeric interactions with membranes. FEBS Lett. 2014;588:497–502. doi: 10.1016/j.febslet.2013.12.015. [DOI] [PubMed] [Google Scholar]
- 16.Davidson W.S., Jonas A., George J.M. Stabilization of α-synuclein secondary structure upon binding to synthetic membranes. J. Biol. Chem. 1998;273:9443–9449. doi: 10.1074/jbc.273.16.9443. [DOI] [PubMed] [Google Scholar]
- 17.Jo E., McLaurin J., Fraser P.E. α-Synuclein membrane interactions and lipid specificity. J. Biol. Chem. 2000;275:34328–34334. doi: 10.1074/jbc.M004345200. [DOI] [PubMed] [Google Scholar]
- 18.Domanov Y.A., Kinnunen P.K. Islet amyloid polypeptide forms rigid lipid-protein amyloid fibrils on supported phospholipid bilayers. J. Mol. Biol. 2008;376:42–54. doi: 10.1016/j.jmb.2007.11.077. [DOI] [PubMed] [Google Scholar]
- 19.Sasahara K., Morigaki K., Hamada D. Binding of islet amyloid polypeptide to supported lipid bilayers and amyloid aggregation at the membranes. Biochemistry. 2012;51:6908–6919. doi: 10.1021/bi300542g. [DOI] [PubMed] [Google Scholar]
- 20.Pifer P.M., Yates E.A., Legleiter J. Point mutations in Aβ result in the formation of distinct polymorphic aggregates in the presence of lipid bilayers. PLoS ONE. 2011;6:e16248. doi: 10.1371/journal.pone.0016248. [DOI] [PMC free article] [PubMed] [Google Scholar]
- 21.Hane F., Drolle E., Leonenko Z. Amyloid-β aggregation on model lipid membranes: an atomic force microscopy study. J. Alzheimers Dis. 2011;26:485–494. doi: 10.3233/JAD-2011-102112. [DOI] [PubMed] [Google Scholar]
- 22.Last N.B., Rhoades E., Miranker A.D. Islet amyloid polypeptide demonstrates a persistent capacity to disrupt membrane integrity. Proc. Natl. Acad. Sci. USA. 2011;108:9460–9465. doi: 10.1073/pnas.1102356108. [DOI] [PMC free article] [PubMed] [Google Scholar]
- 23.Khemtémourian L., Doménech E., Killian J.A. Low pH acts as inhibitor of membrane damage induced by human islet amyloid polypeptide. J. Am. Chem. Soc. 2011;133:15598–15604. doi: 10.1021/ja205007j. [DOI] [PubMed] [Google Scholar]
- 24.Reynolds N.P., Soragni A., Seeger S. Mechanism of membrane interaction and disruption by α-synuclein. J. Am. Chem. Soc. 2011;133:19366–19375. doi: 10.1021/ja2029848. [DOI] [PubMed] [Google Scholar]
- 25.Ouberai M.M., Wang J., Welland M.E. α-Synuclein senses lipid packing defects and induces lateral expansion of lipids leading to membrane remodeling. J. Biol. Chem. 2013;288:20883–20895. doi: 10.1074/jbc.M113.478297. [DOI] [PMC free article] [PubMed] [Google Scholar]
- 26.Rabe M., Soragni A., Seeger S. On-surface aggregation of α-synuclein at nanomolar concentrations results in two distinct growth mechanisms. ACS Chem. Neurosci. 2013;4:408–417. doi: 10.1021/cn3001312. [DOI] [PMC free article] [PubMed] [Google Scholar]
- 27.Hellstrand E., Nowacka A., Sparr E. Membrane lipid co-aggregation with α-synuclein fibrils. PLoS ONE. 2013;8:e77235. doi: 10.1371/journal.pone.0077235. [DOI] [PMC free article] [PubMed] [Google Scholar]
- 28.Lashuel H.A., Hartley D., Lansbury P.T., Jr. Neurodegenerative disease: amyloid pores from pathogenic mutations. Nature. 2002;418:291. doi: 10.1038/418291a. [DOI] [PubMed] [Google Scholar]
- 29.Hashimoto M., Rockenstein E., Masliah E. Role of protein aggregation in mitochondrial dysfunction and neurodegeneration in Alzheimer’s and Parkinson’s diseases. Neuromolecular Med. 2003;4:21–36. doi: 10.1385/NMM:4:1-2:21. [DOI] [PubMed] [Google Scholar]
- 30.Pacheco C., Aguayo L.G., Opazo C. An extracellular mechanism that can explain the neurotoxic effects of α-synuclein aggregates in the brain. Frontiers Physiol. 2012;3:297. doi: 10.3389/fphys.2012.00297. [DOI] [PMC free article] [PubMed] [Google Scholar]
- 31.Lorenzen N., Nielsen S.B., Otzen D.E. The role of stable α-synuclein oligomers in the molecular events underlying amyloid formation. J. Am. Chem. Soc. 2014;136:3859–3868. doi: 10.1021/ja411577t. [DOI] [PubMed] [Google Scholar]
- 32.Stöckl M.T., Claessens M.M.A.E., Subramaniam V. Kinetic measurements give new insights into lipid membrane permeabilization by α-synuclein oligomers. Mol. Biosyst. 2012;8:338–345. doi: 10.1039/c1mb05293d. [DOI] [PubMed] [Google Scholar]
- 33.van Rooijen B.D., Claessens M.M.A.E., Subramaniam V. Membrane permeabilization by oligomeric α-synuclein: in search of the mechanism. PLoS ONE. 2010;5:e14292. doi: 10.1371/journal.pone.0014292. [DOI] [PMC free article] [PubMed] [Google Scholar]
- 34.van Rooijen B.D., Claessens M.M.A.E., Subramaniam V. Lipid bilayer disruption by oligomeric α-synuclein depends on bilayer charge and accessibility of the hydrophobic core. Biochim. Biophys. Acta. 2009;1788:1271–1278. doi: 10.1016/j.bbamem.2009.03.010. [DOI] [PubMed] [Google Scholar]
- 35.Quist A., Doudevski I., Lal R. Amyloid ion channels: a common structural link for protein-misfolding disease. Proc. Natl. Acad. Sci. USA. 2005;102:10427–10432. doi: 10.1073/pnas.0502066102. [DOI] [PMC free article] [PubMed] [Google Scholar]
- 36.Giasson B.I., Murray I.V., Lee V.M. A hydrophobic stretch of 12 amino acid residues in the middle of α-synuclein is essential for filament assembly. J. Biol. Chem. 2001;276:2380–2386. doi: 10.1074/jbc.M008919200. [DOI] [PubMed] [Google Scholar]
- 37.Pandey A.P., Haque F., Hovis J.S. Clustering of α-synuclein on supported lipid bilayers: role of anionic lipid, protein, and divalent ion concentration. Biophys. J. 2009;96:540–551. doi: 10.1016/j.bpj.2008.10.011. [DOI] [PMC free article] [PubMed] [Google Scholar]
- 38.van Raaij M.E., Segers-Nolten I.M., Subramaniam V. Quantitative morphological analysis reveals ultrastructural diversity of amyloid fibrils from α-synuclein mutants. Biophys. J. 2006;91:L96–L98. doi: 10.1529/biophysj.106.090449. [DOI] [PMC free article] [PubMed] [Google Scholar]
- 39.Armstrong R.A. Size frequency distributions of abnormal protein deposits in Alzheimer’s disease and variant Creutzfeldt-Jakob disease. Folia Neuropathol. 2007;45:108–114. [PubMed] [Google Scholar]
- 40.Soumpasis D.M. Theoretical analysis of fluorescence photobleaching recovery experiments. Biophys. J. 1983;41:95–97. doi: 10.1016/S0006-3495(83)84410-5. [DOI] [PMC free article] [PubMed] [Google Scholar]
- 41.Seu K.J., Cambrea L.R., Hovis J.S. Influence of lipid chemistry on membrane fluidity: tail and headgroup interactions. Biophys. J. 2006;91:3727–3735. doi: 10.1529/biophysj.106.084590. [DOI] [PMC free article] [PubMed] [Google Scholar]
- 42.Shvadchak V.V., Falomir-Lockhart L.J., Jovin T.M. Specificity and kinetics of α-synuclein binding to model membranes determined with fluorescent excited state intramolecular proton transfer (ESIPT) probe. J. Biol. Chem. 2011;286:13023–13032. doi: 10.1074/jbc.M110.204776. [DOI] [PMC free article] [PubMed] [Google Scholar]
- 43.Waxman E.A., Mazzulli J.R., Giasson B.I. Characterization of hydrophobic residue requirements for α-synuclein fibrillization. Biochemistry. 2009;48:9427–9436. doi: 10.1021/bi900539p. [DOI] [PMC free article] [PubMed] [Google Scholar]
- 44.Hovis J.S., Boxer S.G. Patterning and composition arrays of supported lipid bilayers by microcontact printing. Langmuir. 2001;17:3400–3405. [Google Scholar]
- 45.Murray D.H., Tamm L.K., Kiessling V. Supported double membranes. J. Struct. Biol. 2009;168:183–189. doi: 10.1016/j.jsb.2009.02.008. [DOI] [PMC free article] [PubMed] [Google Scholar]
- 46.Winner B., Jappelli R., Riek R. In vivo demonstration that alpha-synuclein oligomers are toxic. Proc. Natl. Acad. Sci. USA. 2011;108:4194–4199. doi: 10.1073/pnas.1100976108. [DOI] [PMC free article] [PubMed] [Google Scholar]
- 47.Braun A.R., Sevcsik E., Sachs J.N. α-Synuclein induces both positive mean curvature and negative Gaussian curvature in membranes. J. Am. Chem. Soc. 2012;134:2613–2620. doi: 10.1021/ja208316h. [DOI] [PMC free article] [PubMed] [Google Scholar]
- 48.Pandey A.P., Haque F., Hovis J.S. α-Synuclein-induced tubule formation in lipid bilayers. J. Phys. Chem. B. 2011;115:5886–5893. doi: 10.1021/jp1121917. [DOI] [PMC free article] [PubMed] [Google Scholar]
- 49.Ding H., Schauerte J.A., Gafni A. β-Amyloid (1–40) peptide interactions with supported phospholipid membranes: a single-molecule study. Biophys. J. 2012;103:1500–1509. doi: 10.1016/j.bpj.2012.08.051. [DOI] [PMC free article] [PubMed] [Google Scholar]
Associated Data
This section collects any data citations, data availability statements, or supplementary materials included in this article.