

Abstract
The small heat shock proteins (sHSPs) are a virtually ubiquitous and diverse group of molecular chaperones that can bind and protect unfolding proteins from irreversible aggregation. It has been suggested that intrinsic disorder of the N-terminal arm (NTA) of sHSPs is important for substrate recognition. To investigate conformations of the NTA that could recognize substrates we performed replica exchange molecular dynamics simulations. Behavior at normal and stress temperatures of the dimeric building blocks of dodecameric HSPs from wheat (Ta16.9) and pea (Ps18.1) were compared because they display high sequence similarity, but Ps18.1 is more efficient in binding specific substrates. In our simulations, the NTAs of the dimer are flexible and dynamic; however, rather than exhibiting highly extended conformations they retain considerable α-helical character and contacts with the conserved α-crystallin domain (ACD). Network analysis and clustering methods reveal that there are two major conformational forms designated either “open” or “closed” based on the relative position of the two NTAs and their hydrophobic solvent accessible surface area. The equilibrium constant for the closed to open transition is significantly different for Ta16.9 and Ps18.1, with the latter showing more open conformations at elevated temperature correlated with its more effective chaperone activity. In addition, the Ps18.1 NTAs have more hydrophobic solvent accessible surface than those of Ta16.9. NTA hydrophobic patches are comparable in size to the area buried in many protein-protein interactions, which would enable sHSPs to bind early unfolding intermediates. Reduced interactions of the Ps18.1 NTAs with each other and with the ACD contribute to the differences in dynamics and hydrophobic surface area of the two sHSPs. These data support a major role for the conformational equilibrium of the NTA in substrate binding and indicate features of the NTA that contribute to sHSP chaperone efficiency.
Introduction
The small heat shock proteins (sHSPs) and the related α-crystallins are a virtually ubiquitous class of low molecular weight (12 to 42 kDa) stress proteins characterized by a conserved ∼ 90 amino acid α-crystallin domain (ACD) (1–3). They are believed to play an important role in cellular protein quality control by preventing irreversible protein aggregation through an ATP-independent mechanism. sHSPs bind unfolding substrates, and sHSP-bound substrates can then be rescued and refolded by the action of ATP-dependent chaperones Hsp70/DnaK and cochaperones (1). Impaired expression and/or mutation of sHSPs are associated with a number of diseases related to protein folding such as Parkinson’s, diffuse Lewy body, Huntington’s disease, and Alzheimer’s (1,4,5). Mutations of sHSPs also cause cataracts in the eye, muscle myopathies, and neuropathies (1,6,7). In addition, altered expression of sHSPs is observed in certain cancers, and it has been suggested that sHSPs could be targets for novel therapeutics (5,8,9). Understanding the mechanism of sHSP function, therefore, is of considerable interest to many areas of biology and medicine.
The sHSP monomer structure comprises an N-terminal arm (NTA) of highly variable length and sequence, the conserved ACD, and a short, partially conserved C-terminal extension (1,2,10) (Fig. 1 A). However, the majority of sHSPs exist as oligomeric complexes in their native state (1). There are four available crystal structures of monodisperse, oligomeric HSPs: a dodecameric HSP from wheat (Triticum aestivum), Ta16.9 (10); Hsp16.5 from Methanocaldococcus janaschii (11) and Hsp14.0 from Sulfolobus tokodaii (12), both with 24 subunits; and Hsp16.0, a 16-mer from Schizosaccharomyces pombe (13). All are built from a homologous dimer. High-resolution oligomer structures of vertebrate sHSPs have been difficult to obtain because of their polydispersity, but structures of the ACD and dimeric substructure of several metazoan sHSPs, including human αB-crystallin, have recently been reported, and the αB-crystallin oligomer was modeled from NMR combined with other data (14). Structural data for a complete NTA are limited to six NTAs in the Ta16.9 dodecamer, where they form a knot-like structure between dimers (10) and four of 16 NTAs in S. pombe Hsp16.0. These NTAs are primarily sequestered within the oligomer, which is also believed to be the case for the unresolved NTAs. The signature ACD has a highly conserved structure, comprising a seven-stranded β-sandwich (10,11). The C-terminal extension makes contacts between dimers (10,11,14). Thus, the N- and C termini are both involved in sHSP oligomer assembly.
Figure 1.

Amino acid sequence similarity of Ta16.9 and Ps18.1 and starting structures of their dimers. (A) Sequence alignment of Ta16.9 and Ps18.1. Residues of Ps18.1 underlined in magenta were tested for cross-linking to substrate, and the relative degree to which specific residues of Ps18.1 were found to cross-link to model substrates (as reported by Jaya et al. (25)) is indicated by the number of magenta lines underneath residues tested for cross-linking. Residues highlighted with cyan showed a higher average rhSASA during the simulation. Residues of the NTA variable region are boxed in purple. (B) Ta16.9 dimer structure (1GME with modeled NTA_B). NTAs (residues 2 to 44) are labeled A (red) and B (magenta), ACDs are A (orange) and B (purple), and C-terminal extensions are C-ter_A (green) and C-ter_B (cyan). Cα atoms, on which distance constraints were applied, are shown with van der Waals representation; G63 in ACD_A to N127 in ACD_B (pink), and N127 in ACD_A to G63 in ACD_B (turquoise). (C) Superposition of energy minimized structure of Ta16.9 (yellow) and Ps18.1 (brown); Cα atom RMSD is 0.7 Å. To see this figure in color, go online.
Interaction between sHSPs and unfolded proteins is proposed to take place via exposed hydrophobic surface on the sHSP and substrates (1). Structural rearrangements of sHSP oligomers at increasing temperature that result in increased exposure of hydrophobic sites are well documented but may be different for different sHSPs (1,2). For some sHSPs, such as Ta16.9, this rearrangement appears to be dissociation to the dimer, exposing the NTAs and C termini, which otherwise stabilize the oligomer (10,15–18). Ta16.9 and other sHSPs also rapidly exchange subunits (primarily dimers) and exchange rates increase with temperature (19–22). The temperature-enhanced rate of dimer exchange has also been correlated with substrate binding (3). More subtle temperature-dependent rearrangements have also been proposed to lead to hydrophobic site exposure (15,23). Dynamic behavior of Ta16.9 and a homologous dodecamer from pea (Pisum sativum), Ps18.1, is further reflected in hydrogen-deuterium exchange experiments; the NTA and C-terminal extension fully exchange amide hydrogens in < 5 seconds (24). Together, these data indicate that the NTA is highly flexible, dynamic, and potentially intrinsically disordered.
Considerable data support an important role for the sHSP NTA in substrate binding. Using chimeric sHSPs Basha et al. (17) showed that the efficiency of substrate binding was dependent on the identity of the NTA for protection of firefly luciferase and citrate synthase. Deletion and mutation studies with other sHSPs also support an important, though not exclusive, role for the NTA in substrate interactions (1,2). Direct interaction of the NTA with substrates was recently demonstrated by cross-linking model substrates to Ps18.1 variants in which residues in the different sHSP domains were individually substituted with the UV-activated cross-linker p-benzoylphenylalanine (25). Importantly, all these studies indicate there is no single, defined substrate binding site, but rather different substrates interact with different parts of the NTA as well as sites elsewhere on the sHSP (17,25).
The flexibility of the NTA as demonstrated by dimer exchange, hydrogen-deuterium exchange, and lack of resolvable structure led us to investigate the conformational equilibrium of the NTA in sHSP dimers from Ta16.9 and Ps18.1 using replica exchange molecular dynamic (REMD) simulations. Results allow formulation of hypotheses concerning the substrate binding conformations of the NTA and the role of specific residues in controlling the conformational equilibrium of the sHSP.
Methods
Generation of Ta16.9 and Ps18.1 starting structures
The Ta16.9 dimer (PDB id: 1GME) that was used for the simulation includes monomer A and B. Each monomer has a NTA, residues 2 to 44 (which was modeled in monomer B), an α-crystallin domain (ACD), residues 45 to 136, and a C-terminal extension residues 137 to 151 (Fig. 1 A). For Ps18.1, no x-ray structure is available; however, pair-wise sequence alignment of Ps18.1 and Ta16.9 shows the proteins share 67.9% sequence identity and 79.2% sequence similarity (conservative and semi-conservative substitutions), determined using the EMBOSS web server (www.ebi.ac.uk/Tools/emboss/align) (Fig. 1 A). Such homology is sufficient to obtain accurate models (26,27); therefore, the Ta16.9 structure was used as a template to construct a model for Ps18.1 with MODELER (28). The structure of Ps18.1 obtained from the homology modeling shows 0.68 Å Cα RMSD with the x-ray structure of Ta16.9. The Ps18.1 dimer was built with PyMol, using Ta16.9 as the template, and the structure was validated using PROCHECK (29). The Ps18.1 dimer comprises monomer A and B, each having a NTA (residues 2 to 52), ACD (residues 53 to 143), and a C-terminal extension (residues 144 to 158). PROCHECK showed 90.1% of the residues in the most-favored regions of the Ramachandran plot, 9.2% of the residues in the additional allowed region, and 0.7% of the residues in generously allowed regions. None of the residues fall in the disallowed region, providing a robust model of Ps18.1 for the simulation.
Replica exchange molecular dynamics simulations
We used parallel REMD simulation (30), which effectively lowers the free-energy barrier by enhancing the probability of sampling high-energy configurations at elevated temperatures and thus allows efficient conformational sampling. The significant increase in conformational sampling and its suitability to study protein dynamics is well documented in the literature (31–34). Several identical copies (replicas) of the system were run in parallel, each differing in temperature. The neighboring replicas may exchange their temperature states based on a Boltzmann-weighted probability. Replicas are allowed to communicate at regular intervals during which exchange attempts are made based on a Monte Carlo criterion (31). When this condition was satisfied an exchange attempt was considered successful, and the conformations in neighboring replica temperatures were swapped. The velocity of the corresponding replica was then rescaled to the new replica temperature. The process was repeated iteratively during the simulation such that each replica evolved with a wide range of temperatures, enhancing conformational sampling (Fig. S1). A 41% exchange was observed for both Ta16.9 and Ps18.1.
Simulation details
The topology, coordinates, and force field parameters were generated by the program tleap (36). Side chains of polar residues were adjusted to neutral pH, and the net charge of the system was -2. The structures were subjected to energy minimization for 2000 cycles to remove van der Waals contacts of high potential energy. The first 1000 cycles were performed by steepest decent energy minimization, and the second 1000 cycles were minimized by conjugate gradient minimization. The minimized structure was used to generate chirality constraints to prevent unwanted rotation around the peptide bonds, which might occur at higher temperature during the REMD simulation.
Simulations were performed with the AMBER 10 molecular modeling package (36) with the AMBER FF03 force field (37,38). The force field is well known for its accuracy of sampling correct secondary structural elements in contrast to the older versions AMBER94 and AMBER99, which overstabilize the α-helical structure (39,40). In comparison with other force fields, AMBER FF03 consistently provides results close to experimental findings (39,41,42). Solvent molecules in the simulations were represented using implicit solvent with the generalized Born solvation model (43) and NVT ensembles. The SHAKE algorithm (44) was used to constrain the bond stretching freedom of all bonds involving hydrogens, and the nonbonded van der Waals and electrostatic cutoffs were taken as 16 Å. For REMD, sixteen replica temperatures were used ranging from 281.85 to 339.88 K (more precisely, 281.85, 285.39, 288.98, 292.60, 296.28, 300.00, 303.77, 307.58, 311.44, 315.36, 319.32, 323.33, 327.39, 331.50, 335.66, and 339.88 K). The temperatures were chosen from an exponential distribution to keep the exchange rate constant across all the replicas by increasing the temperature spacing at higher temperatures. The exchange rate was chosen as 0.4. Replica temperatures were maintained by weak coupling to the Langevin thermostat with a collision frequency of 1 ps−1. To prevent dissociation of the dimer, two distance constraints in the dimer interface were applied. For Ta16.9 they were between the Cα atoms of G63_A and N127_B and between N127_A and G63_B, and for Ps18.1 constraints were between G70_A and N134_B and between N134_A and G70_B (Fig. 1 B).
Before REMD simulations, the system was equilibrated for 200 ps, during which the temperature of each replica was gradually increased from 0 to the target temperature of that replica. After equilibration, REMD simulation was performed on the sHSP dimers using the Multisander program (36), which uses the Verlet algorithm. The integration step for the production run was 0.002 ps. Replica temperature exchange attempts were performed every 2 ps. The output and coordinate files were saved every 2 ps, and the total length for each of the simulations was 42 ns. The initial 15 ns of the simulations was considered to be the equilibration phase (see Figs. S2 to S4), the remaining 27 ns were therefore used for all of the analyses. All trajectories were processed with ptraj (36) to filter the trajectory corresponding to a given temperature. The simulations were run in parallel using 64 processors at the University of Arizona High Performance Computing Center (http://uits.arizona.edu/research-computing).
Analysis
Analysis of the simulations was performed by measuring various parameters including the radius of gyration (Rg), distance measurements, Cα RMSD, Cα atom fluctuations, estimation of equilibrium constant (Kop), and t-test using GraphPad software (www.graphpad.com), secondary structure prediction program DSSP (45), hydrophobic solvent accessible surface area (hSASA), residue specific hydrophobic solvent accessible surface area (rhSASA), hydrogen bond occupancy measurement, and contact pair analysis for the hydrophobic side-chain carbon atoms. The number of hydrophobic contacts between the hydrophobic residues of NTAs A and B was determined by counting the instances when the distance between any two side-chain carbon atoms was less than 6 Å. For these analyses, replicas at 300, 315, and 319 K were considered as they correspond to temperatures at which experiments testing sHSP chaperone activity have been performed. The software packages used in the analysis were the Amber tool ptraj, Matlab (http://www.mathworks.com), Xmgrace (http://plasma-gate.weizmann.ac.il/Grace), and Perl and tcl scripts implemented in VMD (46), which was also used for visualizing trajectory.
Clustering and network representation
Clustering and network representation methods were used to analyze conformational ensembles of the sHSP NTAs (47,48). These methods require construction of a pairwise RMSD matrix, and the NTA Cα atoms were considered for construction of the RMSD matrix between structures of the trajectory. Clustering was performed with the average linkage algorithm in Matlab (49), and centroid structures of each cluster were generated. Cytoscape (50) was used to construct a graphical layout of network nodes and links. Links between nodes were established based on a cutoff value on the RMSD matrix. Pairwise RMSD cutoff values of ≤ 7.5 Å for Ta16.9 and ≤ 8.0 Å for Ps18.1 were chosen so that cluster populations would be homogeneous and well segregated in the network diagram. An unweighted force-directed layout algorithm was used for the construction of the network representation (50). Because network construction is memory demanding, 500 structures at regular intervals were taken from an equilibrated trajectory segment of 15 to 42 ns as discussed later for network analysis. The average linkage clustering using Matlab for 500 and 5000 structures generated a similar centroid, indicating that the selected 500 structures provide a good representation of the conformational ensemble. Homogeneity of the cluster population was also ensured by calculating mean and standard deviation of Rg and determining the distance between the two NTAs for a given cluster (Tables 1 and S1). Distance was monitored between the center of mass of NTA_A to the center of mass of NTA_B in a dimer.
Table 1.
Analysis of the clusters of the sHSP NTAs at 300 and 319 K
| 300K |
319K |
|||||
|---|---|---|---|---|---|---|
| Ta16.9 | ||||||
| Cluster No. | hSASA | Distance | Rg | hSASA | Distance | Rg |
| 1 | 1922 ± 235 | 21.8 ± 2.3 | 15.6 ± 1.2 | 1977 ± 260 | 21.8 ± 2.4 | 15.6 ± 1.1 |
| 2 | 2012 ± 169 | 24.6 ± 4.0 | 16.8 ± 1.6 | 2169 ± 147 | 26.7 ± 3.5 | 17.8 ± 1.4 |
| 3 | NA | NA | NA | 2090 ± 136 | 22.6 ± 2.2 | 16.6 ± 0.9 |
| 4 | 2671 ± 167 | 39.4 ± 2.4 | 23.3 ± 1.4 | 2755 ± 176 | 39.1 ± 2.9 | 23.3 ± 1.5 |
| 5 | 1833 ± 129 | 24.9 ± 1.0 | 16.5 ± 0.6 | 1834 ± 150 | 24.6 ± 1.2 | 16.5 ± 0.7 |
| Ps18.1 | ||||||
| 1 | 2796 ± 330 | 21.6 ± 1.7 | 15.7 ± 0.7 | 3267 ± 139 | 31.4 ± 3.1 | 19.7 ± 1.3 |
| 2∗ | 3067 ± 263 | 30.2 ± 2.7 | 19.5 ± 0.8 | 3177 ± 267 | 24.9 ± 4.7 | 17.2 ± 1.9 |
| 3 | 2628 ± 206 | 18.3 ± 1.0 | 15.3 ± 0.8 | 2725 ± 279 | 20.6 ± 2.5 | 15.9 ± 0.8 |
| 4 | 3294 ± 159 | 30.7 ± 1.8 | 19.4 ± 0.7 | 3352 ± 139 | 40.4 ± 1.8 | 23.3 ± 0.8 |
| 5 | 3325 ± 106 | 40.4 ± 2.1 | 23.3 ± 0.9 | 3417 ± 165 | 35.5 ± 3.1 | 22.0 ± 1.4 |
| 6 | 2583 ± 120 | 23.0 ± 0.7 | 17.2 ± 0.3 | 2587 ± 111 | 23.1 ± 1.4 | 17.1 ± 0.4 |
| 7 | 3466 ± 150 | 34.8 ± 0.2 | 21.1 ± 0.1 | 3531 ± 135 | 33.4 ± 1.0 | 20.5 ± 0.4 |
Clustering was performed on the NTA Cα atoms of residues 2 to 44 for Ta16.9 and 2 to 52 for Ps18.1. A cluster was assigned as open (unshaded) or closed (bold) based on the centroid structure corresponding to that cluster (Figs. 2B and S8). Clusters are numbered in descending order according to the relative abundance of structures in that cluster. The average hSASA (Å2), distance between NTA_A and B (Å), and Rg (Å) of both NTAs together are indicated ± std. NA = cluster 3 of Ta16.9 was not observed at 300 K.
Cluster 2 of Ps18.1 at 319 K has smaller distance and Rg values; however, it is an open cluster because the average hSASA is greater than 3000 Å2, is similar to other open clusters.
Results
Starting structures of the Ta16.9 and Ps18.1 dimers
We hypothesize that the ability of the NTA to adopt multiple conformations is key to substrate binding by sHSPs. To have the possibility to correlate simulation results with function in substrate binding, we chose to compare Ta16.9 with the highly similar sHSP, Ps18.1 (67.9% amino acid identity and 79.2% amino acid similarity) (Fig. 1 A). Ps18.1 shows higher efficiency binding of specific substrates than Ta16.9 (17). The starting structures for the simulations were homologous dimers, since the dimeric state is proposed to be the active conformation of these sHSPs (1). The dimer structure for Ta16.9 was derived from the x-ray structure of the Ta16.9 dodecamer (1GME) (2). The resolved NTA (NTA_A) (residues 2 to 42) from one monomer was used to construct the missing NTA of the other monomer of the dimer (NTA_B) with Pymol (51). Fig. 1 B illustrates the energy minimized structure of the Ta16.9 dimer. The Ta16.9 structure was used to create a robust model of the Ps18.1 dimer. The two dimer structures are extremely similar with an average Cα RMSD of 0.7 Å (Fig. 1 C).
The NTAs exhibit open and closed conformations that vary with temperature and the sHSP
To examine the conformational equilibrium of the Ta16.9 and Ps18.1 dimers, we used parallel REMD run at 16 replica temperatures between 281.85 to 339.88 K for a total of 42 ns. REMD is an efficient method for enhanced conformational sampling (30). The overall profile of residue fluctuation during the simulation demonstrates, as predicted, that both the NTA and C-terminal extension have a high mobility compared with the ACD (Fig. S5).
To determine the position of NTA_A and NTA_B relative to each other in the dimer, we calculated their distance distributions at 300, 315, and 319 K (Fig. S6 A and B). The data reveal changes at the different temperatures, as well as differences between the two sHSPs. At 300 K, Ta16.9 has a two distance distributions with peaks at 22 and 38 Å, with a third peak at 27 Å appearing at 315 and 319 K. In comparison, Ps18.1 has three distributions at all three temperatures (20, 31, and 40 Å). The distribution around 20 Å is mainly attributable to close association of the NTAs and defines a closed (< 27 Å distance value) NTA conformation, whereas the distributions around the peaks 31 and 40 Å in Ps18.1 (27 and 38 Å in Ta16.9) are attributable to widely spaced NTAs, defining an open (≥ 27 Å distance value) NTA conformation (Fig. S6 A and B). At 315 and 319 K, where these sHSPs bind heat-denaturing substrates, a relative decrease in the population of the closed conformation and a corresponding increase in the open conformation are observed. Calculations of Rg of the NTA provide a similar picture to the distance data (Fig. S6 C and D). The NTAs intermittently open and close throughout the simulation suggesting that the conformational parameters monitored are changing as the replicas are moving because of the replica exchange (Fig. S7), even though the starting configuration of both sHSPs was the open state (Fig. 1 C). Notably, the population of the open conformation is larger and the increase in the open conformation at higher temperature is more pronounced for Ps18.1, the more efficient sHSP.
Clustering of NTA conformations reveals differences in response to temperature and in exposed hydrophobic surface area
As the NTA can be cross-linked to substrate as shown by Jaya et al. (25), cluster analysis of NTA conformations was performed to examine the exposure of potential hydrophobic substrate binding sites. Five and seven NTA conformational clusters were observed for Ta16.9 and Ps18.1, respectively (Figs. 2 and S8, and Tables 1 and S1). Clusters are classified into open or closed based on the distance between NTA_A and B, Rg and hSASA (calculated for NTA_A and B together) (Tables 1 and S1). At all temperatures, Ps18.1 exhibits more open conformations (Fig. 2 A, green circles) than Ta16.9, and the increase in open conformations with temperature is very dramatic for Ps18.1, with the majority of structures classified as open at 319 K. Details of the structures reveal that some of the open clusters observed in Ps18.1 are similar to clusters in Ta16.9. Cluster 1 of Ps18.1 is similar to cluster 2 of Ta16.9 at 319 K, where both NTA_A and NTA_B are compact, and cluster 5 of Ps18.1 is similar to cluster 4 of Ta16.9, where NTA_A is compact whereas NTA_B is partially unfolded (Figs. S8 and S9). However, Ps18.1 also possesses three unique open clusters (cluster 2, 4, and 7) at 319 K compared with Ta16.9 (Fig. S8). The distinction between open and closed conformations of Ta16.9 and Ps18.1 can be visualized in Fig. S10. Furthermore, although the average hSASA of open conformations is significantly higher than that of the closed conformations for both sHSPs, the average hSASA of even the closed conformations of Ps18.1 is higher than any of the Ta16.9 open conformations (Tables 1 and S1).
Figure 2.

Network representation of open and closed clusters defined by NTA conformations of Ta16.9 and Ps18.1 dimers at 300, 315, and 319 K. (A) Network of open (green) and closed (red) conformational clusters. (B) Centroid structures from the most abundant open or closed cluster at 319 K for Ta16.9 (clusters 1 and 2) or Ps18.1 (clusters 1 and 3). Red: NTA_A; Green: NTA_B; NTA hydrophobic residues shown in stick representation. Fig. S8 presents centroid structures for all clusters for both sHSPs. To see this figure in color, go online.
Fig. 2 B illustrates the most abundant open and closed centroid structures at 319 K for Ta16.9 (clusters 2 and 1) and Ps18.1 (clusters 1 and 3). These structures, along with the centroid structures from all other clusters (Fig. S8), illustrate that throughout the simulation the structures of the NTAs were relatively compact, as opposed to highly extended. Thus, although the NTA is flexible, it spends little time in a highly extended conformation during the simulation.
The difference in equilibrium constant (Kop) is consistent with a transition from a closed to an open state for efficient Ps18.1
The conformational transitions between the open and closed conformations are reversible in nature as assessed by NTA distance (Fig S7) and are observed in many of the independent replicas (Figs. S2 and S3). Kop was calculated by taking overlapping time segments as shown in Fig. S11. We observed a steady value for both Ta16.9 and Ps18.1 at 300, 315, and 319 K, which suggests that both systems are well equilibrated after 15 ns. There is a distinct difference in the Kop values of Ps18.1 (greater than 1) at elevated temperatures (315 and 319 K) compared with Ta16.9, which suggests that the open conformation is the preferential form for the efficient sHSP, whereas the closed conformation of both Ps18.1 and Ta16.9 is dominant at room temperature.
Kop was also calculated for nonoverlapping time segments by dividing the trajectory into five equal halves (see Table S2) for t-test analysis. The p-values (0.0046, 0.005, and 0.001 at 300, 315, and 319 K, respectively) are much less than the 95% or 99% confidence level values, strongly indicating that the difference in Kop between Ta16.9 and Ps18.1 at all three temperatures is statistically significant.
sHSP NTA retains considerable α-helical character
The secondary structural content of the NTA in Ta16.9 and Ps18.1 was determined using the program DSSP (45), which assigns secondary structure to individual residues. Secondary structures adopted by the NTA were coil, α-helix, turn, bend, and 310-helix, which occur interchangeably as a function of time (Table S3 and Fig. S12). The DSSP plots show pronounced α-helical content for the homologous residues in Ta16.9 and Ps18.1 throughout the simulation, suggesting retention of considerable α-helical character for the NTAs. In Ta16.9 three distinct stretches, residues P12-A18 (α1), P20-G33 (α2), and S36-A42 (α3) retained α-helix, whereas in Ps18.1 four stretches, residues P5-G10, P18-W24 (α1), P26-S40 (α2), and N45-S50 (α3), were observed to sample α-helix (Fig. S12 B). Retention of α-helical content results in a relatively compact conformational state for the NTAs.
NTA hydrophobic contacts correlate with the differential chaperone efficiency of the sHSPs
To gain an understanding of hydrophobic interactions within the NTAs of Ta16.9 and Ps18.1, contact analysis was performed between the side-chain carbon atoms of the hydrophobic residues for NTA_A and B of both sHSPs in the closed conformations at 319 K. Ta16.9 has on average 38 hydrophobic atomic contacts between NTA_A and B, whereas Ps18.1 has 99 (Table S4). At the residue level, 8 of 23 hydrophobic residues of Ta16.9 in NTA_A interact with several residues from NTA_B and vice versa (Figs. 3 and S13, and Table S4). For Ps18.1, on average 12 of 25 hydrophobic residues are involved in contact pairs, and a given residue of chain A interacts with more residues of chain B (and vice versa) compared with Ta16.9. Most contacts are formed by residues from the middle and proximal part of the NTA. The additional hydrophobic residues in the NTA of Ps18.1 (P5, F7, and F8; Fig. 1 A) do not contribute significantly to the overall greater interactions between Ps18.1 NTAs. The major region of interaction between NTAs corresponds to a variable region of the sequence and flanking α2 helix (see Figs. 1 A, 3, and S13), suggesting this region greatly influences NTA mobility.
Figure 3.

Heat map of hydrophobic residue contact pair analysis of NTA_A to NTA_B for both Ta16.9 and Ps18.1, calculated for the 319 K simulation (NTA_B to NTA_A in Fig. S13). Numbers inside the squares show the hydrophobic contact percentage between the pair of hydrophobic residues. Color bar indicates the hydrophobic contact percentage on a scale of 0 (blue) to 60 (red). Residue pairs having a contact percentage > 10% are shown. On the axes, residues in the variable region (see Fig. 1 A) (residues 25 to 39 of Ta16.9 and 31 to 46 of Ps18.1) are highlighted in green, and residues in helix α2 are boxed in red (residues 19 to 31 of Ta16.9 and 25 to 37 of Ps18.1). To see this figure in color, go online.
Analysis of rhSASA and hSASA further contrasts the sHSP open and closed conformations
Exposure of hydrophobic residues in all open and closed conformations at 319 K was analyzed by determining the average residue specific hydrophobic surface area (rhSASA) for all hydrophobic residues in the NTA (Fig. 4 A). Residues newly exposed in the open conformation are mostly located at the interface between NTAs (Fig. 4 B). Residues that possess a higher rhSASA in the open conformation (Figs. 4 and S14), as with the contact pair-forming residues (Figs. 3 and S13), belong to the variable sequence region and flanking α-helixes. Thus, this region appears important for controlling both the dynamic behavior of the NTA and the availability of potential substrate interaction sites.
Figure 4.

(A) Comparison of the average rhSASA (±std.) of hydrophobic residues from the NTA_A between open (black) and closed (yellow) conformations at 319 K for Ta16.9 and Ps18.1 (NTA_B in Fig. S14). Residues indicated with black dots have a larger rhSASA in the open conformation. Positions where Ps18.1 was tested and shown to cross-link to substrate (25) are underlined in magenta. Residues in the variable region are highlighted in green, and residues in helix α2 are boxed in red. (B) Surface representation of both sHSPs. Hydrophobic residues of the NTA displaying a higher rhSASA in the open conformation are in magenta, all others in turquoise. To see this figure in color, go online.
All the hydrophobic residues of both sHSPs were further classified to be “highly exposed” if a residue showed a ≥ 40% increase in rhSASA compared with the reference value for that residue (defined as exposure when present in the center of a tripeptide (52)) (Table S5). In Ta16.9, 35% of the hydrophobic residues in the NTAs of the dimer fit this criterion, whereas 58% are more exposed in Ps18.1. In contrast, a similar level of exposure between the ACDs (16% and 18% for Ta16.9 and Ps18.1, respectively) is observed, probably because of the 80% sequence identity of these domains. In the short, flexible C-terminal extensions all hydrophobic residues in both proteins are exposed. In the ACD, highly exposed hydrophobic residues are confined either to outer loop regions or to the outer β-strands, whereas in the NTA they are spread across the whole arm (Fig. 5). All the hydrophobic residues of Ps18.1 that displayed the highest degree of cross-linking to substrate as described in previous experiments (25), with the exception of L114, are in the NTA and also display high rhSASA, with the exception of F16. The single cross-linking site tested in the C terminus is also a highly exposed residue.
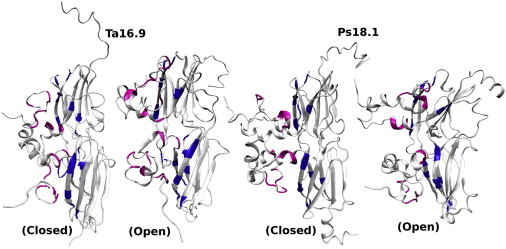
Figure 5.

rhSASA analysis for all hydrophobic residues mapped onto the open conformation dimers using the centroid structure from cluster 1 of Ps18.1 and cluster 2 of Ta16.9. The NTAs, ACDs, and C-terminal extensions are indicated in purple, yellow, and green, respectively. Hydrophobic residues having an average rhSASA ≥ 40% of the reference maximum for that residue are shown in (A) van der Waals representation. (B) Surface representation of the sHSPs with the respective color code as indicated. Additional hydrophobic surfaces are in cyan. To see this figure in color, go online.
The average hSASA was computed separately for the NTA, ACD, and the C-terminal extension of both Ta16.9 and Ps18.1 in their closed and open states (Table S6). Similar to the rhSASA, the hSASA of the NTA in its open state contributes significantly (45% in Ta16.9 and 55% in Ps18.1) to the greater hydrophobic exposure compared with their respective ACDs (∼ 33% in Ta16.9 and ∼ 31% in Ps18.1) and the C-terminal extensions (∼ 22% in Ta16.9 and ∼ 14% in Ps18.1), which display similar hydrophobic exposure irrespective of the their open or closed states.
Interactions between the NTA and ACD
Contacts between the NTAs and ACD were also examined as they may affect NTA flexibility. These interactions in Ta16.9 and Ps18.1 involve a similar number of hydrogen bonds and salt bridges, along with homologous, as well as distinct, hydrophobic contacts (Table S4). Residues involved in contact formation are shown as a heat map in Fig. S15, and are mapped onto the sHSPs in Fig. 6. Hydrophobes in a conserved NTA motif (residues 5 to 13 of Ta16.9 and 11 to 19 of Ps18.1 (53)) primarily make intermolecular contacts with ACD hydrophobes in β2 and β7, which form one edge of the ACD β-sandwich. These interactions include contacts observed in the Ta16.9 crystal structure and residues conserved in vertebrate sHSPs (10), suggesting this is a stabilizing contact common to all sHSPs. NTA hydrophobes proximal to the ACD contact primarily the opposite end of β7. Notably, α2 residues that form extensive contacts between NTAs (Figs. 3 and S13) are not involved in ACD contacts in Ps18.1 (Fig. S15). In contrast, five α2 residues from Ta16.9, P20, F21, F24, I27, and V28 of which I27, V28 are also part of the NTA variable region, form intermolecular contacts primarily with β6. In Ps18.1, the α2 and NTA variable region residues involved in ACD contacts are P26, F41, and P46, which interact with β6 and β7. Thus, these NTA hydrophobic contacts with the ACD in Ta16.9 contribute to the reduced exposure of hydrophobic surface of this sHSP.
Figure 6.
Residues forming contact pairs > 10% between the NTA (magenta) and the corresponding ACD (blue) mapped on Ta16.9 and Ps18.1 (see also Fig. S15). To see this figure in color, go online.
Discussion
Conformational ensembles observed in all-atom REMD simulations performed for two related sHSP dimers provide a framework for understanding how these unique chaperones recognize substrate. Relative to each other, the NTAs have two distinct conformational states; in one state the NTAs exhibit a closed conformation with multiple contacts between arms, whereas in the second state the arms have no or few contacts, defining an open conformation. Importantly, the open conformations increase at higher temperatures where the sHSP would bind substrate, and the sHSP with more efficient chaperone activity, Ps18.1, spends more time in the open conformation than the less efficient Ta16.9. These data along with detailed analysis of rhSASA and residue contacts suggest testable models for sHSP-substrate interaction sites.
The NTA exhibits properties of intrinsic disorder
The NTA has previously been suggested to be an intrinsically disordered region of the sHSPs (1,54,55). Our simulations provide insight into the nature of this disorder. In contrast to the ACD, the NTA shows major RMSD fluctuations of a noncooperative nature and exists as a dynamic ensemble of structures, which are characteristics of intrinsically disordered proteins (IDPs) (54). The NTA does not, however, exhibit fully disordered, extended arms, but rather retains helical segments throughout the simulation, particularly helix α2 and α3. Fluctuating secondary and tertiary structure of the NTAs, along with poorly packed side chains, indicate that the NTA disorder has features of molten globule protein structure. The hydrogen bond occupancy of amide protons observed in the simulation also reflects the more stable secondary structure of the ACD compared with the NTA (Fig. S16), and is consistent with hydrogen-deuterium exchange measurements (24). The most extended region of the NTA involves residues distal to α2. Substitution in this region of residues 1 to 4 of Ta16.9 with residues 1 to 10 of Ps18.1 significantly enhanced the ability of Ta16.9 to protect luciferase (17), which may result from high level of exposure and flexibility of these residues. The NTA amino acid composition is not wholly typical of described IDPs, which are enriched in Pro, Ser, and acidic residues (Asp and Glu), but depleted in hydrophobic residues except for Leu and Met (56). Of these residues, Ta16.9 and Ps18.1 show enrichment only of Pro and Ser, and have a high number of Phe residues, all of which have characteristics similar to those of NTAs from a majority of sHSPs (57). This composition may afford flexibility, but greater possibility for hydrophobic interactions, which are essential for sHSP capture and protection of denaturing substrates.
The sHSP conformational equilibrium controls the accessible hydrophobic surface area
The hydrophobic nature of interactions between sHSP and substrate are indicated by several studies, and it is generally recognized that sHSPs expose more hydrophobic surface at the elevated temperatures at which substrate proteins denature (1,2). Our simulations reveal that the average hSASA is significantly larger for open conformations compared with closed conformations of the NTAs for both Ta16.9 and Ps18.1 (Table 1). The shift toward more open forms at higher temperatures increases the hydrophobic sites available to bind unfolding proteins. Both sHSPs sample open and closed conformations, but Ps18.1, the more efficient chaperone, samples a much larger population of open conformations compared with Ta16.9 as demonstrated by the Kop. Open conformations display a larger hSASA than closed conformations, and in both conformations, the Ps18.1 NTAs have a larger hSASA than those of Ta16.9. This difference in hSASA is not simply a result of differences in total numbers, or potential surface area of hydrophobic amino acids. The total potential hydrophobic surface area in the NTAs based on the reference values for each residue as given in Table S5 (52) shows that Ps18.1 has 194% more potential hydrophobic surface area compared with Ta16.9 (4990 vs. 2567 Å2). However, the hSASA for the most abundant open cluster in Ps18.1 (cluster 1; 3267 ± 139 Å2) is an estimated 151 ± 17% of the most abundant open cluster of Ta16.9 (cluster 2; 2169 ± 147 Å2), indicating that more hydrophobic surface area is exposed on average in Ps18.1. The difference in hydrophobic residue exposure between the sHSPs is also reflected in the rhSASA analysis. In Ps18.1, 29 of 50 NTA hydrophobic residues have a high surface exposure (Table S5), versus only 16 of 46 in Ta16.9. Thus, it is the dynamics and specific conformations of the Ps18.1 NTA, rather than simple amino acid composition that control accessibility of the hydrophobic surface.
It is also significant that the exposed hydrophobic surface on the NTAs in the open state forms large patches, defined as a continuous hydrophobic surface area, available to interact with other proteins. The ACD and C-terminal extension mostly show segmented hydrophobic patches of ∼ 100 to 300 Å2, whereas hydrophobic patches on the NTAs are more continuous with areas ranging from ∼ 800 to ∼ 1700 Å2. Among the closed and open sHSP conformations, most hydrophobic patches were found in the open conformation (e.g., 1708 and 1526 Å2 for Ps18.1 clusters 1 and 2, respectively, and 1129 and 1097 Å2 for Ta16.9, clusters 2 and 4 respectively). Residues in the NTA that are highly cross-linked to substrate form part of the biggest patch in Ps18.1 (25). Hydrophobic patches are present in the NTA closed conformations, but are smaller in size (e.g., < 600 Å2 for Ta16.9). The hydrophobic patch in the β4-β8 groove of the ACD, which binds the C-terminal tail in the sHSP oligomeric form has been suggested to be a major substrate binding region. However, the observed small size of this patch, 260 Å2, may indicate it has a minor contribution to substrate binding. In contrast, the exposed hydrophobic surface area on the NTA of the open sHSP conformations compares well with the area buried in many protein-protein interactions (58,59), and suggests sHSPs could bind large hydrophobic surfaces of partially denatured proteins, rather than unfolded, random coil-like chains.
Residue contacts controlling NTA motional dynamics
rhSASA and contact pair analysis reveal that residues in the NTA variable region, which is common in all related plant sHSPs (53), contribute significantly to differences in the structural ensemble of the two sHSPs. When the NTAs are closed, hydrophobic residues in the variable region, along with the hydrophobic residues in helix α2, form more contact pairs between the NTAs in Ps18.1 than in Ta16.9. Exposure of these residues on opening leads to the observed larger hSASA of Ps18.1 potentially available to bind substrate. An analogous region in yeast Hsp26, referred to as the middle domain, exhibits a major conformational change at elevated temperatures, and is also a potential substrate binding region (23).
It is surprising, given the larger number of NTA hydrophobic contacts, that Ps18.1 spends more time in an open conformation with more exposed hydrophobic surface than Ta16.9. Features of the Ps18.1 structure must facilitate opening such that the increased hydrophobic surface of the NTAs is energetically favored. One reason could be the flexibility of NTA in Ps18.1, which results in a larger number of distinct clusters compared with Ta16.9, suggesting it is entropically more favorable. The larger number of Pro and Ser residues in the Ps18.1 variable region (as well as the entire NTA) may contribute to favorable energetics of Ps18.1 opening. Another contributing factor is likely the differences in hydrophobic contacts between the NTA and ACD of the two proteins. These contacts differ in both number and in relative position. In the open state residues I27 and V28 in α2 of Ta16.9 NTA_A contact the ACD, and in the closed state they contact NTA_B. Similarly, residues P20, F21, and F24 of NTA_B make hydrophobic contacts with the ACD. These residues, therefore, do not show a high rhSASA. In contrast, the homologous α2 residues in Ps18.1, F30, and L37 in NTA_B, do not participate in contact formation with the ACD, and contribute to the overall higher hSASA for Ps18.1. Engineering more flexibility into the variable region of Ta16.9 and altering contact interactions of α2 residues may enhance exposed hydrophobic surface area leading to a more efficient Ta16.9.
The flexibility of a protein often determines its effectiveness in forming strong protein-ligand interactions, with binding sites generally being more mobile than the rest of the protein (58,60,61). Many proteins do show segmental motion of protein subunits in isolation, whereas in the presence of substrate they are locked into a specific conformation (62). The flexibility of the NTAs of the sHSPs might be responsible for the high affinity/capacity binding of sHSPs with substrate.
Conclusions
The conformational ensembles of the NTAs of these sHSP dimers expose variable, large hydrophobic patches suitable for binding denaturing substrates. Efficiency of substrate binding is correlated with the extent of available hydrophobic surface, which is maximized when the NTAs are in an open conformation. Dynamic interactions both between NTAs and between the NTA and ACDs exert control over NTA opening. The open state preferentially exposes hydrophobic residues in NTA α2, which along with more distal hydrophobic residues, comprise these hydrophobic patches. Burying the NTA hydrophobic patches by binding unfolding substrate would be entropically favorable. Alternatively, as indicated by hydrogen-deuterium exchange experiments, the entropic penalty of substrate binding may be limited because the Ta16.9 and Ps18.1-substrate complexes show no increase in stable secondary structure (24). Thus, the NTA likely retains IDP characteristics in the substrate-bound, as well as the oligomeric state. sHSP-substrate complexes can therefore be considered to be “fuzzy complexes” (63,64) that exhibit flexibility and polymorphism of IDP interaction with substrates.
Acknowledgments
We thank Dr. Nomalie Jaya for her enthusiasm for studying the sHSPs using a simulation approach, which led to these experiments. Simulations were run at the University of Arizona High Performance Computing center.
Support was provided by NIH grant RO1 GM42762 and a Massachusetts Life Sciences Center (MLSC) New Faculty Research Award (E.V.), and by FOCUS Establishing Supercomputing Center of Excellence (F.T.).
Supporting Material
References
- 1.Basha E., O’Neill H., Vierling E. Small heat shock proteins and α-crystallins: dynamic proteins with flexible functions. Trends Biochem. Sci. 2012;37:106–117. doi: 10.1016/j.tibs.2011.11.005. [DOI] [PMC free article] [PubMed] [Google Scholar]
- 2.Van Montfort R., Slingsby C., Vierling E. Structure and function of the small heat shock protein/alpha-crystallin family of molecular chaperones. Adv. Protein Chem. 2001;59:105–156. doi: 10.1016/s0065-3233(01)59004-x. [DOI] [PubMed] [Google Scholar]
- 3.McHaourab H.S., Godar J.A., Stewart P.L. Structure and mechanism of protein stability sensors: chaperone activity of small heat shock proteins. Biochemistry. 2009;48:3828–3837. doi: 10.1021/bi900212j. [DOI] [PMC free article] [PubMed] [Google Scholar]
- 4.Laskowska E., Matuszewska E., Kuczyńska-Wiśnik D. Small heat shock proteins and protein-misfolding diseases. Curr. Pharm. Biotechnol. 2010;11:146–157. doi: 10.2174/138920110790909669. [DOI] [PubMed] [Google Scholar]
- 5.Sun Y., MacRae T.H. The small heat shock proteins and their role in human disease. FEBS J. 2005;272:2613–2627. doi: 10.1111/j.1742-4658.2005.04708.x. [DOI] [PubMed] [Google Scholar]
- 6.Graw J. Genetics of crystallins: cataract and beyond. Exp. Eye Res. 2009;88:173–189. doi: 10.1016/j.exer.2008.10.011. [DOI] [PubMed] [Google Scholar]
- 7.Hu Z., Chen L., Wang X. Structure, function, property, and role in neurologic diseases and other diseases of the sHsp22. J. Neurosci. Res. 2007;85:2071–2079. doi: 10.1002/jnr.21231. [DOI] [PubMed] [Google Scholar]
- 8.Ousman S.S., Tomooka B.H., Steinman L. Protective and therapeutic role for alphaB-crystallin in autoimmune demyelination. Nature. 2007;448:474–479. doi: 10.1038/nature05935. [DOI] [PubMed] [Google Scholar]
- 9.Arac A., Brownell S.E., Steinberg G.K. Systemic augmentation of alphaB-crystallin provides therapeutic benefit twelve hours post-stroke onset via immune modulation. Proc. Natl. Acad. Sci. USA. 2011;108:13287–13292. doi: 10.1073/pnas.1107368108. [DOI] [PMC free article] [PubMed] [Google Scholar]
- 10.van Montfort R.L., Basha E., Vierling E. Crystal structure and assembly of a eukaryotic small heat shock protein. Nat. Struct. Biol. 2001;8:1025–1030. doi: 10.1038/nsb722. [DOI] [PubMed] [Google Scholar]
- 11.Kim K.K., Kim R., Kim S.-H. Crystal structure of a small heat-shock protein. Nature. 1998;394:595–599. doi: 10.1038/29106. [DOI] [PubMed] [Google Scholar]
- 12.Hanazono Y., Takeda K., Miki K. Structural studies on the oligomeric transition of a small heat shock protein, StHsp14.0. J. Mol. Biol. 2012;422:100–108. doi: 10.1016/j.jmb.2012.05.017. [DOI] [PubMed] [Google Scholar]
- 13.Hanazono Y., Takeda K., Miki K. Nonequivalence observed for the 16-meric structure of a small heat shock protein, SpHsp16.0, from Schizosaccharomyces pombe. Structure. 2013;21:220–228. doi: 10.1016/j.str.2012.11.015. [DOI] [PubMed] [Google Scholar]
- 14.Delbecq S.P., Klevit R.E. One size does not fit all: the oligomeric states of αB crystallin. FEBS Lett. 2013;587:1073–1080. doi: 10.1016/j.febslet.2013.01.021. [DOI] [PMC free article] [PubMed] [Google Scholar]
- 15.Basha E., Jones C., Vierling E. Mechanistic differences between two conserved classes of small heat shock proteins found in the plant cytosol. J. Biol. Chem. 2010;285:11489–11497. doi: 10.1074/jbc.M109.074088. [DOI] [PMC free article] [PubMed] [Google Scholar]
- 16.Haslbeck M., Walke S., Buchner J. Hsp26: a temperature-regulated chaperone. EMBO J. 1999;18:6744–6751. doi: 10.1093/emboj/18.23.6744. [DOI] [PMC free article] [PubMed] [Google Scholar]
- 17.Basha E., Friedrich K.L., Vierling E. The N-terminal arm of small heat shock proteins is important for both chaperone activity and substrate specificity. J. Biol. Chem. 2006;281:39943–39952. doi: 10.1074/jbc.M607677200. [DOI] [PubMed] [Google Scholar]
- 18.Stromer T., Fischer E., Buchner J. Analysis of the regulation of the molecular chaperone Hsp26 by temperature-induced dissociation: the N-terminal domain is important for oligomer assembly and the binding of unfolding proteins. J. Biol. Chem. 2004;279:11222–11228. doi: 10.1074/jbc.M310149200. [DOI] [PubMed] [Google Scholar]
- 19.Bova M.P., McHaourab H.S., Fung B.K.-K. Subunit exchange of small heat shock proteins. Analysis of oligomer formation of alphaA-crystallin and Hsp27 by fluorescence resonance energy transfer and site-directed truncations. J. Biol. Chem. 2000;275:1035–1042. doi: 10.1074/jbc.275.2.1035. [DOI] [PubMed] [Google Scholar]
- 20.Friedrich K.L., Giese K.C., Vierling E. Interactions between small heat shock protein subunits and substrate in small heat shock protein-substrate complexes. J. Biol. Chem. 2004;279:1080–1089. doi: 10.1074/jbc.M311104200. [DOI] [PubMed] [Google Scholar]
- 21.Sobott F., Benesch J.L.P., Robinson C.V. Subunit exchange of multimeric protein complexes. Real-time monitoring of subunit exchange between small heat shock proteins by using electrospray mass spectrometry. J. Biol. Chem. 2002;277:38921–38929. doi: 10.1074/jbc.M206060200. [DOI] [PubMed] [Google Scholar]
- 22.Baldwin A.J., Lioe H., Benesch J.L.P. αB-crystallin polydispersity is a consequence of unbiased quaternary dynamics. J. Mol. Biol. 2011;413:297–309. doi: 10.1016/j.jmb.2011.07.016. [DOI] [PubMed] [Google Scholar]
- 23.Franzmann T.M., Menhorn P., Buchner J. Activation of the chaperone Hsp26 is controlled by the rearrangement of its thermosensor domain. Mol. Cell. 2008;29:207–216. doi: 10.1016/j.molcel.2007.11.025. [DOI] [PubMed] [Google Scholar]
- 24.Cheng G., Basha E., Vierling E. Insights into small heat shock protein and substrate structure during chaperone action derived from hydrogen/deuterium exchange and mass spectrometry. J. Biol. Chem. 2008;283:26634–26642. doi: 10.1074/jbc.M802946200. [DOI] [PMC free article] [PubMed] [Google Scholar]
- 25.Jaya N., Garcia V., Vierling E. Substrate binding site flexibility of the small heat shock protein molecular chaperones. Proc. Natl. Acad. Sci. USA. 2009;106:15604–15609. doi: 10.1073/pnas.0902177106. [DOI] [PMC free article] [PubMed] [Google Scholar]
- 26.Qu X., Swanson R., Tsai J. A guide to template based structure prediction. Curr. Protein Pept. Sci. 2009;10:270–285. doi: 10.2174/138920309788452182. [DOI] [PubMed] [Google Scholar]
- 27.Ginalski K. Comparative modeling for protein structure prediction. Curr. Opin. Struct. Biol. 2006;16:172–177. doi: 10.1016/j.sbi.2006.02.003. [DOI] [PubMed] [Google Scholar]
- 28.Eswar N., Marti-Renom M.A., Sali A. Comparative protein structure modeling using MODELLER. Curr. Protocals Bioinformatics. 2006;15(Suppl.):5.6.1–5.6.30. doi: 10.1002/0471250953.bi0506s15. [DOI] [PMC free article] [PubMed] [Google Scholar]
- 29.Laskowski R.A., MacArthur M.W., Thornton J.M. PROCHECK: a program to check the stereochemical quality of protein structures. J. Appl. Cryst. 1993;26:283–291. [Google Scholar]
- 30.Sugita Y., Okamoto Y. Replica-exchange molecular dynamics method for protein folding. Chem. Phys. Lett. 1999;314:141–151. [Google Scholar]
- 31.Pitera J.W., Swope W. Understanding folding and design: replica-exchange simulations of “Trp-cage” miniproteins. Proc. Natl. Acad. Sci. USA. 2003;100:7587–7592. doi: 10.1073/pnas.1330954100. [DOI] [PMC free article] [PubMed] [Google Scholar]
- 32.Ganguly D., Chen J. Atomistic details of the disordered states of KID and pKID. Implications in coupled binding and folding. J. Am. Chem. Soc. 2009;131:5214–5223. doi: 10.1021/ja808999m. [DOI] [PubMed] [Google Scholar]
- 33.Campbell Z.T., Baldwin T.O., Miyashita O. Analysis of the bacterial luciferase mobile loop by replica-exchange molecular dynamics. Biophys. J. 2010;99:4012–4019. doi: 10.1016/j.bpj.2010.11.001. [DOI] [PMC free article] [PubMed] [Google Scholar]
- 34.Sanbonmatsu K.Y., García A.E. Structure of Met-enkephalin in explicit aqueous solution using replica exchange molecular dynamics. Proteins. 2002;46:225–234. doi: 10.1002/prot.1167. [DOI] [PubMed] [Google Scholar]
- 35.Reference deleted in proof.
- 36.Case D.A., Darden T.A., Wang J. University of California; San Francisco: 2008. AMBER 10 Tools Users’ Manual. [Google Scholar]
- 37.Ponder J.W., Case D.A. Force fields for protein simulations. Adv. Protein Chem. 2003;66:27–85. doi: 10.1016/s0065-3233(03)66002-x. [DOI] [PubMed] [Google Scholar]
- 38.Duan Y., Wu C., Kollman P. A point-charge force field for molecular mechanics simulations of proteins based on condensed-phase quantum mechanical calculations. J. Comput. Chem. 2003;24:1999–2012. doi: 10.1002/jcc.10349. [DOI] [PubMed] [Google Scholar]
- 39.Hu Z., Jiang J. Assessment of biomolecular force fields for molecular dynamics simulations in a protein crystal. J. Comput. Chem. 2010;31:371–380. doi: 10.1002/jcc.21330. [DOI] [PubMed] [Google Scholar]
- 40.Hornak V., Abel R., Simmerling C. Comparison of multiple Amber force fields and development of improved protein backbone parameters. Proteins. 2006;65:712–725. doi: 10.1002/prot.21123. [DOI] [PMC free article] [PubMed] [Google Scholar]
- 41.Thompson E.J., DePaul A.J., Sorin E.J. Evaluating molecular mechanical potentials for helical peptides and proteins. PLoS ONE. 2010;5:e10056. doi: 10.1371/journal.pone.0010056. [DOI] [PMC free article] [PubMed] [Google Scholar]
- 42.Cino E.A., Choy W.Y., Karttunen M. Comparison of secondary structure formation using 10 different force fields in microsecond molecular dynamics simulations. J. Chem. Theory Comput. 2012;8:2725–2740. doi: 10.1021/ct300323g. [DOI] [PMC free article] [PubMed] [Google Scholar]
- 43.Tsui V., Case D.A. Theory and applications of the generalized Born solvation model in macromolecular simulations. Biopolymers. 2000-2001;56:275–291. doi: 10.1002/1097-0282(2000)56:4<275::AID-BIP10024>3.0.CO;2-E. [DOI] [PubMed] [Google Scholar]
- 44.Ryckaert J.P., Ciccotti G., Berendsen H.J.C. Numerical integration of the cartesian equations of motion of a system with constraints: molecular dynamics of n-alkanes. J. Comput. Phys. 1977;23:327–341. [Google Scholar]
- 45.Kabsch W., Sander C. Dictionary of protein secondary structure: pattern recognition of hydrogen-bonded and geometrical features. Biopolymers. 1983;22:2577–2637. doi: 10.1002/bip.360221211. [DOI] [PubMed] [Google Scholar]
- 46.Humphrey W., Dalke A., Schulten K. VMD: visual molecular dynamics. J. Mol. Graph. 1996;14:33–38. doi: 10.1016/0263-7855(96)00018-5. [DOI] [PubMed] [Google Scholar]
- 47.Vorontsov I.I., Miyashita O. Solution and crystal molecular dynamics simulation study of m4-cyanovirin-N mutants complexed with di-mannose. Biophys. J. 2009;97:2532–2540. doi: 10.1016/j.bpj.2009.08.011. [DOI] [PMC free article] [PubMed] [Google Scholar]
- 48.Ahlstrom L.S., Miyashita O. Molecular simulation uncovers the conformational space of the λ Cro dimer in solution. Biophys. J. 2011;101:2516–2524. doi: 10.1016/j.bpj.2011.10.016. [DOI] [PMC free article] [PubMed] [Google Scholar]
- 49.Shao J., Tanner S.W., Cheatham T.E., III Clustering molecular dynamics trajectories: 1. Characterizing the performance of different clustering algorithms. J. Chem. Theory Comput. 2007;3:2312–2334. doi: 10.1021/ct700119m. [DOI] [PubMed] [Google Scholar]
- 50.Shannon P., Markiel A., Ideker T. Cytoscape: a software environment for integrated models of biomolecular interaction networks. Genome Res. 2003;13:2498–2504. doi: 10.1101/gr.1239303. [DOI] [PMC free article] [PubMed] [Google Scholar]
- 51.DeLano W.L. DeLano Scientific; Palo Alto, CA: 2008. The PyMOL molecular graphic system. [Google Scholar]
- 52.Samanta U., Bahadur R.P., Chakrabarti P. Quantifying the accessible surface area of protein residues in their local environment. Protein Eng. 2002;15:659–667. doi: 10.1093/protein/15.8.659. [DOI] [PubMed] [Google Scholar]
- 53.Waters E.R., Vierling E. The diversification of plant cytosolic small heat shock proteins preceded the divergence of mosses. Mol. Biol. Evol. 1999;16:127–139. doi: 10.1093/oxfordjournals.molbev.a026033. [DOI] [PubMed] [Google Scholar]
- 54.Uversky V.N., Dunker A.K. Understanding protein non-folding. Biochim. Biophys. Acta. 2010;1804:1231–1264. doi: 10.1016/j.bbapap.2010.01.017. [DOI] [PMC free article] [PubMed] [Google Scholar]
- 55.Sudnitsyna M.V., Mymrikov E.V., Gusev N.B. The role of intrinsically disordered regions in the structure and functioning of small heat shock proteins. Curr. Protein Pept. Sci. 2012;13:76–85. doi: 10.2174/138920312799277875. [DOI] [PubMed] [Google Scholar]
- 56.Marsh J.A., Forman-Kay J.D. Sequence determinants of compaction in intrinsically disordered proteins. Biophys. J. 2010;98:2383–2390. doi: 10.1016/j.bpj.2010.02.006. [DOI] [PMC free article] [PubMed] [Google Scholar]
- 57.Kriehuber T., Rattei T., Buchner J. Independent evolution of the core domain and its flanking sequences in small heat shock proteins. FASEB J. 2010;24:3633–3642. doi: 10.1096/fj.10-156992. [DOI] [PubMed] [Google Scholar]
- 58.Sundberg E.J. Taylor and Francis, CRC Press; Boca Ratan, FL: 2009. The molecular architecture of protein-protein binding sides. [Google Scholar]
- 59.Chakrabarti P., Janin J. Dissecting protein-protein recognition sites. Proteins. 2002;47:334–343. doi: 10.1002/prot.10085. [DOI] [PubMed] [Google Scholar]
- 60.Tainer J.A., Getzoff E.D., Hendrickson W.A. The reactivity of anti-peptide antibodies is a function of the atomic mobility of sites in a protein. Nature. 1984;312:127–134. doi: 10.1038/312127a0. [DOI] [PubMed] [Google Scholar]
- 61.Tzeng S.-R., Kalodimos C.G. Protein activity regulation by conformational entropy. Nature. 2012;488:236–240. doi: 10.1038/nature11271. [DOI] [PubMed] [Google Scholar]
- 62.Young M.A., Gonfloni S., Kuriyan J. Dynamic coupling between the SH2 and SH3 domains of c-Src and Hck underlies their inactivation by C-terminal tyrosine phosphorylation. Cell. 2001;105:115–126. doi: 10.1016/s0092-8674(01)00301-4. [DOI] [PubMed] [Google Scholar]
- 63.Tompa P., Fuxreiter M. Fuzzy complexes: polymorphism and structural disorder in protein-protein interactions. Trends Biochem. Sci. 2008;33:2–8. doi: 10.1016/j.tibs.2007.10.003. [DOI] [PubMed] [Google Scholar]
- 64.Pancsa R., Fuxreiter M. Interactions via intrinsically disordered regions: What kind of motifs? IUBMB Life. 2012;64:513–520. doi: 10.1002/iub.1034. [DOI] [PubMed] [Google Scholar]
Associated Data
This section collects any data citations, data availability statements, or supplementary materials included in this article.