Abstract
Context:
Pulmonary vascular resistance (PVR) is a critical and essential parameter during the assessment and selection of modality of treatment in patients with congenital heart disease accompanied by pulmonary arterial hypertension.
Aim:
The present study was planned to evaluate non-invasive echocardiographic parameters to assess pulmonary vascular resistance.
Settings and Design:
This prospective observational study included 44 patients admitted in the cardiology and pediatric cardiology ward of our institution for diagnostic or pre-operative catheter based evaluation of pulmonary arterial pressure and PVR.
Materials and Methods:
Detailed echocardiographic evaluation was carried out including tricuspid regurgitation velocity (TRV) and velocity time integral of the right-ventricular outflow tract (VTIRVOT). These parameters were correlated with catheter-based measurements of PVR.
Results:
The TRV/VTIRVOT ratio correlated well with PVR measured at catheterization (PVRcath) (r = 0.896, 95% confidence interval [CI] 0.816 to 0.9423, P < 0.001). Using the Bland-Altman analysis, PVR measurements derived from Doppler data showed satisfactory limits of agreement with catheterization estimated PVR. For a PVR of 6 Wood units (WU), a TRV/VTIRVOT value of 0.14 provided a sensitivity of 96.67% and a specificity of 92.86% (area under the curve 0.963, 95% confidence interval 0.858 to 0.997) and for PVR of 8 WU a TRV/VTIRVOT value of 0.17 provided a sensitivity of 79.17% and a specificity of 95% (area under the curve 0. 0.923, 95% confidence interval 0.801 to 0.982).
Conclusions:
Doppler-derived ratio of TRV/VTIRVOT is a simple, non-invasive index, which can be used to estimate PVR.
Keywords: Pulmonary vascular resistance, pulmonary arterial hypertension, tricuspid regurgitation velocity, velocity time integral, noninvasive assessment
INTRODUCTION
There are many congenital cardiac anomalies which cause increased pulmonary blood flow leading to pulmonary artery hypertension (PAH) and obstructive pulmonary vascular disease.[1] Pulmonary hypertension is an important determinant of morbidity and mortality in these children. In Asia, a large number of patients with uncorrected congenital cardiac anomalies are referred late.[2] Most are found to have developed PAH and pulmonary vascular disease on cardiac catheterization. Complications from pulmonary hypertension arise both preoperatively and postoperatively, and they can severely limit surgical repair or long-term survival. Pulmonary vascular resistance (PVR) is a critical and essential parameter during the assessment and selection of modality of treatment in patients with congenital heart disease accompanied by PAH. The current standard for measuring PVR is by invasive measurement of flow and pressure in the pulmonary arteries. Although this technique is well established, its invasive nature precludes it from being used in the routine follow-up of patients undergoing treatment for pulmonary hypertension. A non-invasive method of evaluating PVR allows frequent assessments of PVR, facilitates the monitoring of individual patient responses, and provides remote-site assessment of PVR. Apart from that, it can be a good screening tool to decide which patients need the invasive assessment of PVR.
The present study was planned to evaluate non-invasive echocardiographic parameters to assess PVR in patients of pulmonary hypertension in unclassified congenital heart disease with unobstructed pulmonary flow. These parameters include the ratio of tricuspid regurgitation velocity (TRV) to the velocity time integral of the right-ventricular outflow tract (VTIRVOT). These parameters were correlated with catheter-based measurements of PVR.
MATERIALS AND METHODS
This prospective observational study included 44 patients admitted in the cardiology and pediatric cardiology ward of our institution with diagnosis of congenital heart disease with pulmonary hypertension with unobstructed pulmonary flow for diagnostic or pre-operative catheter-based evaluation of pulmonary arterial pressure and PVR from January 2012 to December 2013. All the patients had echocardiographic measurement of TRV ≥2.9 meter/second or estimated pulmonary arterial systolic pressure ≥37 mmHg. Written informed consent was obtained from all the patients or their parents. Study protocol was approved by the institutional ethics committee. Detailed echocardiographic evaluation and catheter-based measurements were carried out in the following manner.
Echocardiographic examination
Doppler echocardiography studies were performed with a Siemens Acuson CV70 machine using 4 or 9 MHz frequency probe. A single operator performed the procedures on the previous day of catheterization study (within a maximum span of 24 hours). The patients were either awake or under conscious sedation and positioned in the left lateral decubitus or supine position. The VTI profile of RVOT were obtained by placing a 1-to 2-mm pulsed wave Doppler sample volume in the proximal RVOT just within the pulmonary valve while imaging the great arteries in the parasternal short-axis view. Care was taken to align the sample volume and the axis of the blood stream correctly to obtain the highest possible Doppler velocity signals with the smallest amount of spectral dispersion. The VTI of the RVOT were measured three times and the average was taken. The TRV were obtained by continuous wave Doppler imaging in the parasternal, subcostal, or apical four-chamber view. The gain and filters of the machine was adjusted to precisely define the onset and end of both the RVOT profile and the tricuspid regurgitation velocity curve. In some cases, to better visualize the TRV trace, we enhanced the signal with an intravenous injection of agitated normal saline. The RVOT diameters were measured from the parasternal short-axis view at the base of the pulmonary valve leaflets and from inner edge to inner edge point.
Cardiac catheterization
Complete right and left cardiac catheterizations were performed with the patient under conscious sedation usually by way of the femoral artery and vein in the departmental catheterization laboratory. The operators were unaware of the result of echocardiography study. Pressures were measured in the right atrium, right ventricle, pulmonary artery, left ventricle, ascending and descending aortas. Pulmonary capillary wedge pressures (PCWPs) were measured by Swan Ganz catheter. None of the patients received oxygen during catheterization, and oxygen saturation was measured in the main pulmonary artery (mixed venous oxygen saturation, pulmonary capillary after wedging, right atrium and aorta. In selected cases, saturation was measured in some other chambers as well. Pulmonary flow (QP) swas calculated by the Fick method using estimated oxygen consumption from the tables published by Lafarge and Meittinen.[3] To calculate PVR indexed to body surface area (BSA) and expressed in Wood units (WU), we used the following formula:

Statistical analysis
Descriptive statistics were generated for all patients’ characteristics and reported as means and SDs or medians and interquartile ranges as appropriate. The correlation between PVR and TRV/VTIRVOT was assessed with Pearson's correlation coefficient. Regression models were constructed for PVR and TRV/VTIRVOT ratio. Variables included in the analysis were age and RVOTd. To assess the diagnostic value of the TRV/VTIRVOT ratio, considering PVR measured by catheterization as the “gold standard,” receiver operating characteristic curves were plotted using a dichotomized function of PVR and cutoff values of 6 and 8 WU. Sensitivity, specificity, and confidence intervals were also reported. Limits of agreement between PVR estimation by echocardiography and catheterization were assessed by Bland-Altman analysis. All analyses were performed with Statistical Package for the Social Sciences software (SPSS 14.0) for Windows Evaluation Version (SPSS Eval). All P values were two-tailed, and <0.05 was considered statistically significant.
RESULTS
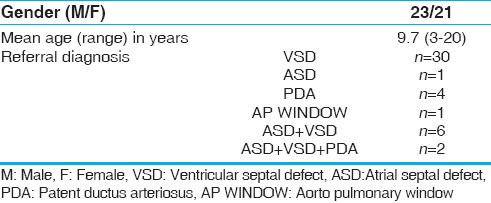
The clinical characteristics of the study population including the referral diagnosis are listed in Table 1. Ventricular septal defect (VSD) was the most common congenital heart disease leading to pulmonary hypertension in this study. Mean age of our patients was 9.7 with a range of 3-20 years. There were 21 females among the total of 44 patients.
Table 1.
Baseline clinical characteristics of patients (n = 44)

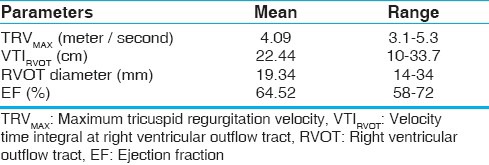
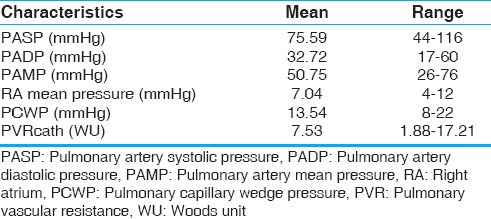
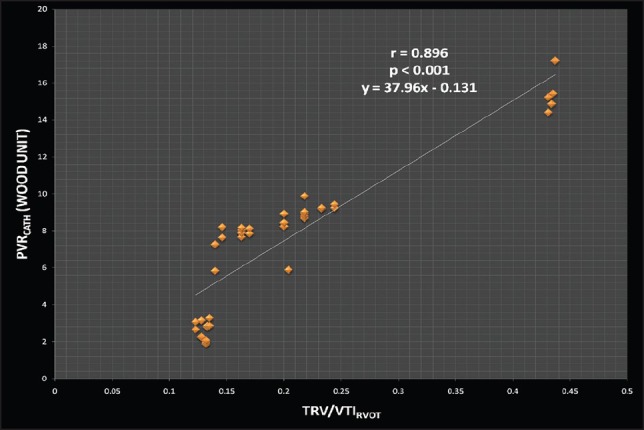
Echocardiographic profiles of our patients are described in Table 2. The mean tricuspid regurgitation maximum velocity (TRVMAX) of our patients were 4.09 meter/seconds with a range from 3.1-5.3 (Standard Deviation ± 0.73). The presence left-to-right shunts beyond the pulmonary valve, such as patent ductus arteriosus (PDA) and aortopulmonary window (A-P window), had no apparent effect on VTI profile. The catheter measurements of hemodynamic characteristics are listed in Table 3. Mean PVR measured at catheterization (PVRcath) was 7.54 WU, and mean pulmonary artery systolic pressure was 75.6 mmHg. Twelve of our patients had increased right atrial pressure >8 mmHg, and twenty had increased PCWP >12 mmHg. The TRV/VTIRVOT ratio correlated well with PVRcath (R2 = 0.802, P < 0.001). No correlation was found between PVR by Doppler and age or RVOT diameter. The linear regression analysis between PVRcath and TRV/VTIRVOT for all the patients is plotted in Figure 1 (r = 0.896, 95% confidence interval [CI] 0.816 to 0.9423). Based on our data, the equation derived from the linear regression for PVR (Wood units) calculation was:
Table 2.
Echocardiographic profiles of the patients (n = 44)

Table 3.
Hemodynamic characteristics of patients by cardiac catheterization (n = 44)

Figure 1.

Linear regression plot for pulmonary vascular resistance at catheterization (PVRcath) versus (TRV)/(VTIRVOT) ratio (r = 0.896, 95% confidence interval [CI] 0.816 to 0.9423, P < 0.001)
PVRDoppler(WU) = 37.96 × (TRV/ VTIRVOT)−0.131
Using the Bland-Altman analysis, PVRDoppler measurements derived from this equation showed satisfactory limits of agreement with PVRcath [Figure 2], with a mean value of 0.0 ± 1.73 (SD). The PVRDoppler and PVRcath values were well within one standard deviation. Receiver operating characteristic curves (ROC curve) were plotted using a dichotomized function of PVR for cutoff values of 6 WU and 8 WU [Figure 3]. These values are frequently used as cutoff points for PVR in decisions on surgical correction. In our study, for a PVR of 6 WU, a TRV/VTIRVOT value of 0.14 provided a sensitivity of 96.67% and a specificity of 92.86% (Area under the curve 0.963, 95% confidence Interval 0.858 to 0.997). Apart from that, for PVR of 8 WU a TRV/VTIRVOT value of 0.17 provided a sensitivity of 79.17% and a specificity of 95% (Area under the curve 0. 0.923, 95% confidence interval (CI) 0.801 to 0.982).
Figure 2.

Bland-Altman analysis showing the limits of agreement between PVRDoppler and PVRcath
Figure 3.

Receiver-operating characteristics (ROC) curves. a) For a PVR of 6 WU, a TRV/VTIRVOT value of 0.14 provided a sensitivity of 96.67% and a specificity of 92.86% (Area under the curve 0.963, 95% CI 0.858 to 0.997), b) For PVR of 8 WU, a TRV/VTIRVOT value of 0.17 provided a sensitivity of 79.17% and a specificity of 95% (area under the curve 0. 0.923, 95% CI 0.801 to 0.982)
DISCUSSION
Identification of high PVR is important as these patients may potentially benefit from recent advances in cardiothoracic surgical techniques and medications. Also, frequent measurements of PVR are needed for assessing operability and treatment follow-up. In this study, we found a good linear correlation between catheterization-derived PVR and Doppler-derived TRV/VTIRVOT(r = 0.896, 95% CI 0.816 to 0.9423, P < 0.001) in patients with congenital heart disease (CHD) and left-to-right shunts. This correlation was independent of age or RVOT diameter. In addition, we demonstrated a good correlation between catheterization-derived PVR and PVR estimated by Doppler.
Clinical examination, chest X-ray and electrocardiographic evaluation may suggest the presence of pulmonary hypertension; however, sensitivity is very low.[4,5] Echocardiography using tricuspid or pulmonary regurgitation velocity measurements,[6,7,8] with pulsed Doppler is more reliable in determining the presence of pulmonary hypertension. Although, these techniques are invaluable for diagnosis of PAH with CHD, they provide limited information on the state of the pulmonary vascular bed and about the progression of pulmonary vascular diseases in general. Estimation of left-to-right intracardiac shunting and in vivo evaluation of pulmonary blood flow patterns using velocity-encoded, phase-difference magnetic resonance imaging (MRI) has been recently reported.[9,10,11,12,13] This technique may hold a promise for the future; however, its value in the evaluation of pulmonary vascular disease remains to be investigated.
For frequent measurements of PVR noninvasively, echocardiography is more widely available than MRI and is also more time- and cost-effective. Abbas et al.,[14] reported a good correlation between catheterization-derived PVR and the ratio of TRV m/s to the VTI of the RVOT; VTI cm, in patients with normal or mildly increased PVR and with no systemic-to-pulmonary artery shunts. This was the first time that this novel index was utilized to distinguish between patients with elevated and normal PVR. The above study included a wide range of referral diagnosis starting from valvular heart disease to liver and kidney transplant patients who had a pulmonary catheter in place. All patients had PVR ≤6 WU and the equation TRV/TVIRVOT× 10 + 0.16 was shown to provide a good estimate of invasively derived PVR. Later studies, however, showed that this equation was less accurate in patients with significantly elevated PVR (>6 WU).
In 2008, Vlahos et al.,[15] demonstrated a linear correlation between PVR and TRV/VTIRVOT corrected for the indexed RVOT diameter in patients with high PVR and a wide range of clinical conditions. They first concluded that non-invasive estimation is feasible over a broad range of PVR values and could be a useful tool for estimation and longitudinal tracking of changes in PVR. Thereafter, Kouzu et al.,[16] described the use of the tricuspid regurgitant pressure gradient (TRPG)/VTIRVOT ratio to derive a reliable estimate of PVR from a wide range of causes in patients with PAH. Their study population included idiopathic PAH (n = 20), chronic thromboembolic pulmonary hypertension (n = 9), CHD (n = 9) and others. The TRPG/VTIRVOT ratio, which approximated the ratio of pulmonary artery pressure to pulmonary blood flow, showed an improved correlation coefficient of 0.82 (PVR = 187 + TRPG/VTIRVOT× 118, P < 0.001). A good number of the patients met the hemodynamic criteria of the international guidelines for the selection of lung transplantation and the candidates were defined as the poor-prognosis group. A TRPG/VTIRVOT>7.6 showed 85% sensitivity and 92% specificity for identifying patients in the poor-prognosis group. Dahiya et al.,[17] in 2010, demonstrated that echocardiographic estimation of PVR by utilizing TRV/VTIRVOT clearly distinguishes normal from abnormal values, but underestimates high PVR. They also proposed some correction for echo estimated PVR by incorporating RV outflow time and tissue Doppler parameter to overcome this problem. In another study, echocardiography was shown to be useful for the screening of patients with pulmonary hypertension and PVR >2 WU (utilizing TRV/VTIRVOT value of 0.14 as cutoff).[18] But they concluded that it remained disappointing for accurate assessment of high PVR. They also showed that VTI at left ventricular outflow tract (LVOT) may be an alternative to VTIRVOT for patients for whom accurate VTI at RVOT measurement is not possible.
In 2011, Ajami et al.,[19] designed a study to investigate whether the novel Doppler TRV/VTIRVOT ratio was a reliable noninvasive tool to assess PVR in patients with CHD and various left-to-right shunts accompanied with severe PAH and whether the ratio could be used as an index of operability. They found a linear correlation between catheterization-derived PVR and Doppler-derived TRV/VTIRVOT in patients with CHD and left-to-right shunts independent of age, BSA, or RVOTd (R2 = 0.562, P = 0.008). Based on their data, they also derived a linear regression equation for PVR (WU) calculation from Doppler images. Their study population was similar to our study, but their formula was only applicable to patients who had severe PAH. Based on our data, we derived the following formula for PVR (Wood units) estimation from Doppler study:
PVRDoppler(WU) = 37.96 × (TRV/ VTIRVOT)−0.131
As our study population included a broader range of pulmonary pressures, applicability of our formula may therefore be extended to a wider PAH population.
Recently, Abbas et al.,[20] analyzed data of 150 patients from five validation studies using TRV/ VTIRVOT as an estimate of higher PVR and compared them with invasive PVR measurements. Linear regression analysis between PVRcath and TRV/VTIRVOT revealed a good correlation (r = 0.76, P < .0001, Z = 0.92). The TRV/VTIRVOT was found to be a reliable method to identify patients with elevated PVR. In patients with TRV/VTIRVOT> 0.275, PVR was likely > 6 WU. In our study, for a PVR of 6 WU, a TRV/VTIRVOT value of 0.14 provided a sensitivity of 96.67% and specificity of 92.86% and for PVR of 8 WU a TRV/VTIRVOT value of 0.17 provided a sensitivity of 79.17% and a specificity of 95%. The cutoff values were lower in our study that might be due to differing clinical and catheterization lab settings. Our study population comprised only patients of pulmonary hypertension in CHD with unobstructed pulmonary flow, whereas Abbas et al., had a heterogeneous group of patients from five different studies.
The Fick method was used to calculate QP during catheterization in our study, contrary to Abbas et al.,[14] who used thermodilution to calculate cardiac output in their original study for measurement of catheterization-derived PVR. However, thermodilution may be inaccurate in the presence of intracardiac shunts, and so the Fick method is preferable in these patients. Moreover, the oxygen consumption value used in the formulas to calculate pulmonary and systemic flow can be difficult to determine. Although, direct measurement is more reliable and preferable, we used an indirect prediction based on the tables of Lafarge and Meittinen. As yet, there is no consensus on the relative advantages and drawbacks of using direct measurement versus indirect prediction of oxygen consumption.
Efforts to define an index for the precise selection of patients with high PVR who will remain free of significant hemodynamic disturbances after surgery have met with only limited success to date. The pulmonary-to-systemic resistance ratio, the level of PVR, and vasoreactivity tests of the pulmonary vascular bed have all been considered important criteria for the selection of patients for surgery. In addition, a PVR value of 6 to 8 WU has been shown to be useful as a cutoff point for operability in children with large VSD or PDA. A baseline PVR index <6 WU associated with a pulmonary-to-systemic resistance ratio of <0.3 has been interpreted as a predictor of favorable surgical outcome in surgery for biventricular repair, and this index makes the vasoreactivity tests unnecessary. In the present study, a TRV/VTIRVOT value of 0.14 provided a sensitivity of 96.67% and a specificity of 92.86% for PVR >6 WU and a TRV/VTIRVOT value of 0.17 provided a sensitivity of 79.17% and a specificity of 95% for PVR >8 WU.
In conclusion, we found a good correlation between catheterization-derived PVR and TRV/VTIRVOT. We believe that TRV/VTIRVOT, a simple, non-invasive Doppler-derived index, can be used to estimate PVR. This index is clinically useful as a supplementary diagnostic tool for the selection of patients most likely to benefit from surgery without problematic post-operative complications and for long term follow-up.
Limitations
Not all the patients of CHD with PAH have TR. So, the equation and the index cannot be utilized in such patients of PAH with absent TR. There is also large inter-observer variation in obtaining Doppler measurements. Proper alignment and meticulous tracing is of immense importance. We tried to decrease these effects by utilizing single-operator service for echocardiography and using the mean of multiple measurements. Vasoreactivity tests were not included in our study protocol. Another limitation was obtaining different setups during the catheterization-derived PVR and Doppler measurements. Invasive and non-invasive measurements were not performed simultaneously in the present study. However, simultaneous measurements of echocardiography may become inaccurate due to suboptimal positioning of the patient. The delay within 24 hours between echocardiography and catheterization was acceptable in other studies.[15,21] More research incorporating higher numbers of CHD patients are needed to establish the utility of the present Doppler criteria.
Footnotes
Source of Support: Nil
Conflict of Interest: None declared
REFERENCES
- 1.McGoon M, Gutterman D, Steen V, Barst R, McCrory DC, Fortin TA, et al. American College of Chest Physicians. Screening, early detection, and diagnosis of pulmonary hypertension: ACCP evidenced-based clinical practice guidelines. Chest. 2004;126:14S–34S. doi: 10.1378/chest.126.1_suppl.14S. [DOI] [PubMed] [Google Scholar]
- 2.Saxena A. Congenital heart disease in India: A status report. Indian J Pediatr. 2005;72:595–8. doi: 10.1007/BF02724185. [DOI] [PubMed] [Google Scholar]
- 3.LaFarge CG, Miettinen OS. The estimation of oxygen consumption. Cardiovasc Res. 1970;4:23–30. doi: 10.1093/cvr/4.1.23. [DOI] [PubMed] [Google Scholar]
- 4.Surawicz B. Electrocardiographic diagnosis of chamber enlargement. J Am Coll Cardiol. 1986;8:711–24. doi: 10.1016/s0735-1097(86)80207-8. [DOI] [PubMed] [Google Scholar]
- 5.Zellers T, Gutgesell HP. Nonivasive estimation of pulmonary artery pressure. J Pediatr. 1989;114:735–41. doi: 10.1016/s0022-3476(89)80129-5. [DOI] [PubMed] [Google Scholar]
- 6.Isobe M, Yazaki Y, Takaku F, Koizumi K, Hara K, Tsuneyoshi H, et al. Prediction of pulmonary arterial pressure in adults by pulsed Doppler echocardiography. Am J Cardiol. 1986;57:316–21. doi: 10.1016/0002-9149(86)90911-2. [DOI] [PubMed] [Google Scholar]
- 7.Martin-Duran R, Larman M, Trugeda A, Vazquez de Prada JA, Ruano J, et al. Comparison of Doppler-determined elevated pulmonary arterial pressure with pressure measured at cardiac catheterization. Am J Cardiol. 1986;57:859–63. doi: 10.1016/0002-9149(86)90627-2. [DOI] [PubMed] [Google Scholar]
- 8.Matsuda M, Sekiguchi T, Sugishita Y, Kuwako K, Iida K, Ito I. Reliability of non-invasive estimates of pulmonary hypertension by pulsed Doppler echocardiography. Br Heart J. 1986;56:158–64. doi: 10.1136/hrt.56.2.158. [DOI] [PMC free article] [PubMed] [Google Scholar]
- 9.Rebergen SA, Ottenkamp J, Doornbos J, van der Wall EE, Chin JG, de Roos A. Postoperative pulmonary flow dynamics after Fontan surgery: Assessment with nuclear magnetic resonance velocity mapping. J Am Coll Cardiol. 1993;21:123–31. doi: 10.1016/0735-1097(93)90726-h. [DOI] [PubMed] [Google Scholar]
- 10.Be’eri E, Maier SE, Landzberg MJ, Chung T, Geva T. In vivo evaluation of Fontan pathway flow dynamics by multidimensional phase-velocity magnetic resonance imaging. Circulation. 1998;98:2873–82. doi: 10.1161/01.cir.98.25.2873. [DOI] [PubMed] [Google Scholar]
- 11.Evans AJ, Iwai F, Grist TA, Sostman HD, Hedlund LW, Spritzer CE, et al. Magnetic resonance imaging of blood flow with a phase subtraction technique: In vitro and in vivo validation. Invest Radiol. 1993;28:109–15. doi: 10.1097/00004424-199302000-00004. [DOI] [PubMed] [Google Scholar]
- 12.Van Rossum AC, Sprenger M, Visser FC, Peels KH, Valk J, Roos JP. An in vivo validation of quantitative blood flow imaging in arteries and veins using magnetic resonance phase-shift techniques. Eur Heart J. 1991;12:117–26. doi: 10.1093/oxfordjournals.eurheartj.a059857. [DOI] [PubMed] [Google Scholar]
- 13.Hundley WG, Li HF, Lange RA, Pfeifer DP, Meshack BM, Willard JE, et al. Assessment of left-toright intracardiac shunting by velocity-encoded, phasedifference magnetic resonance imaging. A comparison with oximetric and indicator dilution techniques. Circulation. 1995;91:2955–60. doi: 10.1161/01.cir.91.12.2955. [DOI] [PubMed] [Google Scholar]
- 14.Abbas AE, Fortuin FD, Schiller NB, Appleton CP, Moreno CA, Lester SJ. Simple method for noninvasive estimation of pulmonary vascular resistance. J Am Coll Cardiol. 2003;41:1021–7. doi: 10.1016/s0735-1097(02)02973-x. [DOI] [PubMed] [Google Scholar]
- 15.Vlahos AP, Feinstein JA, Schiller NB, Sil verman NH. Extension of Doppler-derived echocardiographic measures of pulmonary vascular resistance to patients with moderate or severe pulmonary vascular disease. J Am Soc Echocardiogr. 2008;21:711–4. doi: 10.1016/j.echo.2007.10.004. [DOI] [PubMed] [Google Scholar]
- 16.Kouzu H, Nakatani S, Kyotani S, Kanzaki H, Nakanishi N, Kitakaze M. Noninvasive estimation of pulmonary vascular resistance by Doppler echocardiography in patients with pulmonary arterial hypertension. Am J Cardiol. 2009;103:872–6. doi: 10.1016/j.amjcard.2008.11.039. [DOI] [PubMed] [Google Scholar]
- 17.Dahiya A, Vollbon W, Jellis C, Prior D, Wahi S, Marwick T. Echocardiographic assessment of raised pulmonary vascular resistance: Application to diagnosis and follow-up of pulmonary hypertension. Heart. 2010;96:2005–9. doi: 10.1136/hrt.2010.204834. [DOI] [PubMed] [Google Scholar]
- 18.Roule V, Labombarda F, Pellissier A, Sabatier R, Lognone T, Gomes S, et al. Echocardiographic assessment of pulmonary vascular resistance in pulmonary arterial hypertension. Cardiovasc Ultrasound. 2010;8:21. doi: 10.1186/1476-7120-8-21. [DOI] [PMC free article] [PubMed] [Google Scholar]
- 19.Ajami GH, Cheriki S, Amoozgar H, Borzouee M, Soltani M. Accuracy of Doppler-derived estimation of pulmonary vascular resistance in congenital heart disease: An index of operability. Pediatr Cardiol. 2011;32:1168–74. doi: 10.1007/s00246-011-0035-4. [DOI] [PubMed] [Google Scholar]
- 20.Abbas AE, Franey LM, Marwick T, Maeder MT, Kaye DM, Vlahos AP, et al. Noninvasive assessment of pulmonary vascular resistance by Doppler echocardiography. J Am Soc Echocardiogr. 2013;26:1170–7. doi: 10.1016/j.echo.2013.06.003. [DOI] [PubMed] [Google Scholar]
- 21.Selimovic N, Rundqvist B, Bergh CH, Andersson B, Petersson S, Johansson L, et al. Assessment of pulmonary vascular resistance by Doppler echocardiography in patients with pulmonary arterial hypertension. J Heart Lung Transplant. 2007;26:927–34. doi: 10.1016/j.healun.2007.06.008. [DOI] [PubMed] [Google Scholar]


